Ichimoku Cloud
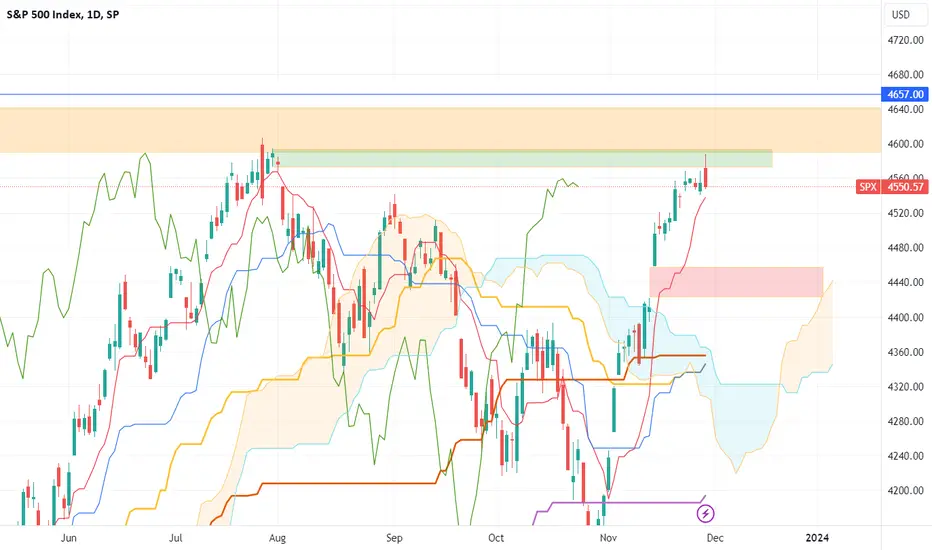
Wallgreens Long for 2024This morning I received a volatility alert on $NASDAQ:WBA. The stock had earnings today and the resulting price action was bearish down to a significant potential support level.
The Trade
The Weekly the Ichimoku 9-period (red line) shows that short term 50% level as it goes flat providing a Weekly entry point. The risk is that price makes another major low. In my trading toolbox I call this setup a "TS Recap." I discuss these during my Weekly Livestreams here on Tradingview. I was able t
WLong
Validating $RIVN Ichimoku and Fibonacci - Trend AffirmedI want to validate RIVN on Ichimoku and Fibonacci.
The trend seems to be intact and not broken as it h as a big support at 20 as shown below. If it breaches the 26.8 resistance which is the Fib Resistance, it has to just fly from there.
Will watch closely and please provide the feedback
$BTC Daily $42K New Target and Stop loss $36k?This was my earlier analysis on BTCUSD and you can find it there
Based on my relearning of Ichimoku and Fib, looks like 38K is a big resistance on Daily. It has to break it and then 40s is next! Let me know what you think and how I can improve
My new target is FWB:42K and stop loss is 36K based on Fib and Kijun Sen
$STNE Fibonacci and Ichimoku Daily As always learning or going back to learning. A chart a day makes one happy every day!
Take Profit and Stop Loss
Used Fibonacci 4 Hour for Stop loss and for take profit used Daily Fibonacci. Now Ichimoku is the base chart for guidance
You always learn by doing it. I bought it on my long term plan and am also setting an alert for this on Trading View.
Ichimoku Cloud: How To GuideHave you ever considered using the Ichimoku Cloud, a powerful and versatile technical analysis tool that goes beyond traditional chart analysis?
💜 If you appreciate our guides, support us with boost button 💜
Discover the Ichimoku Cloud, technical analysis tool developed by Japanese journalist Goichi Hosoda in the late 1960s.
This method visually represents support and resistance levels, providing crucial insights into trend direction and momentum.
Let's delve into the key aspects of t
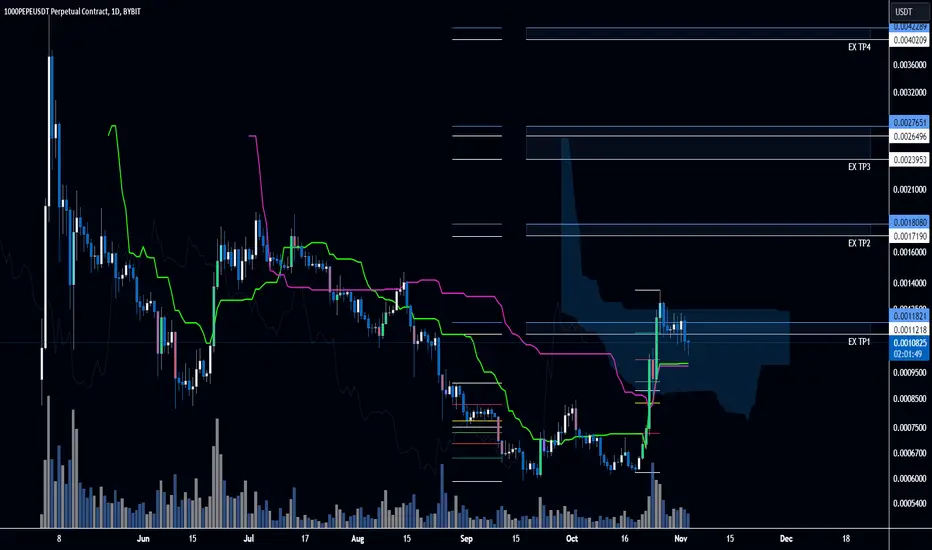
1000PEPEUSDT.P Bybit - TargetsPEPE broke up from its bottom range after a beautiful double bottom and it's trying to take support above Extended Zone 1 (TP1).
When this is happening, I see PEPE flying through targets and maybe end up to TP4 quite fast.
Watch this meme coin, it's going to be interesting :)
How not to trade Gold. Really.Double Top preceded by a 50% Fibonacci was a bad trade idea. Lost 1K on this for trying someone else idea. Also lifted the SL to 1779-1782 area to act as the biggest risk I would take in this position. Even thought I knew the risks. I normally do not trade Gold since I do not have enough money. I could have taken gains at 1770 instead 📞 I'm such a noob.
Market Insights: Germany, Europe's only HopeRecent market movements in Germany and Shanghai have unveiled an intriguing confluence of factors worth exploring.
In Germany, the monthly market trends reveal a mixed narrative. While the indices have shown a bearish trend over the last few months, there are hints of optimism. The Tenkan-Sen remains above the Kijun-Sen, and the price is positioned above the Tenkan-Sen, traditionally regarded as bullish signals. The Senkou Span A hovers above Senkou Span B, and crucial indicators are above the