#XMRUSDT #12h (Binance) Broadening wedge break & retest [SHORT]XMR (Monero) pulled back to resistance printing a shooting star, marking a possible local top.
Could retrace down to 100EMA or even 200MA supports if market corrects.
⚡️⚡️ #XMR/USDT ⚡️⚡️
Exchanges: Binance Futures, Bitget Futures
Signal Type: Regular (SHORT)
Leverage: Isolated (10.0X)
Amount: 5.4%
Entry Targets:
1) 600.39 - 100.0%
Take-Profit Targets:
1) 533.25 - 50.0%
2) 466.04 - 50.0%
Stop Targets:
1) 622.80 - 100.0%
Trailing Configuration:
Stop: Breakeven -
Trigger: Target (1)
Published
Moving Averages
Delta Air Lines Might Be Losing AltitudeDelta Air Lines has been sliding since June, and some traders may think it’s breaking key support.
The first pattern on today’s chart is the June 11 low of $76.40. DAL bounced at the level early last month, but now it’s sliding through it.
Second, the 50-day simple moving average (SMA) is falling. Prices have also crossed below the 200-day SMA. That may reflect longer-term weakening.
Next, the 8-day exponential moving average (EMA) is falling and has dipped under its 21-day EMA. MACD has also
AS: Cup Breakout Above 50 SMA at Resistance💡 Swing setup idea
50 SMA Strategy
🔎 Analysis summary:
The stock just crossed the 50-day moving average and is reaching resistance while closing a cup pattern. This alignment of trend, pattern and level makes the breakout area key to watch. The upside potential is projected by the depth of the cup from the breakout point.
👀 Levels to watch:
Entry trigger: Break above $30.55
Target: $35
Stop: Under the support / base of the pattern
💬 Will AS break through resistance and continue higher?
Datadog (DDOG) — Strong Growth, but Is the Valuation Justified?Datadog is a leading cloud observability and security platform, benefiting from the structural growth of cloud computing, artificial intelligence, and increasingly complex IT infrastructure.
However, a strong business does not necessarily make a stock an attractive investment at any price.
1. BUSINESS MODEL AND COMPETITIVE ADVANTAGES
Datadog provides a unified platform covering infrastructure monitoring, application performance monitoring (APM), log management, cloud security, and digital exp
WMT — Walmart recovers 16% off the low, now testing the 0.618
Walmart is at 118.39, easing 0.35% after a recovery that has carried the stock roughly 16% off the September low at 101.65.
The structure has turned decisively. The descending trendline off the May high at 133.00 contained every bounce from June through September — price broke above it in early October and has not looked back. Since that break, the stock has cleared the 0.236 at 109.05, the 0.382 at 113.63, and the 0.5 at 117.32, all in a matter of weeks.
The moving averages tell the same s
LG ELECTRONICS (KRX: 066570)🏢 LG ELECTRONICS (KRX: 066570)
🇰🇷 South Korea’s consumer-electronics leader, offering diversified exposure to home appliances, premium televisions, automotive electronics, HVAC, robotics, and AI data-center cooling.
Approximately 34,900 employees · Technology / Consumer Electronics sector.
─────────────────────────────
💰 KEY VALUATION
• Price: KRW 201,500 (≈ $146.5)
• Market Cap: KRW 33.95T (~$24.7B)
• P/E (trailing): 38.0x
• Forward P/E: 12.6x (PEG 0.27)
• P/B: 1.06x
• Dividend Yield: 0.84%
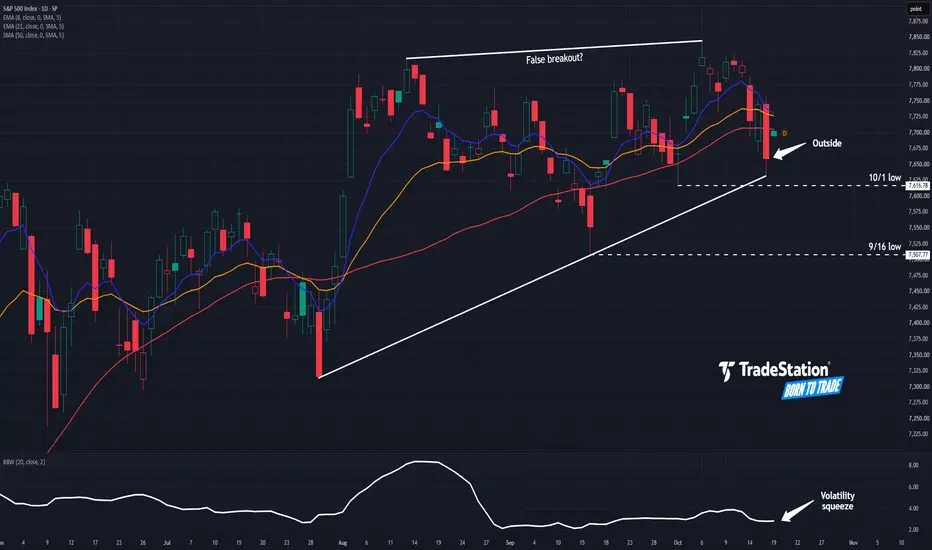
S&P 500: Cracks Forming?The S&P 500 is chopping near record highs, and some traders may see downside risk.
The first pattern on today’s chart is October 6’s all-time of 7,845 -- less than half a percent above its previous record in early August. The index has made higher lows at a steeper angle, creating a potentially bearish ascending wedge.
Second, Friday’s high surpassed Thursday’s. A lower low followed. Such a bearish outside day could be viewed as a reversal signal.
Third, the index dipped under its 50-day simp
Apple Tests $348 Resistance After Record CloseKey Highlights
Apple closed at a record $343.46 on October 16, up 0.43% for the day and 2.03% for the week while the Nasdaq Composite fell 4.5%.
AAPL has tested the $347 to $348 resistance area for four consecutive sessions, with an all-time intraday high of $348.15 set on October 13.
The stock has posted the highest close of the 50-session window three times in the last four sessions.
Apple's 20-day SMA sits near $337.42 and its 50-day SMA near $325.70, leaving the latest close above bo
NVDA Tests Major Support After 10.5% Drop From RecordKey Highlights
NVIDIA closed at $214.13 on October 16, down 1.43% for the day and 6.61% for the week, leaving the stock 10.50% below its October 6 record close of $239.24.
NVDA has returned to a recurring support zone around $207 to $215, where the stock has recorded eight closes since August 21 and three prior session lows.
The stock is trading below its 20-day SMA near $228.18 and its 50-day SMA near $223.08, putting short-term momentum under pressure.
Second-quarter fiscal 2027 revenue
Tesla Tests $352.84 Range Floor as Volatility SurgesKey Highlights
Tesla closed at $354.72 on October 16, down 2.13% for the day and 7.31% for the week after a five-session losing streak.
Friday's $21.17 trading range from $370.50 to $349.33 equaled about 5.97% of the closing price and was the widest of the past 50 sessions.
Trading volume reached about 62.1 million shares, roughly 72% above the 36.2 million average of the previous 30 sessions and the third-heaviest volume of the period.
All 34 closes since August 31 have remained between
Bitcoin Tests the 50-Day SMA for the 4th Time — Will $80K Break?Today, I’m analyzing Bitcoin ( BINANCE:BTCUSDT ) on the 4-hour time frame to build a clearer outlook for its next potential move.
Bitcoin’s strong bullish move yesterday failed to break above the Resistance Zone($82,960-$81,950), while the sharp decline in the S&P 500 added renewed selling pressure across the crypto market.
Can Bitcoin defend the 50_SMA(Daily) again, or is a deeper correction below $80,000 approaching?
Macro Outlook
U.S. stock indices, particularly the S&P 500, have start
AUDUSD 15M: 15 Trades, 11 Wins — Ryan-Trend Pulse I've been testing Ryan-Trend Pulse on AUDUSD using the 15-minute timeframe, combining indicator signals with the 200 EMA trend filter.
The results so far:
📈 Performance Snapshot
✅ Winning trades: 11
❌ Losing trades: 4
📊 Total trades: 15
⚙️ The Strategy
1. 200 EMA — Identify the Trend
🟢 Long: Price breaks above the 200 EMA.
🔴 Short: Price breaks below the 200 EMA.
2. Ryan-Trend Pulse — Confirm the Entry
Wait for the first valid indicator signal after the EMA breakout, ideally
RMD: Cup-and-Handle at Resistance Above 50 SMA💡 Swing setup idea
50 SMA Strategy
🔎 Analysis summary:
The stock reached resistance above the 50-day moving average while closing a cup-and-handle pattern. This alignment of trend, pattern and level makes the breakout area key to watch. The upside potential is projected by the depth of the cup-and-handle from the breakout point.
👀 Levels to watch:
Entry trigger: Break above $242.40
Target: $302.34
Stop: Under the support / base of the pattern
💬 Will RMD break through resistance and con
CTSH: Cup-and-Handle Breakout from 50 SMA💡 Swing setup idea
50 SMA Strategy
🔎 Analysis summary:
The stock came from the 50-day moving average and is reaching resistance while closing a cup-and-handle pattern. This alignment of trend, pattern and level makes the breakout area key to watch. The upside potential is projected by the depth of the cup-and-handle from the breakout point.
👀 Levels to watch:
Entry trigger: Break above $65.52
Target: $93.95
Stop: Under the support / base of the pattern
💬 Will CTSH break through resista
When Ichimoku Turns but the Golden Cross Holds: A Case Study in Two trend tools can disagree for weeks. Ichimoku is the fast signal: it reacts first and gives more false alarms. The golden cross (SMA 50 over SMA 200) is the slow signal: it is late, but it filters noise. This case study shows how a core-and-flexible plan handles a position when the two split.
Example chart: CAPITALCOM:SPX500, Daily, Ichimoku Itto Classic preset (9/26/52, disp 26), SMA 50 and SMA 200.
STEP 1 · THE EPISODE
• Late June 2025: golden cross, after an April 2025 death cross.
•
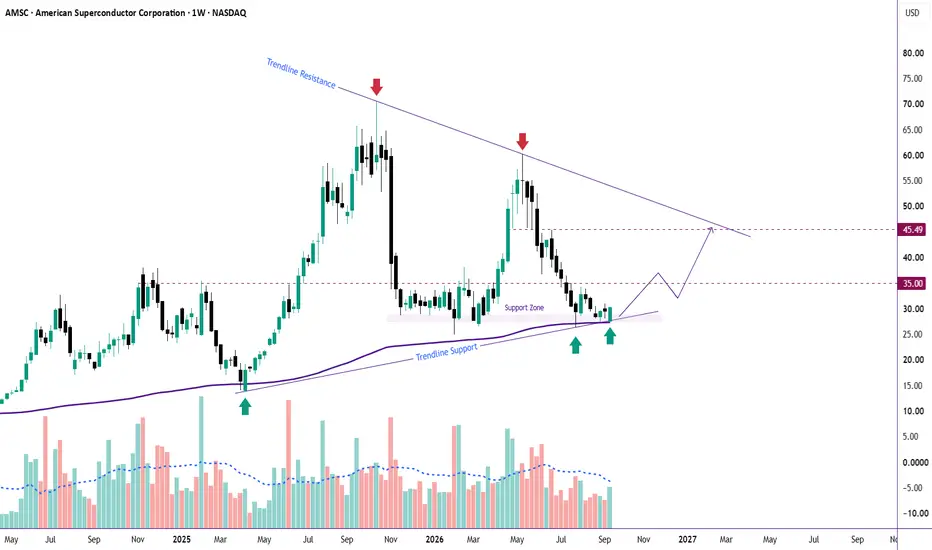
AMSC: Bullish Candle at Weekly EMA200 Confluence🧱 The Structure
AMSC has been building a base right on top of the rising trendline and weekly EMA200 confluence — the same zone that's absorbed pullbacks since the 2025. Price is now pressing back up off it, keeping the higher-low sequence intact.
⚡ The Setup
This is the tactical trigger for the bigger picture: on the monthly chart, AMSC is coiling under a trendline that's capped every major rally since 2008. This weekly base is the mechanism that could carry price into that historic confluence
The Mistake Most Traders Make: Moving Average Crossover StrategyHello, Traders!
Moving average crossovers are among the most popular trading techniques. Many traders use them to identify potential changes in trend direction.
However, one common mistake is entering a trade immediately whenever two moving averages cross.
1. The Crossover Happens Too Late
Moving averages are based on past price data. By the time a crossover appears, the market may have already made a significant move.
Entering at that point without evaluating the price structure can res
GBP/USD Rises as BOE Hike Bets Meet Softer U.S. DollarGBP/USD traded higher on Friday with the British Pound near 1.3330 and on track for a solid weekly gain. Sterling has been helped by August U.K. GDP unexpectedly rising 0.1%, reinforcing the idea that the economy can absorb tighter monetary policy better than feared. Governor Andrew Bailey also said second-round inflation effects from the energy shock remain subdued so far, but markets still expect a 25-bps BOE hike at the November meeting as headline inflation stays above target.
The U.S. sid
DDOG — Ascending Triangle Breakout Retest Happening-Rally Ahead?The retest is happening finally.
DDOG has broken above the multi-year ascending-triangle resistance around $200 and is now pulling back toward the breakout zone.
The key level is $200 — ideally this former resistance turns into support. More importantly, the retest sits just above daily EMA200, the strongest dynamic support. This confluence support zone makes it worth considering for a long trade.
🟢 $200: Breakout/retest zone — must hold
🎯 $250: First resistance
🎯 $275: Major resistance
🚀
Bitcoin FOMO Is Rising — Is $84K Next or a Pullback First?Bitcoin ( BINANCE:BTCUSDT ) has experienced significant volatility over the past 24 hours after the U.S. CPI release pressured U.S. stock indices and added selling pressure across the crypto market.
Today, despite generally unfavorable U.S. economic data, Bitcoin showed a relatively limited bearish reaction and has started to recover strongly after briefly moving below the 50_SMA(Daily) .
Can buyers turn this recovery into a breakout above the Resistance Zone and push Bitcoin back toward $84,
Palantir Sneaks HigherPalantir Technologies rallied in August, and now it may be breaking out.
The first pattern on today’s chart is the gap after earnings, revenue and guidance beat estimates. That may reflect bullish fundamentals.
Second, the 50-day simple moving average (SMA) had a “golden cross” above the 200-day SMA the following month. That could suggest that the long-term trend has turned bullish.
Third, the 8-day exponential moving average (EMA) has remained above the 21-day EMA. MACD is also rising. Is th
Fast Signal, Slow Signal: Ichimoku + Golden Cross on BTCUSDTrend tools move at different speeds. A fast signal reacts first and can flip back. A slow signal arrives late but tells you whether a change has lasted. Ichimoku is the fast signal; the golden cross (SMA 50 above SMA 200) is the slow one. A trend is confirmed when the slow signal catches up with the fast one.
Example chart: Bitcoin (CRYPTO:BTCUSD), Daily. Ichimoku Itto, Crypto preset (20/60/120 · disp 30), because Bitcoin trades 7 days a week. SMA 50 and SMA 200.
FAST SIGNAL · ICHIMOKU
• Pric
AMD: Support at 50 SMA, Next Stop ATH💡 Swing setup idea
50 SMA Strategy
🔎 Analysis summary:
The stock came down to the support at the 50-day moving average. The next target is the all-time high. This alignment of trend and level makes the bounce area key to watch. The upside potential is projected toward the all-time high from the support area.
👀 Levels to watch:
Entry trigger: Break above $530.10
Target: $658.52
Stop: Under the support
💬 Will AMD bounce from the 50 SMA and push toward its all-time high? Let me know in th
PEB: Cup-and-Handle Breakout from 50 SMA💡 Swing setup idea
50 SMA Strategy
🔎 Analysis summary:
The stock just came from the 50-day moving average, reaching resistance while closing a cup-and-handle pattern. This alignment of trend, pattern and level makes the breakout area key to watch. The upside potential is projected by the depth of the cup-and-handle from the breakout point.
👀 Levels to watch:
Entry trigger: Break above $19.60
Target: $21.69
Stop: Under the support / base of the pattern
💬 Will PEB break through resistanc