XPTUSD (Platinum Spot) LONG — 1W ALMA Setup (WR 82%)█ SETUP
Platinum spot · CAPITALCOM:XPTUSD · 1W · long only.
ALMA Averaging Strategy: ALMA 3 / σ2, SD band 2, min diff 1 bar to add / 1 bar to exit, 25% per bar, up to 4 adds, hard stop −10% from average entry.
Strategy Tester (platinum 1W, matched alert):
Win rate 82% · profit factor 3.1 · max drawdown 26%
Typical hold ~21 bars on winners · long-only weekly sleeve on spot CFD
═
█ WHY NOW
The metals complex sold off into May CPI week; spot platinum is being worked on a slower clock than the 3D perp book.
Two weekly ALMA long adds are live on the same 1W template — first fill 07 Jun, fresh add 14 Jun on the weekly bar. This is averaging a correction inside an 82% WR backtest sleeve, not a breakout chase.
═
█ MACRO
Headwinds: CPI / higher-for-longer rate bets hit non-yielding hedges — gold and BINANCE:BTCUSDT fell together into the print. Industrial metals stay sensitive to USD and growth scares.
Offsetting: China’s extended official gold-buying streak supports the broader precious-metals bid. Weekend geopolitical headline relief helped risk assets bounce — platinum often lags gold on the way down and catches up on mean-reversion legs.
Platinum = precious + industrial hybrid — auto/catalyst demand matters alongside the safe-haven tape.
═
█ OUTLOOK
Positive factors
- 82% WR / PF 3.1 on the 1W ALMA template for this symbol
- Fresh weekly add on 14 Jun — signal still inside the 24h publication window
- Metals complex stabilizing after CPI shock; spot 1D leg already green in the live book
Negative factors
- Weekly bars = slow feedback; macro gap risk can overshoot a %-based stop
- Past backtest ≠ live fills on CFD spot (spread, roll, session gaps)
Base case: weekly mean-reversion inside the ALMA add zone if the metals complex holds post-CPI.
Bear case: USD strength + growth scare extends the slide · −10% stop from working average on each lot.
Educational idea. Live position — past backtest ≠ future results. NFA.  Long
Long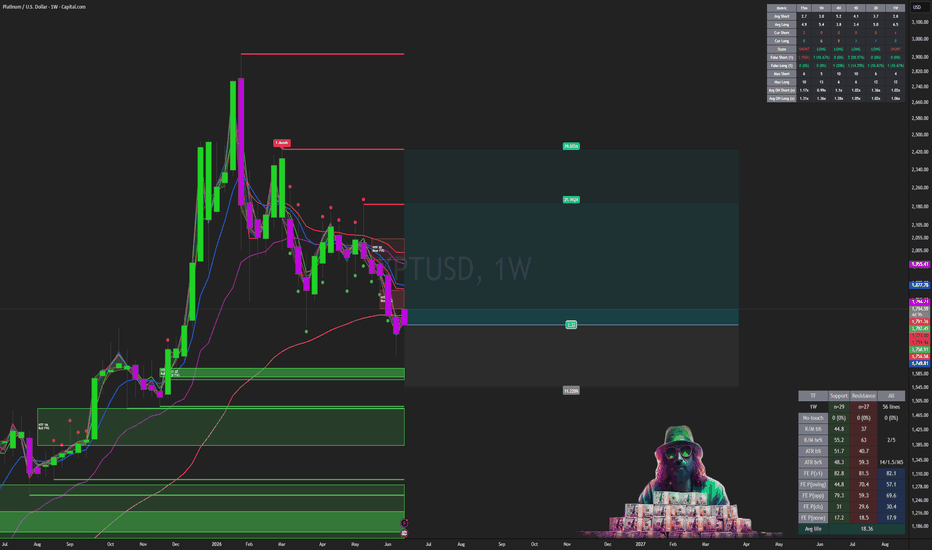
 Long
Long
Can you rely on RELY?Why we like RELY
Trend has flipped up on the higher timeframe. Price is back above the 50-week and 200-week SMAs and holding above the Ichimoku cloud after a long base. Buyers have control of the weekly again.
Momentum confirms. Weekly MACD has crossed above zero and is expanding, and stochastic is rising up through the middle of its range with room before overbought. Not a tired move.
The setup: a multi-year downtrend line test. Price is pressing into descending resistance off the 2023 highs, which lines up with the prior high around 24 to 25. That confluence is the line in the sand. A weekly close through it is a multi-year trendline break, and those tend to run.
Group tailwind. Digital payments/fintech is curling up as a group, not just one name. IPAY is leading its bucket and several payments names are basing or breaking out at the same time. RELY is one of the stronger charts in that cohort, already above its cloud while others are still under theirs.
Trigger and levels. Breakout and hold above 24 to 25 is the entry. Alternatively, buy pullbacks that hold above the cloud (~18 to 19). First target is the 27.5 zone (2023 highs), open above that.
Invalidation. Losing the cloud and closing back under ~18 kills the thesis. That is the higher-timeframe uptrend failing.
The honest caveat. Right at the line, reward to the first resistance is thin, so the clean trades are the confirmed breakout or the pullback to the cloud, not chasing into the trendline. Strong chart, let it give you the entry.
 Long
Long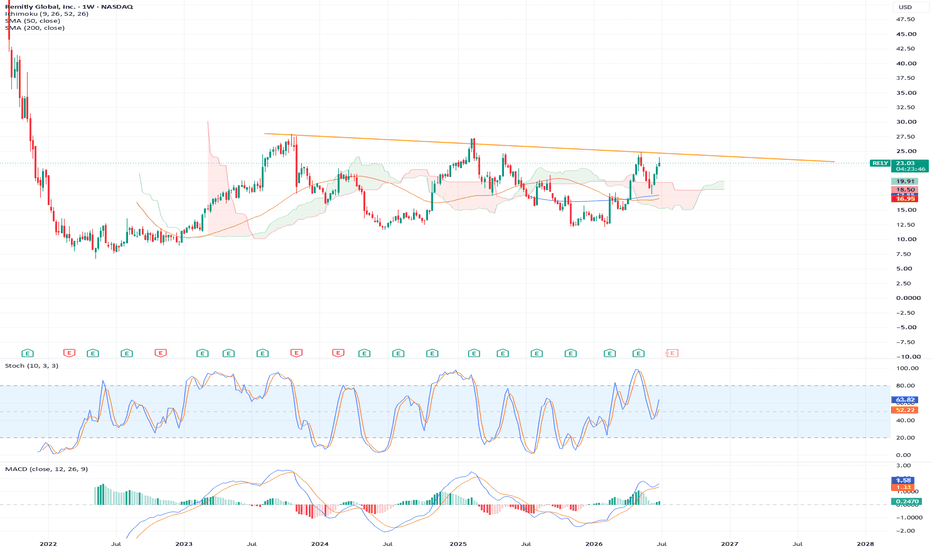
 Long
Long
60K Reclaimed, 62.5K Next?Hi everyone🌴☀️
Yesterday, at the opening of the U.S. trading session, I mentioned that: “the bulls need to reclaim the 60,000 level and push toward the upper boundary of the range at 62,500 before we can start talking about a more convincing consolidation and a potential uptrend.”
Fortunately for the bulls, this is exactly the scenario we're seeing on the chart. Bitcoin reclaimed 60,000, broke above 61,000 twice, successfully retested 60,000 as support, and is now taking a brief pause around 61,600, where the 4H EMA100 is currently located.
However, judging by the strong momentum established at the U.S. session open, Bitcoin is likely to challenge the 62,500 level in the very near future.
🛡️🛡️🛡️Nearest support levels:
60,800 – local horizontal support
60,000 – major horizontal support + 1H EMA100 and EMA200
🪓🪓🪓Nearest resistance:
62,500 – the strongest resistance level, around which price has struggled since the beginning of June. This is the level to watch very closely, as a successful breakout would open the door for a move toward 64,890 and potentially 67,600.
Also, don't forget about the Friday effect. Since tomorrow is a U.S. holiday for Independence Day, today effectively acts as Friday before a long weekend. Long-time readers know I've mentioned the "Friday effect" many times before—and it often has a meaningful impact on price action.
Peace 🌄  Long
Long
US 2-Year Yield: How to Read Fibonacci Extension After Reversal Market: TVC:US02Y US Government 2-Year Yield
Main lesson: Fibonacci extension is a projection tool, not a prediction tool.
Let’s dive into a chart that’s quietly telling a powerful story.
The US 2-year yield is giving us a textbook example of how traders can use the Fibonacci extension tool after a clean A-B-C structure forms. But this isn’t just about drawing lines and hoping for the best - it’s about understanding how trends evolve and where momentum might take us next.
Before we get into the fun stuff, one quick reminder; this chart shows yields, not bond prices. When yields rise, it usually reflects tighter rate expectations or stronger policy repricing. When they fall, it often signals easing expectations. Keep that in mind - it adds context to everything we’re about to explore.
What Is Fibonacci Extension?
Fibonacci tools can feel a bit mystical at first, but they’re actually pretty straightforward.
A retracement tells you how far price pulls back within a move, while the Fibonacci extension tool helps project where price might go next after a move and a correction.
Think of it like a three-step sequence:
A to B is the first push,
B to C is the pullback,
and from C onward, we project the next potential move.
The extension tool takes the size of that first push (A to B) and projects it forward from point C using Fibonacci ratios. It’s a simple concept, but when applied correctly, it becomes a powerful way to map potential future price zones.
Rules for Drawing Fibonacci Extension Correctly
To get meaningful levels, you need to draw the tool properly. While the process is straightforward, the quality of your inputs matters a lot.
First, you need to identify a clear trend shift or impulse. Point A should represent a meaningful swing low (in an uptrend) or swing high (in a downtrend), not just minor noise. From there, the move to point B should be a strong, directional impulse with visible momentum.
After that, you wait for a corrective pullback to form point C. Ideally, in an uptrend, this pullback holds above point A, confirming that the market structure is improving. Clean structure is key here - if price action is choppy or overlapping, extension levels tend to lose reliability.
Finally, it’s important to remember that Fibonacci works best when combined with other tools. Higher timeframes generally provide stronger signals, and confirmation from trend, momentum, and volatility indicators helps validate the levels.
The A-B-C Structure on This Chart
Here’s how the structure plays out on the chart.
Point A marks the four-month low near 3.376% in early March. This is where the previous decline in the 2-year yield stopped, and the market began to reverse higher.
From there, yields rallied sharply into Point B, around late March. This was the first strong upside impulse. The move was important because price broke away from the low, pushed above the 100-WMA, and showed that short-term rate expectations were being repriced higher.
After Point B, the market did not continue straight up. It corrected into Point C, near the 3.679% area in mid-April. This pullback is the key part of the structure. It held well above Point A, creating a higher low. That tells us sellers failed to return yields to the previous low, which is often an early sign that the market structure has shifted from decline to recovery.
Once yields bounced from Point C, the Fibonacci extension tool became useful. The tool takes the size of the first impulse from A to B and projects it upward from C. That gives traders a structured map of potential resistance levels.
The price action after Point C has respected this map well. Yields moved through the 38.2% and 50% zones, then held above the 61.8% extension near 4.088%, which is now acting as immediate support. The market is currently trading around 4.17%, just below the 78.6% extension near 4.199%, which is the next critical resistance.
How to Read the Extension Levels
Right now, the yield is hovering around 4.17%, sitting between two key Fibonacci levels:
• 61.8% extension at 4.088% (support)
• 78.6% extension at 4.199% (resistance)
This area acts as a decision zone. Holding above 4.088% keeps the recovery structure intact and suggests buyers are still in control. On the other hand, a break above 4.199% would signal stronger momentum and open the door for further upside.
The next major level above is the 100% extension near 4.341%, where the second move would match the size of the initial rally. Beyond that, the chart highlights additional resistance zones:
• January peak: 4.424%
• 127.2% extension: 4.521%
These levels help frame the potential path forward if momentum continues to build.
Why the 100% Level Matters
The 100% extension level represents symmetry in the market. It reflects a scenario where the move from point C matches the strength of the original A-to-B impulse.
In strong trends, price often reaches or exceeds this level. In weaker conditions, the move tends to stall earlier, typically around the 61.8% or 78.6% zones.
At the moment, the yield is approaching resistance but hasn’t fully broken through. That hesitation is important - it suggests the market is still deciding whether it has enough strength to continue higher.
Trend Context: The Recovery Is Still Constructive
Looking at the broader picture, the trend remains constructive, but it’s not accelerating aggressively.
The yield is holding above the 100-period weighted moving average, which indicates that the overall structure has improved since the March low. However, instead of trending sharply higher, price is beginning to move sideways near resistance.
This kind of behavior often reflects a pause - a period where the market consolidates before making its next directional move.
Bollinger Bands: Calm Before the Move?
The Bollinger Bands are tightening, signaling volatility compression. This typically means the market is entering a quieter phase, often followed by a larger move.
In general, narrow bands suggest low volatility and the potential for a breakout, while wider bands indicate that a trend is already in motion. Price positioning within the bands can also provide context, but it should always be interpreted alongside other tools.
In this case, the combination of compressed Bollinger Bands and nearby Fibonacci extension levels creates a clear setup. If the yield breaks above 4.199% and the bands begin to expand, it would support a move toward 4.341%. Conversely, rejection at resistance followed by a drop below 4.088% would weaken the structure.
PPO: Momentum Is Waiting
The PPO indicator is currently showing a lack of strong directional momentum. The lines are close together, and the histogram is hovering near zero, which is typical of a range-bound environment.
In general, the PPO helps identify shifts in momentum. Moves above the zero line suggest bullish conditions, while moves below indicate bearish pressure. Crossovers and changes in the histogram can signal strengthening or weakening momentum.
Right now, the key takeaway is that momentum hasn’t fully aligned with a breakout yet. For a stronger bullish signal, traders would typically look for a combination of factors:
• A clean close above resistance
• PPO turning higher
• Expanding histogram
• Bollinger Bands widening
• A successful retest of the breakout level
Until then, the structure remains constructive, but not fully confirmed.
Implied Volatility: Something’s Brewing
Implied volatility is starting to rise, which suggests the market may be preparing for a larger move.
Rising volatility often reflects expectations of increased price movement, while falling volatility points to stability or consolidation. When volatility increases near key support or resistance levels, it can signal that a breakout or rejection may be approaching.
In this case, the rise in implied volatility could be tied to upcoming macro catalysts such as inflation data, employment reports, or central bank communication. These factors can have a significant impact on short-term yield expectations.
Key Levels to Watch
The most important levels on the chart can be grouped into support and resistance zones.
Support levels:
• Immediate: 4.088%
• Secondary: 4.010%
• Deeper: 3.932%, 3.835%, 3.679%
Resistance levels:
• Critical: 4.199%
• Major extension target: 4.341%
• January peak: 4.424%
• Extended projection: 4.521%
At the moment, the key battleground lies between 4.088% and 4.199%. A breakout above this range could drive momentum toward 4.341%, while a breakdown below it may signal that the recovery is losing strength.
Educational Takeaway
The Fibonacci extension tool isn’t a crystal ball - it’s a roadmap. It highlights areas where price might react, not where it must go.
The real value comes from combining it with other elements of analysis, including trend structure, moving averages, momentum indicators, volatility signals, and, most importantly, price confirmation.
On this chart, the setup is clear. The structure is constructive, but the market is still in a decision phase. We’re sitting near a key inflection point, where the next move could define the direction of the trend.
Bottom line: Fibonacci gives you the map - but price action tells you when to move.
 Education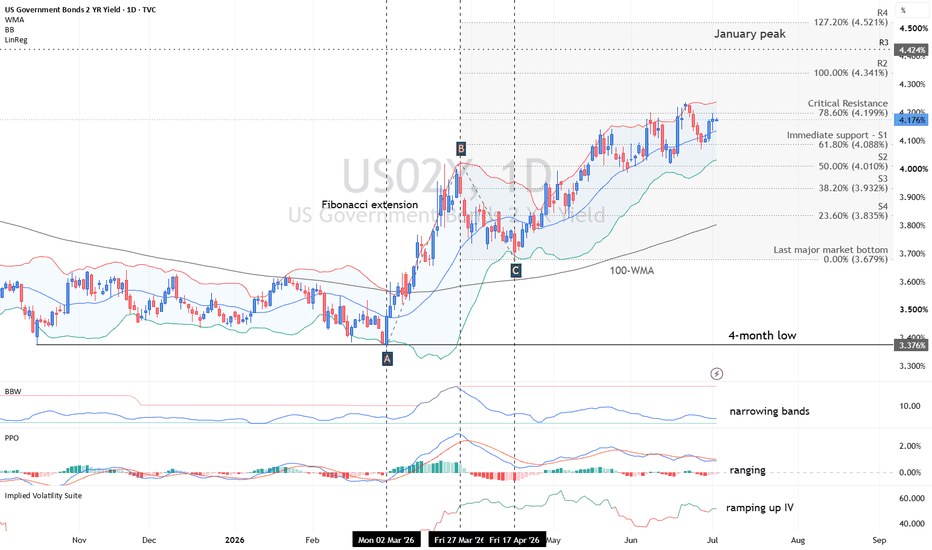
 Long
Long
 Long
Long
Copper:Tariff decision made. Exhaustion or buying opportunity?Copper arrives in July at an inflection point that has been building in the market over the past eighteen months. The US Commerce Department delivered its Section 232 recommendation on a tariff on refined copper to the White House on June 30, and the result is critical. If approved, a tariff of 15% in 2027 and 30% in 2028 will without a doubt cause another round of pre-tariff stockpiling in the second half of this year, and will result in higher prices on COMEX and LME outside the US. The reason for such a forecast is anything but speculation is the global copper market is expected to enter a deficit amounting to about 35,000 tons in 2026 because of the decline in mine production in Indonesia, Chile, DRC, and Zambia, in addition to the sustained end-use demand resulting from electrification, AI data centers, and grid modernis4ation. In just one year, copper has appreciated by more than 36%, and so far this year by 14%. The current price is addressing the question of whether the retracement from its all-time high at $6.72 per pound in May is exhaustion; or the best opportunity to buy it in the entire year.
The price gives convincing reasons to go with the latter. What the price behavior shows us is the strong correction from an extended high that has taken place with price finding its support exactly where it should have 31.8% pullback of the March to May move towards the $6.15 area, while it is consolidating in an area that has shown itself to be solid resistance turned to support. There is no breakdown in the EMA formation yet. The EMA 9 at $5.55 and EMA 20 at $5.66 continue rising and are way below the current price level, maintaining the bullish construction despite any short-term weakness. The MA Cross of the 9 and 21 EMAs comes out at $5.55 and $5.74 respectively. The most straightforward metric on our chart at this point is the RSI. Its value stands at 41.02 ;not quite oversold territory just yet, although getting close and it is trading under its own signal line at 43.87, indicating the presence of selling pressure that has begun to slow down rather than escalate. In the case of a structurally bullish commodity with a real shortage problem, the experience tells us that the patience of long-term investors kicks in when the RSI approaches such values, even before reaching oversold territory.
Trade recommendation
Direction : Long
Entry horizon : $6.10 – $6.25 (current consolidation band, former resistance now support)
Primary target : $6.49
Secondary target : $6.72
Stop loss : $5.76
Technical scenarios
Tariff confirmation breakout : White House confirmation of a phased 15% refined copper tariff for January 2027 triggers US stockpiling and tightens LME supply. Technical indicators turn positive as price clears $6.49 resistance. This targets the $6.72 all-time high, with Goldman Sachs' $14,000 LME forecast suggesting COMEX prices above $6.35, potentially reaching $7.00 by year-end.
Consolidation and patience : Vague or delayed tariff outcomes result in range-bound trading between $6.10 support and $6.49 resistance. Sideways RSI and compressed MACD reflect a market waiting for clarity. The entry zone remains valid for accumulation while awaiting the catalyst.
Tariff rejection unwind : Outright rejection removes the stockpiling premium, compressing the COMEX-LME spread. RSI dropping below 38 and a break of the $5.76 EMA 200 would target the $5.44 June low. Though unlikely, this high-velocity downside scenario requires a strict stop at $5.76.
 Long
Long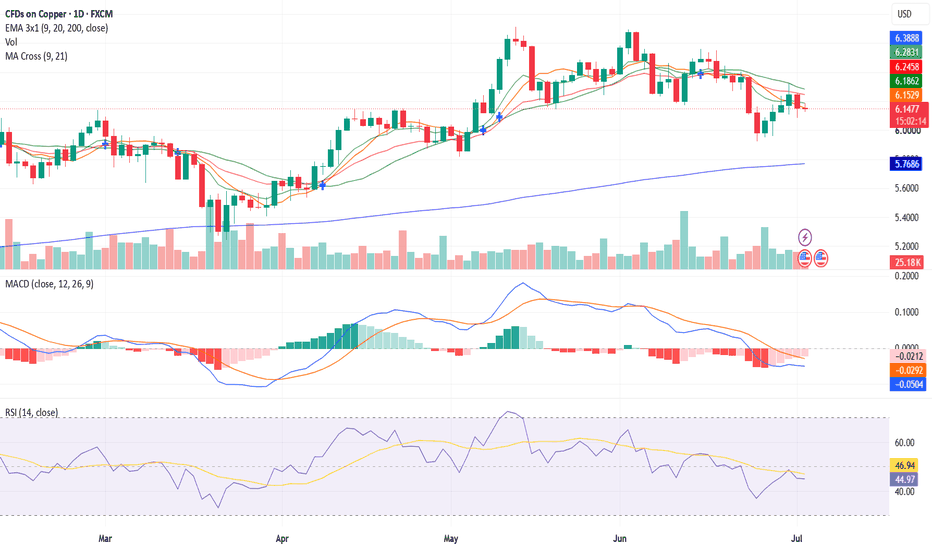
 Long
Long
Talen Energy (TLN) LONG — 1D ALMA Setup (WR 77%)█ SETUP
Talen Energy · NASDAQ:TLN · 1D · long only.
ALMA Averaging Strategy: ALMA 3 / σ2, SD band 2, min diff 1 bar to add / 1 bar to exit, 25% per bar, up to 4 adds, hard stop −10% from average entry.
Strategy Tester (TLN 1D):
Win rate 77% · profit factor 1.9 · max drawdown 17%
Avg winning trade +13.2% · avg losing trade −10.3%
Typical hold ~35 bars on winners · power / IPP mean-reversion sleeve
Live track record (same template, Jun 2026):
Two daily cycles closed +19.5% (22 Jun) and +20.0% (23 Jun) — not a new strategy name, same 1D ALMA rule.
═
█ WHY NOW
Fresh 1D entry ~ $399.48 on the daily bar close — independent power-generation beta (nuclear + data-center load theme), not a breakout chase. Mark since entry ~ $403.6 (+1% open MTM) — first bar green after fill.
Hard stop zone −10% from fill ~ $359.50 . Exits follow Pine ALMA flip + min diff or the hard stop — no discretionary TP ladder.
═
█ MACRO
Sector: TLN = independent power producer / nuclear-adjacent utility — trades on electricity spreads, capacity contracts, and AI data-center power demand, not broad Nasdaq beta alone.
Tape (30 Jun): US bell active — power names (GEV cluster) and defense refills mixed with REIT/staples exits. IPP longs can hold bid when investors reach for real-asset cash flows after a choppy macro week.
Calendar: Geopolitics and oil still dominate headline flow — power assets can outperform pure growth if risk appetite fades without a credit shock.
Execution is 1D ALMA mean-reversion, not an earnings or dividend forecast.
═
█ OUTLOOK
Positive factors
- 77% WR · PF 1.9 · avg win +13.2% vs avg loss −10.3% — positive payoff skew on a slow TF
- Proven Jun stack: last two 1D cycles on this strategy closed +19.5% / +20.0%
- Fresh 30 Jun 13:30Z daily entry inside publish window
- VWAP (29 Jun board): spot ~$402.4 tagged Support ~$402.7 (10 Jun swing-low anchor) — fair-value reaction zone into the refill
- SMC — bull FVG at fill: 4H In FVG Bull ~$399.48 · FVG Enter Bull on the entry bar — bid-side inefficiency tags the add zone
- Hard −10% stop caps nominal script risk per lot
Negative factors
- VWAP — reclaim + ceiling: fill ~$399.5 sits ~0.8% under the $402.7 support band · nearest active Resistance ~$419.05 (18 Jun) caps relief until support reclaims
- SMC — supply overhead: 1D In OB Bear (Breaker) on the same ~$399 bar · FVG New Bear ~$416.80 (25 Jun) still in the recent ladder — bounce runs into active bear structure above $405–416
- EMA — 4H time-overheated above: 4H Cur L:21 vs Avg L:12.4 · Dev −3.8% — above-EMA run ~1.7× average length ; long into a stretched sleeve, not a fresh discount
- EMA — stacked above, not pullback: 4H→1W all Above — no below-EMA mean-reversion map on the execution ladder
- 1D Cur L:11 vs Avg L:10.1 · Dev −5.1% — daily sleeve also time-overheated above the 1D EMA
- 1W Cur L:12 vs Avg L:47.0 · Dev −15.1% — price stretched above slow weekly EMA; HTF giveback risk if power beta fades
- Older 1D lot from 10 Jun ~$358.9 still open (+12% MTM) — correlated exposure on one ticker / one template
- Sister 4H template in book — faster stop / faster flip risk on the same underlying
- Power names can gap on regulatory or weather headlines — %-stop can slip on US cash open
- Past backtest ≠ live fills (spread, daily gap risk)
Takeaway: the proven 1D ALMA sleeve and Jun close stack support the refill, and bull FVG tags the add — but entry sits in an above-EMA time-stretch with bear OB/VWAP reclaim overhead, so this is a grind toward fair value, not a deep discount map; hard −10% caps script risk.
Base case: follow the 1D ALMA strategy · 4H/1D time-overheat digests without losing the band · grind toward prior June exit zone ($430–440) if power beta stays bid.
Bear case: above-EMA time stretch fails to hold (4H L:21 vs avg 12.4) · lose 4H/1D support on risk-off · weekly extension (−15% dev) mean-reverts · −10% toward ~$359.50 hard stop.
Educational idea. Live position — past backtest ≠ future results. NFA.  Long
Long
News Corp (NWS) LONG — 3D ALMA Setup (WR 70%)█ SETUP
News Corp · NASDAQ:NWS · 3d · long only.
ALMA Averaging Strategy: ALMA 3 / σ2, SD band 2, min diff 1 bar to add / 1 bar to exit, 25% per bar, up to 4 adds, hard stop −10% from average entry.
Strategy Tester (NWS 3d):
Win rate 70% · profit factor 1.7 · max drawdown 21%
Avg winning trade +13.9% · avg losing trade −8.5%
Typical hold ~18×3d bars · media / publishing mean-reversion sleeve
█ WHY NOW
Q3 US cash open — 3-day ALMA long fired on 1 Jul 13:30 UTC on the same bell as monthly APD / ISRG refills.
Fresh 3d entry ~ $28.06 — legacy media on a pullback, not a breakout chase. Mark since entry ~ $29.58 (+5.4% open MTM).
Hard stop zone −10% from fill ~ $25.25 . Exits follow Pine ALMA flip + min diff or the hard stop.
═
█ MACRO
Sector: NWS = print / digital media conglomerate — ad cycle, cable affiliate fees, Murdoch structure overhang.
Tape (1 Jul): Defensive media names can tag out on slow grids while mega-cap tech bleeds — same session CMCSA 4h exits hit +9.9% on a sister telecom template.
Execution is 3d ALMA mean-reversion, not an ad-revenue forecast.
═
█ OUTLOOK
Positive factors
- 70% WR · avg win +13.9% vs avg loss −8.5% — positive payoff skew
- ALMA — execution TF (3D): LONG · L:1 vs LAvg:4.2 — young above-session on the 3d chart (not time-overheated)
- ALMA — 4H: LONG · L:2 vs LAvg:3.7 — young 4h sleeve on the same board
- VWAP: spot ~ $29.34 above active Support ~$28.42 (22 Jun) and Resistance ~$28.98 (09 Jun) — same-bar reclaim of both swing VWAP ribbons
- SMC — 1D (entry bar ~$28.06): In OB Bull (Normal) · In FVG Bull · OB Enter Normal Bull + FVG Enter Bull — demand tags the 3d add zone
- EMA — LTF: 15m/1H/4H all Above · 4H Cur L:1 vs Avg L:10.2 · Dev −0.29% — young above-session at the line
Negative factors
- SMC — 4H at mark (~$29.37): In OB Bull (Breaker) but also In FVG Bear · FVG New Bear on the entry bar — micro supply printed on the same 4h candle
- EMA — slow TF mixed: 1D Below · Cur S:14 vs Avg S:6.2 (+0.09% dev) — daily below-EMA headwind · 1W Below with Cur S:4
- ALMA — 1W: LONG but only L:1 vs LAvg:4.5 — weekly sleeve young yet still inside a slow-grid recovery
- 3d bars are slow — +5% MTM is open risk, not a closed win
- Media headline sensitivity (regulation, ad slump narratives)
- Past backtest ≠ live fills
Takeaway: 3D/4H ALMA youth, VWAP reclaim, and daily bull OB/FVG support the refill, but the 4h bear FVG on the same print and daily below-EMA state cap the bounce — treat +5% MTM as open heat, not target reached.
Base case: follow the 3d ALMA strategy · hold $28.4–29.0 VWAP cluster · grind toward low-$30s if defensive beta stays bid.
Bear case: 4h bear FVG holds · lose 3d ALMA · daily below-EMA extends · −10% toward ~$25.25 hard stop.  Long
Long
Sabre Corporation (Revised) | SABR | Long at $1.76This is a revised analysis of Sabre Corp NASDAQ:SABR as seen here
-------
Full disclosure: I am still a holder of shares at $2.06 and newest entry at $1.76. My stop was triggered near $3.00 (original entry) a few days ago. If the price rises above $2.06, I plan to sell out of that entry a keep my lowest position moving forward.
This is a ***highly risky*** trade given the recent news around slower earnings growth and slump in travel demand in certain areas the company caters to. Do your own due diligence.
-------
NASDAQ:SABR stock took a major hit today after the company reported revenue growth below its projections in Q2 2025. Revenue was $687 million, down 1% year-on-year, missing the company's own guidance of "low single-digit" growth. They also significantly lowered full-year guidance for 2025, expecting Air Distribution Volumes to grow between 4-10% and full-year Adjusted EBITDA between $530-$570 million, down from previous projections. The company's higher exposure to corporate and government travel, including a decline in U.S. government and military travel, negatively impacted its performance.
From a technical analysis perspective, the price dropped today to an area 6 standard deviations away from the historical simple moving average zone (which rests now at $1.69 - blue line). While there may be a dead-cat bounce then further drop to near $1.00, the stock is behaving as expected given the bad news. However, a drop in interest rates will significantly benefit this company's debt burden. NASDAQ:SABR consistently ranks as one of the top players in the global travel technology landscape, so while I think the future is bright for the company given earnings projections (beyond 2025) and analyst estimates, 2025 will absolutely be a tough year.
So, at $1.76, I am buying the fear. Last entry near $1 if it gets there and the overall fundamentals do not change. Whatever my lowest entry is, I will be holding that and selling all previous entries near even to limit exposure.
Revised Targets into 2028:
$2.20 (+25.0%)
$2.90 (+64.8%)
 Long
Long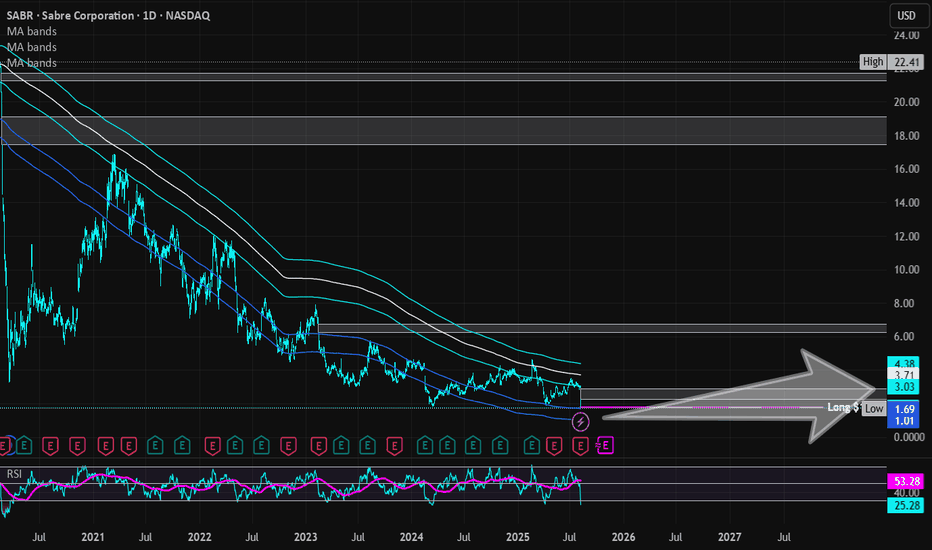
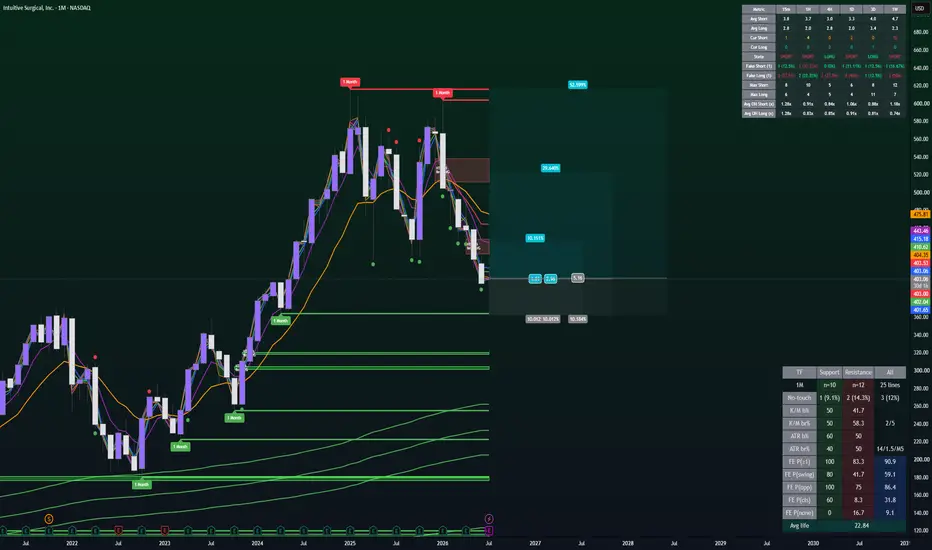
Intuitive Surgical (ISRG) LONG — 1MO ALMA Setup (WR 71%)█ SETUP
Intuitive Surgical · NASDAQ:ISRG · 1mo · long only.
ALMA Averaging Strategy: ALMA 3 / σ2, SD band 2, min diff 1 bar to add / 1 bar to exit, 25% per bar, up to 4 adds, hard stop −10% from average entry.
Strategy Tester (ISRG 1mo):
Win rate 71% · profit factor 18.5 · max drawdown 73% (monthly equity curve — wide but high PF)
Typical hold ~12×1mo bars · surgical robotics mean-reversion sleeve
█ WHY NOW
Q3 US cash open — monthly ALMA long fired on 1 Jul 13:30 UTC
Fresh 1mo entry ~ $397.68 — med-tech leader on a pullback into high-$390s, not a breakout chase. Mark since entry ~ $407.05 (+2.4% open MTM).
Hard stop zone −10% from fill ~ $357.90 . Exits follow Pine ALMA flip + min diff or the hard stop.
═
█ MACRO
Sector: ISRG = da Vinci ecosystem — procedure growth, capital equipment cycle, hospital budgets.
Tape (1 Jul): Healthcare can outperform pure Mag7 beta when investors rotate to quality cash flows after a choppy macro month.
Execution is 1mo ALMA mean-reversion, not a procedure-growth forecast.
═
█ OUTLOOK
Positive factors
- 71% WR · PF 18.5 on the 1mo tester — payoff skew favors winners despite wide historical DD
- ALMA — 3D (near execution): LONG · L:1 vs LAvg:3.7 — young above-session on the 3d chart (not time-overheated)
- ALMA — 4H: LONG · L:2 vs LAvg:3.4 — young 4h sleeve tags the refill bar
- EMA — discount map: 4H→1W all Below at entry · 1W Dev +17.8% with Cur S:23 vs Avg S:5.1 — stretched below-EMA on slow TFs = mean-reversion fuel for the monthly long
- VWAP: fill ~ $402.21 under nearest Resistance ~$408.48 (09 Jun anchor) — room to the swing-VWAP ceiling if bid returns
Negative factors
- ALMA — 1W headwind: SHORT · S:10 vs SAvg:3.5 — weekly ALMA time-overheated above-session on a SHORT signal · monthly long fights slow-TF band from above
- ALMA — 1D: SHORT · S:2 vs SAvg:4.0 — daily band still SHORT at entry
- SMC — 1D at fill (~$397.68): Not in FVG/OB zone — no fresh demand tag on the entry print · recent ladder = FVG Raid Bear steps from ~$402–406 (Jun)
- SMC — 1W: Not in FVG/OB on the 22 Jun weekly bar — no slow-TF demand pocket on the latest weekly structure
- VWAP overhead: active Resistance ~$429.72 / ~$464.81 above spot — ceiling ladder above $408
- Monthly DD in tester is wide (73%) — slow grid can draw down before mean-reversion
- Past backtest ≠ live fills
Takeaway: below-EMA stretch on 4H–1W and young 3D/4H ALMA support the monthly refill, but weekly ALMA SHORT overheating and absent SMC demand at the fill argue for a grind, not a V-recovery — respect the −10% hard stop.
Base case: follow the 1mo ALMA strategy · 3D/4H young LONG holds · slow reclaim toward $408–430 VWAP/ALMA zone.
Bear case: 1W SHORT ALMA extends · lose 3D band · −10% toward ~$358 hard stop.  Long
Long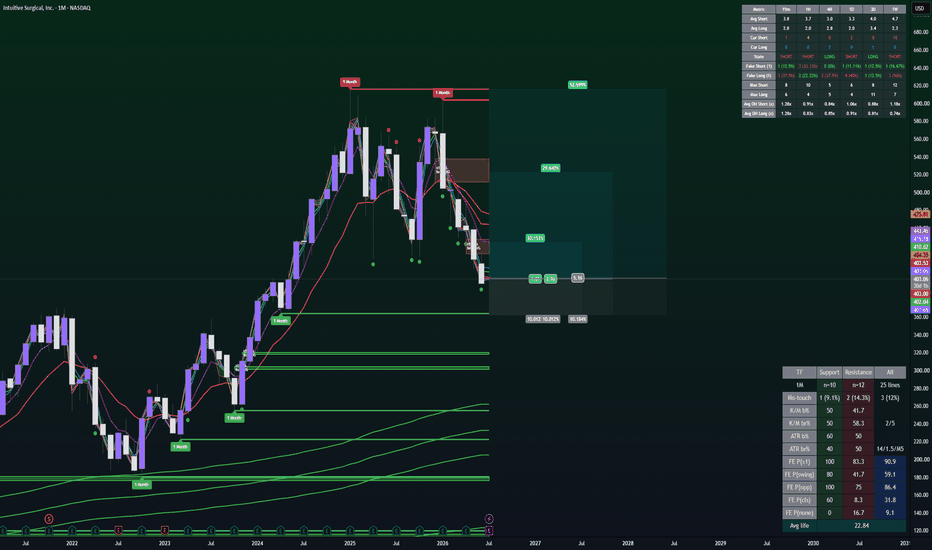
Air Products (APD) LONG — 1MO VWAP Setup (WR 82%)█ SETUP
Air Products · BATS:APD · 1mo · long only.
VWAP Swing Strategy: swing pivot 5 · 2 consecutive bars · min VWAP age 0 entry / 6 exit on chart. One full position per signal — no scale-in or averaging ladder. No hard % stop — long entry on Touch VWAP Low, exit on Touch VWAP High (active Resistance) when min-age met.
Strategy Tester (APD 1mo):
Win rate 82% · profit factor 9.0 · max drawdown 16%
Avg winning trade +21.7% · avg losing trade −8.5%
Typical hold ~10×1mo bars · industrial gas / chemicals VWAP swing sleeve
█ WHY NOW
Q3 US cash open — monthly VWAP long fired on 1 Jul 13:30 UTC .
Fresh 1mo VWAP Swing entry ~ $293.18 — single full leg, not a scale-in refill. Specialty chemicals on a pullback, not a breakout chase. Mark since entry ~ $302.4 (+3.1% open MTM) — first session green after fill.
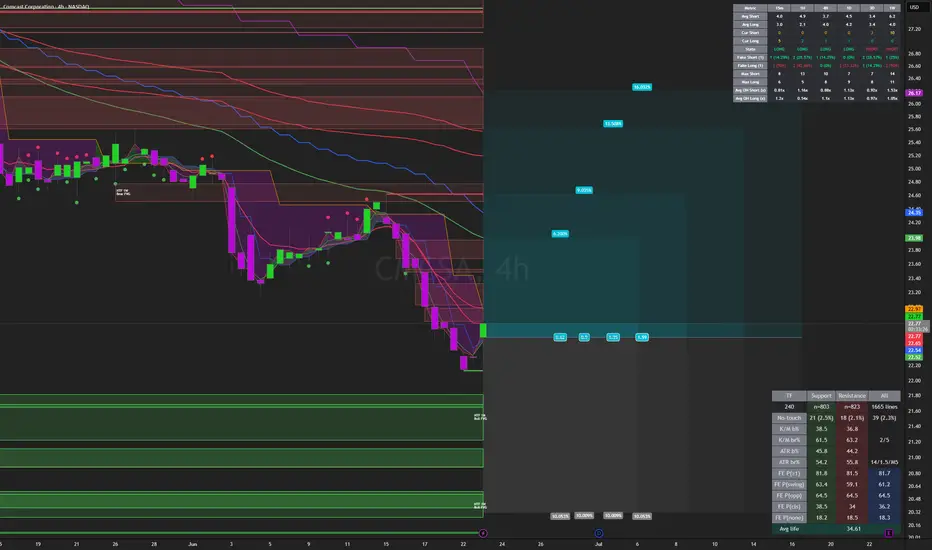
═
█ SETUP
Air Products · BATS:APD · 1mo · long only.
VWAP Swing Strategy: swing pivot 5 · 2 consecutive bars · min VWAP age 0 entry / 6 exit on chart. One full position per signal — no scale-in or averaging ladder. No hard % stop — long entry on Touch VWAP Low, exit on Touch VWAP High (active Resistance) when min-age met.
Strategy Tester (APD 1mo):
Win rate 82% · profit factor 9.0 · max drawdown 16%
Avg winning trade +21.7% · avg losing trade −8.5%
Typical hold ~10×1mo bars · industrial gas / chemicals VWAP swing sleeve
═
█ WHY NOW
Q3 US cash open — monthly VWAP long fired on 1 Jul 13:30 UTC on the same bell as ISRG / NWS refills elsewhere in the US sleeve.
Fresh 1mo VWAP Swing entry ~ $293.18 — single full leg, not a scale-in refill. Specialty chemicals on a pullback, not a breakout chase. Mark since entry ~ $302.4 (+3.1% open MTM) — first session green after fill.
No fixed −10% stop on this VWAP sleeve. Exit when price tags the next active swing-VWAP Resistance on the 1mo chart (Touch VWAP High) — min-age and band rules stay on-script, not a discretionary TP ladder.
═
█ MACRO
Sector: APD = industrial gases and hydrogen infrastructure — capex cycle, energy spreads, and project backlog drive the equity.
Tape (1 Jul): US bell added monthly industrials while Mag7 headlines stay soft — real-asset / process names can hold bid when investors reach for non-tech beta.
Execution is 1mo VWAP Swing (touch-in / touch-out), not an earnings forecast.
═
█ OUTLOOK
Positive factors
- 82% WR · PF 9.0 · avg win +21.7% vs avg loss −8.5% — strong tester skew on a slow TF
- Fresh 1 Jul 13:30Z entry on the US cash open
- EMA — execution ladder: 4H Cur L:3 vs Avg L:12.5 · Dev −7.2% — young above-session on the 4h chart (not time-overheated) · 1D Cur L:2 vs Avg L:8.3 — young daily sleeve at the fill
- EMA — stacked Above: 4H→1W all Above at entry — pullback long with slow-TF trend still up
- VWAP levels: spot had tagged Support ~$275.73 (Dec-25 swing anchor) · fill ~ $293 now above prior Resistance ~$284.34 (May-26) — reclaimed May ceiling; next script exit is the next overhead Resistance ribbon
- SMC — 1W: In FVG Bull on the 22 Jun weekly bar (~$277.79) — slow-TF demand pocket still relevant to the monthly sleeve
- SMC — 1D events at fill: MS CHoCH + Trend Up on the entry bar — structure flip tags the monthly entry despite sitting inside OB Bear (Normal)
- Exit rail = next overhead swing-VWAP Resistance touch — no parallel −10% kill-switch on this sleeve
Negative factors
- SMC — 1D status: In OB Bear (Normal) at ~$293 · OB Enter Normal Bear on the same bar — long into active bear OB on the daily chart
- Monthly bars move slowly — underwater marks common before VWAP exit fires
- Past backtest ≠ live fills (spread, US cash gap risk)
Takeaway: tester stats and EMA/VWAP reclaim above the May ceiling support the monthly VWAP entry, but the daily bear OB a bounce against nearby supply — not a clean breakout map; the script exit stays the next Resistance touch, not a fixed % stop.
Base case: follow the 1mo VWAP strategy · 4H young LONG holds · work toward the next overhead swing-VWAP Resistance ribbon on chart if industrials stay bid.
Bear case: fail to tag the next Resistance VWAP · lose 4H VWAP band on risk-off · daily bear OB extends · reclaim risk toward Dec support ~$276 if the monthly sleeve gives back the May ceiling.
Educational idea. Live position — past backtest ≠ future results. NFA.  Long
Long
 Long
Long
 Long
Long
 Long
Long
 Long
Long