Short
Short
 Long
Long
XAUUSD 15M: Supply Rejection & Short Continuation MappingOn the 15-minute timeframe, Gold (XAUUSD) has rejected the upper descending trendline and major overhead resistance area around the $4,330–$4,340 region. Following this rejection, price pulled back to retest a minor supply/flip zone near $4,314.81, setting up a potential short continuation scenario toward lower support areas.
Technical Reference Levels
Overhead Supply / Rejection Zone: ~$4,314.81 (Local Rejection Level / Resistance Block)
Invalidation / Structural Level: ~$4,324.86 (Above the immediate swing high)
Downside Target Level: ~$4,244.00 (Key lower demand block / target area)
Technical Setup Logic
Following a clean rejection at the higher descending trendline, price retraced into the resistance level at $4,314.81. The technical analysis maps out a potential short continuation out of this supply area, targeting the lower liquidity and demand zone near $4,244.00, with structural invalidation strictly placed above $4,324.86.
Disclaimer & Purpose
This post is strictly for educational, analytical, and charting practice purposes only. It is not a financial idea, trading signal, or investment advice. Always manage your own risk and perform independent research.  Short
Short
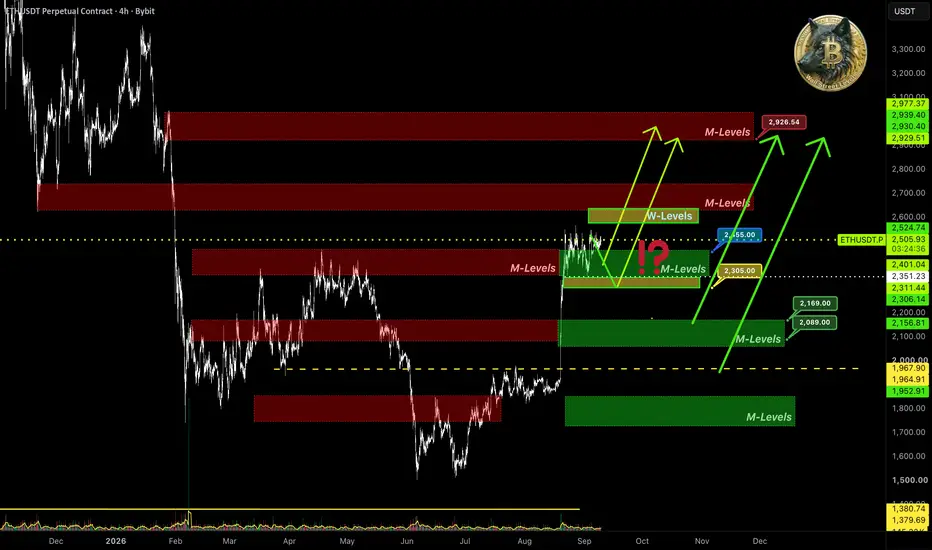
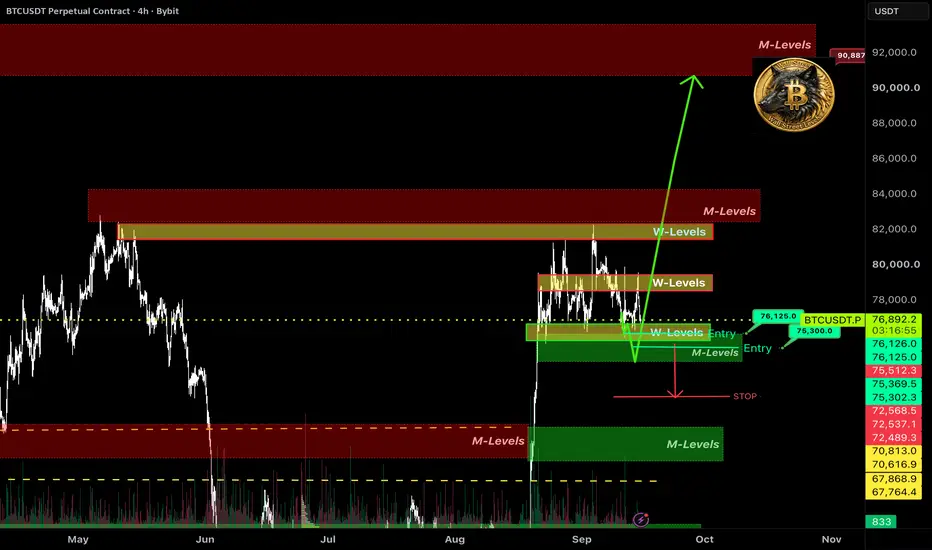
$ETH: Market Thoughts BYBIT:ETHUSDT.P
As seen on the chart, price has been trading at the monthly support 📊M-Levels $2368–$2442 for 2 weeks now, making no strong moves to break the level. But there's no real bounce with position building either. Just the flat market everyone hates.
🧩IMA data shows: the largest players have turned and are closing their long bets. Mid-sized players in the top 20 by position size are neutral — sitting on their hands and doing nothing. The previous institutional buying frenzy is gone. And the crowd, as always in these situations, jumped in at the highs and is waiting for the market to keep going up.
You could say capital is leaving the market, real buyers are scarce.
But during the US session, it's the opposite. While the broader market was selling and pulling money out, 🐋large players were buying a bit of the asset on this dip. It's not enough to move the market yet. We should watch the actions of institutions from US funds: if the buying continues, structurally we are already in a phase of stealth long accumulation.
The picture is mixed. The weekly bullish bias is weakening fast, but institutions are buying the dip during the US session.
What's the conclusion? Buyers are holding the lower boundary for now. But since 🐋large players are exiting positions quickly and the market overall is selling, there's downside risk. But calling a bearish flip is premature.
Trying to buy on the support test right now comes with the risk of a market flush.
For a real rally, we need to see large players' interest return to the spot market. Right now, speculators dominate, and we might just see price chop inside the weekly consolidation range 📊W-Levels $2440–$2560.
⚠️If the idea was useful — glad to have your support 🚀.
Analysis based on 🧩IMA (Integrated Market Analysis)
📊M-Levels — Institutional Interest Level (IIL)  Long
Long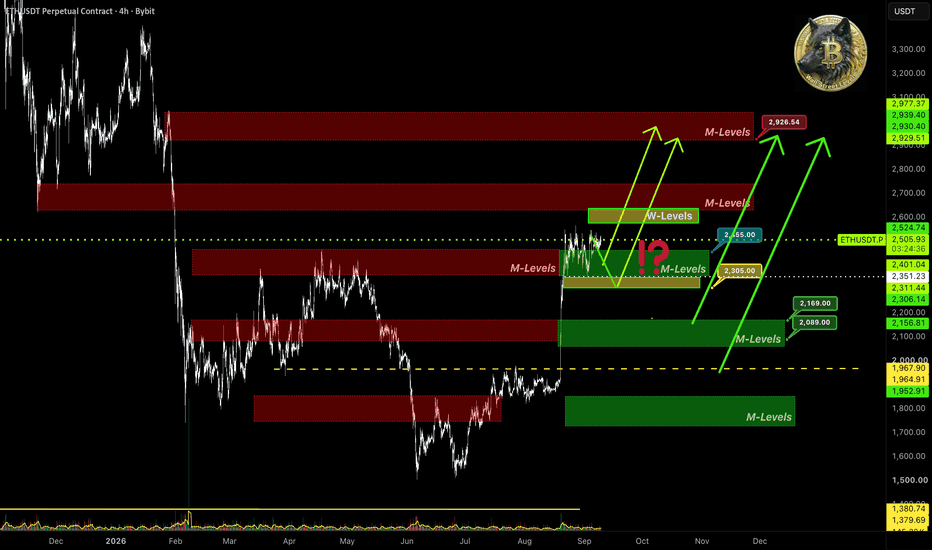
XAUUSD: A Bounce Before Another Drop? $4,214 and $4,110 in FocusMarket Overview — Bearish Structure, but Entry Timing Matters
Gold is attempting to recover after another sell-off, but the four-hour chart still favours sellers. The opportunity outlined here is a potential rebound into resistance followed by renewed weakness—not an automatic sell at the current price.
Market Structure — The August Rally Has Lost Its Momentum
The strong August advance reached roughly $4,680–$4,700 before the structure began changing. The marked CHoCH, or “change of character,” highlighted the first warning that buyers were losing control. Subsequent BOS labels—“breaks of structure”—show price moving through earlier swing lows. September’s recovery then stalled near $4,510, followed by weaker rebounds around $4,430–$4,450 and $4,400. Those progressively lower highs are the main reason to favour selling opportunities on a rebound.
Immediate Support — The Reaction Around $4,280–$4,290 Matters
The price has traded below the previous floor around $4,280–$4,290 and rebounded above it. This is a key observation: a move below support does not necessarily indicate a lasting breakdown. From a technical analysis perspective, this could be a sell-side liquidity sweep—a brief movement through previous lows followed by recovery. A completed four-hour close below this area, followed by a failed reclaim, would strengthen the bearish continuation case. Holding above it would leave room for a deeper rebound first .
First Entry Area – Aggressive Retest Around $4,310–$4,340
The smaller shaded zone represents the shallower pullback scenario. If gold rebounds into this area and struggles to move higher, it could provide an early opportunity to follow the bearish trend. However, this is the more aggressive setup as price could recover through it and continue towards the larger supply zone. A touch of the rectangle alone is insufficient; evidence that the rebound has stalled is required.
Second Entry Area – Stronger Structural Resistance Around $4,360–$4,400
The higher shaded zone is located around the latest breakdown area and close to descending trendline resistance. This combination confers greater structural significance than the shallower entry area. A recovery into this region, followed by rejection, would align with the second projected route on the chart. Gold does not need to reach this zone before falling; these are alternative setups to evaluate rather than instructions to continue adding to a losing short position.
Entry Confirmation – Allow the Rebound to Demonstrate Weakness
The entry should be confirmed by observing the rebound’s weakness.
For either zone, a practical confirmation sequence would be a rejection, a decisive close below the rebound’s most recent minor swing low and a retest that fails to recover that broken level. Traders could assess this on a 15-minute or one-hour chart while keeping the four-hour direction in view. Those lower-timeframe triggers are conditions to watch for, not signals already confirmed by this screenshot. If price moves cleanly through a zone and holds above it, that particular rejection setup has not developed.
Downside Targets — Clear the Recent Lows Before Looking Further
The recent low area around $4,250–$4,270 is the first obstacle for another decline. Below that, the chart marks $4,213.58 as the first target and $4,110.40 as the final target. The first objective is a sensible place to reassess momentum and consider reducing exposure. The deeper target becomes more relevant if selling continues through the first level and recovery attempts remain weak. A strong bullish reaction at the first target would be a reason to protect gains rather than assume the entire projected move will unfold.
Volume Profile — Useful Context, Not Proof of Future Selling
The right-hand profile shows substantial historical activity around the overhead $4,350–$4,400 region and another broad concentration lower down around $4,050–$4,125. My interpretation is that these areas deserve attention if price returns to them, as previous trading activity may produce hesitation or consolidation. However, the profile records past activity; it does not reveal future orders or prove that institutions are selling. TradingView also distinguishes its up/down volume calculations from actual buy/sell order flow.
Invalidation — What Would Make Me Reconsider the Bearish Setup?
A convincing four-hour close above $4,400, followed by a successful retest as support, would invalidate the immediate rejection setup from the upper shaded zone. This would open the possibility of a recovery towards $4,430–$4,450 and then $4,480–$4,510. Sustained trading above the September swing high near $4,510 would challenge the broader bearish structure more substantially. An individual trade’s stop should remain separate from these wider outlook levels.
Risk Management — Build the Position Around the Stop
Define the rejection high and protective stop before deciding position size. Judge the potential reward against the distance to the first target rather than relying on the final target to make the trade appear attractive. If using multiple entries, keep the combined exposure within one planned risk budget. Allow for spreads, slippage and US news-related volatility and do not wait for a four-hour candle to close after a protective stop has been reached.
LIKE AND COMMENT FOR MORE SUCH TRADING SETUPS
THE SETUPSFX_ TEAM
Short 
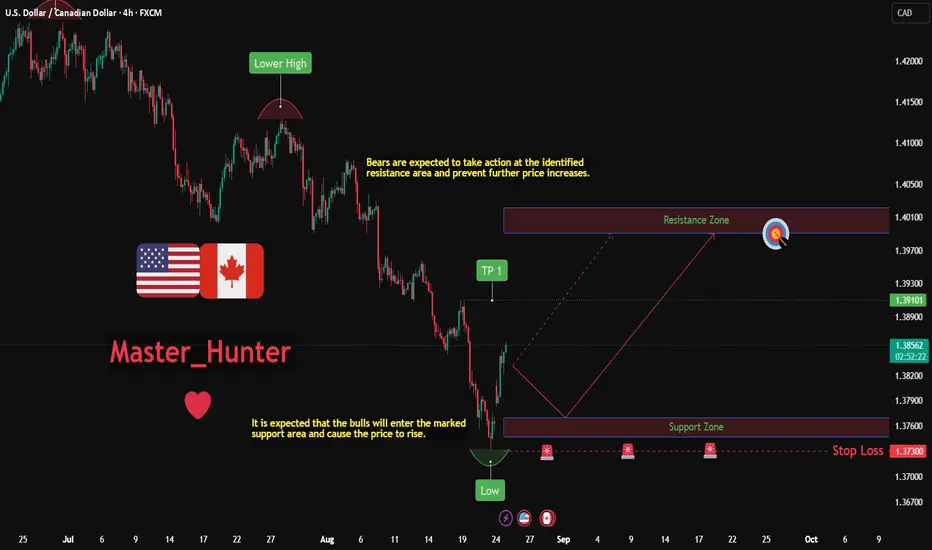
USDCAD: Bullish Push to 1.399?FX:USDCAD is eyeing a bullish reversal on the 4-hour chart , with price testing a key support zone after recent lows, converging with a potential entry area that could ignite further upside momentum toward the higher resistance zone if buyers defend amid volatility. This setup suggests a solid rally opportunity with more than 1:5.5 risk-reward .🔥
Entry between 1.375–1.377 (entry from current price with proper risk management is recommended). Target at 1.399 . Set a stop loss at a daily close below 1.373 , yielding a risk-reward ratio of more than 1:5.5 . Monitor for confirmation via a bullish candle close above entry with rising volume, leveraging the pair’s strength near support.🌟
Fundamentally , USDCAD is trading around 1.386 in late August 2026.
For the US Dollar, the most important release this week (24–28 August) is the US Core PCE Price Index (July) on Wednesday, August 26 — the Fed’s preferred inflation gauge that can significantly influence dollar strength.
For the Canadian Dollar, a key event is the Canada GDP data (June / Q2) on Friday, August 28, which will provide critical insight into the health of the Canadian economy. 💡
📝 Trade Setup
🎯 Entry (Long):
1.375 – 1.377
(Entry from current price is acceptable with proper position sizing and strict risk management.)
🎯 Target:
1.399
❌ Stop Loss:
Daily candle close below 1.373
📈 Risk-to-Reward:
More than 1:5.5
💡 Will buyers defend 1.375–1.377 and drive USDCAD toward 1.399, or will sellers break support and invalidate the bullish setup? 👇
EURUSD: Bullish Push to 1.1700?FX:EURUSD is eyeing a bullish continuation on the 4-hour chart within the short-term uptrend, with price approaching a key support zone near the uptrend line after recent consolidation, converging with a potential entry area that could ignite further upside momentum toward the higher resistance zone if buyers defend amid volatility. This setup suggests a solid rally opportunity with close to 1:6 risk-reward .🔥
Entry between 1.1575–1.1585 (entry from current price with proper risk management is recommended). Target at 1.1700 . Set a s top loss at a daily close below 1.1566 , yielding a risk-reward ratio of close to 1:6 . Monitor for confirmation via a bullish candle close above entry with rising volume.🌟
Fundamentally , EURUSD is trading around 1.163 in early September 2026.
For the Euro, the most important event this week (7–11 September) is the ECB Interest Rate Decision on Thursday, September 10, which will set the tone for eurozone monetary policy.
For the US Dollar, the key release is the US Consumer Price Index (CPI) for August on Friday, September 11 — a major inflation report that can strongly influence Fed expectations and dollar strength. 💡
📝 Trade Setup
🎯 Entry (Short):
1.1575 - 1.1585
(Entry from current price is acceptable with proper position sizing and strict risk management.)
🎯 Target:
1.1700
❌ Stop Loss:
Daily close above 1.1566
📈 Risk-to-Reward:
Close to 1:6
Will buyers defend 1.1575-1.1585 and push EURUSDtoward 1.1700, or will the support fail and invalidate the bullish setup? 👇  Long
Long
Best Indicator for Support & Resistance Analysis in Gold XAUUSD
I will show you the best and free indicator that will help you do support and resistance analysis on Gold on any time frame.
If you are a beginner in Gold XAUUSD trading, this technical indicator will help you a lot in market structure analysis, whether you are using TradingView, MT4/MT5.
We will use a classic, default technical indicator that is available in any trading terminal.
It is called Zig-Zag.
To add it to your chart on TradingView, simply search for it in the indicators window.
This indicator maps significant historical highs and lows, which are the ultimate base for supports and resistances.
However, with the default settings of the indicator, it is less sensitive and may miss significant highs and lows, especially if you analyse lower time frames.
To set the indicator up properly, find the s mallest recognizable price action leg on a price chart and measure its length in % percentage.
In our example, there is one important impulse leg that the indicator misses.
This movement has 4.04% length.
Open the settings of the indicator and find "Price deviation for reversals (%)" in inputs.
Input 4.04 number to make the indicator more sensitive.
Now, the indicator starts recognizing this movement.
The highs and lows that the indicator maps are key levels.
Mark them with horizontal lines.
After that, draw support and resistance zones based on these key levels.
Just pick the candle that comprises a key level.
Among its closing and opening levels, choose the closest one to a key level and draw the zones.
And the final step is to remove past supports and resistances that Gold XAUUSD price stopped respecting.
That's how a complete analysis looks.
And you can use ZigZag indicator for support and resistance analysis on Gold on any time frame for scalping or day trading; you just need to change the settings.
If you just started Gold trading, support and resistance analysis may appear complicated to you.
This method will help you never miss important supports and resistance when trading Gold XAUUSD.
❤️Please, support my work with like, thank you!❤️
I am part of Trade Nation's Influencer program and receive a monthly fee for using their TradingView charts in my analysis.
Education 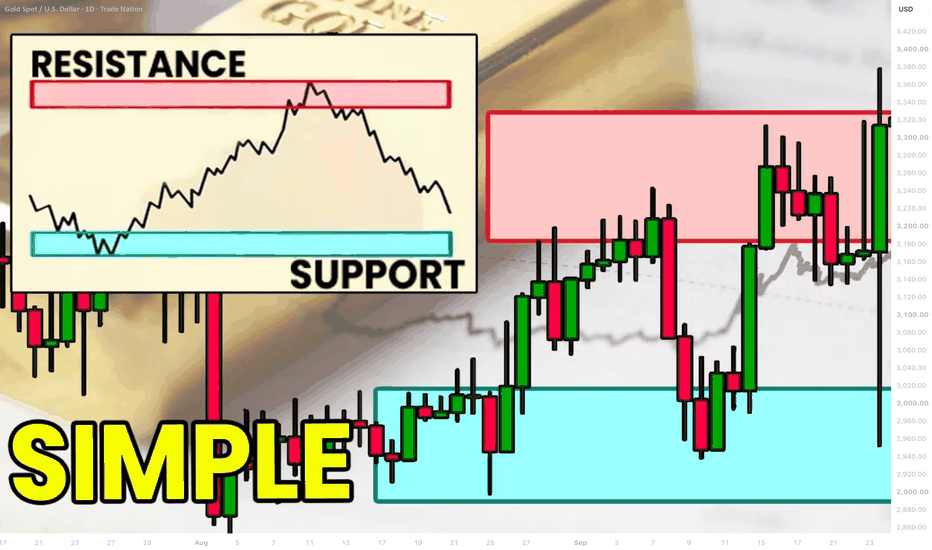
 Long
Long
ETHUSDT Analyses-38, September 16, 2026Welcome to my page! I share daily technical analyses of crypto and other charts here.
BINANCE:ETHUSDT
💡Market Analysis:
ETH remains under short-term bearish pressure, but price is now reacting from the 2373 support zone and trying to stabilize above the 2400 area. The current setup is a potential long scenario only if price confirms the reclaim of the trigger zone around 2406 with a strong bullish candle body above 80%, or breaks out and then holds the level on a clean pullback.
If that confirmation appears, the first upside objective is the 2501 resistance. After that, the next important levels are 2570 and 2630. On the other hand, if price loses the 2380-2373 support area, the long setup becomes weak and invalidation is triggered.
As with my previous signals, I treat the marked solid and dashed levels as trigger zones, not automatic entries. Confirmation always comes first, then execution with controlled risk.
Key Support & Resistance:
Key Resistance: 2501 / 2570 / 2630
Key Support Area: 2400 / 2380-2373
🎯 Trade Entry & Exit Plan:
Entry : Breakout/Pullback of trendline or key zones with >80% candle body confirmation around 2406.
Stop Loss : Below the last support wave and the marked invalidation area, around 2380.
Take Profit : First target 2501. Further targets 2570 and 2630. Secure profits from R:R 2 and above.
⚠️Risk Management:
Maximum 1% risk per trade.
❤️Follow me for more: @EhsanZeydabadi Long 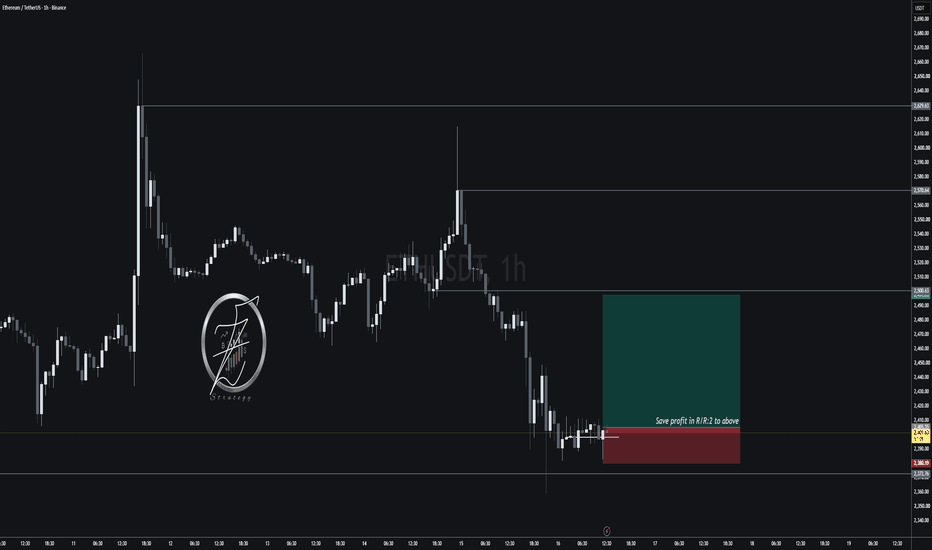
Short 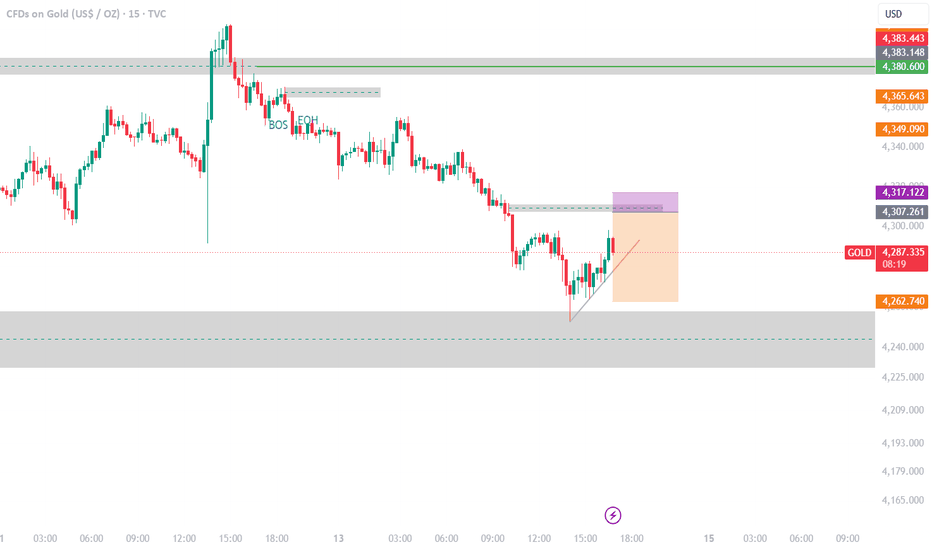
BTCUSDT 15M: Supply Zone Mitigation & Short ContinuationOn the 15-minute timeframe, Bitcoin (BTCUSDT) has experienced a breakdown from earlier highs and is consolidating beneath an overhead supply zone. Price has retraced into the $75,976 – $76,334 resistance block following a lower-high structure, setting up a potential bearish rejection scenario.
Technical Reference Levels
Overhead Supply / Entry Zone: ~$75,976.30 – $76,334.07 (Supply Zone / Resistance Block)
Invalidation / Structural Level: ~$76,334.07 (Above the local supply zone high)
Downside Target Level: ~$74,494.20 (Major lower support / liquidity target)
Technical Setup Logic
Price is currently testing the lower boundary of the supply zone near $75,976 after making a corrective pullback. The technical mapping anticipates a potential rejection from this resistance area to resume the broader lower-timeframe downtrend toward the lower target at $74,494.20, with structural invalidation defined above $76,334.07.
Disclaimer & Purpose
This post is strictly for educational, analytical, and charting practice purposes only. It is not a financial idea, trading signal, or investment advice. Always manage your own risk and perform independent research.  Short
Short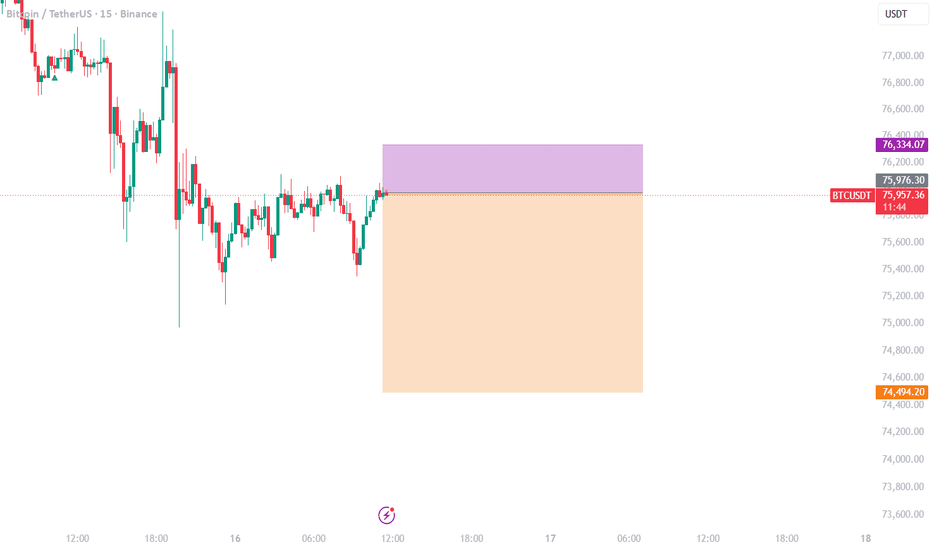
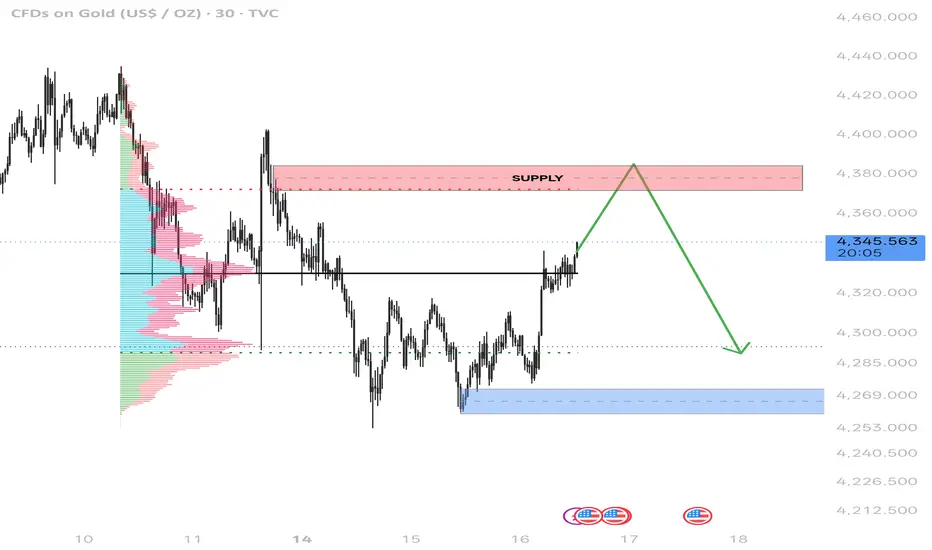
Bearish reversal at the VAHGold is currently reclaiming the 4,330–4,340 area, but the main resistance remains the 4,370–4,385 supply zone. My scenario is for price to continue higher into that supply, where I’ll watch for rejection/absorption and failed acceptance above value.
If sellers defend the zone, the downside target is the 4,290 area, with the deeper demand around 4,258–4,270. A clean acceptance above 4,385 would invalidate this bearish-reversion scenario  Short
Short
XAUUSD 15M: Wait for Bullish Break of Structure (BOS) ConfirmatiOn the 15-minute timeframe, Gold (XAUUSD) is holding along an ascending trendline following a sharp recovery from the lower $4,270 support region. Price has pulled back toward the trendline and immediate support, setting up a potential bullish continuation scenario once structural confirmation is achieved.
Technical Reference Levels
Projected BOS Confirmation Level: ~$4,296.85 (Awaiting Break of Structure Level)
Invalidation / Structural Level: ~$4,291.47 (Below the local swing low and trendline support)
Upside Target Level: ~$4,348.91 (Key overhead supply area / liquidity target)
Technical Setup Logic
The technical plan emphasizes patience: waiting for price to break and close above the local resistance high at $4,296.85 to confirm a bullish Break of Structure (BOS). Following a valid BOS, the scenario targets the higher resistance block near $4,348.91, with structural invalidation strictly placed below $4,291.47.
Disclaimer & Purpose
This post is strictly for educational, analytical, and charting practice purposes only. It is not a financial idea, trading signal, or investment advice. Always manage your own risk and perform independent research. Long 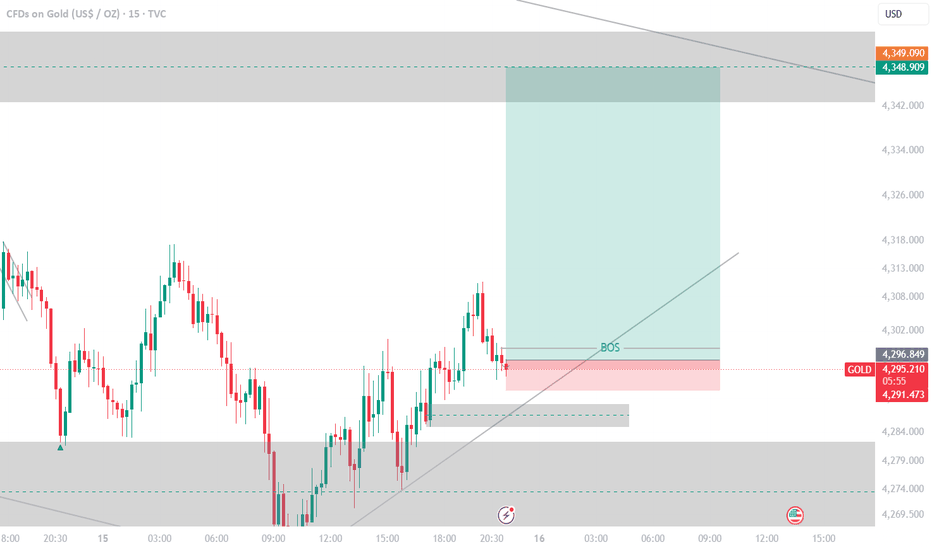
Long