High Oil Prices = Plenty of Breakout SetupsWith oil prices staying elevated, and likely to remain high in the foreseeable future, the energy sector is full with great setups, here are few:
NYSE:SM
Broke above the breakout confirmation level yesterday, and we’re still very early in the move. There’s roughly 10% upside to Target 1 and more than 25% to Target 2, so there’s still plenty of room for the move to develop.
NYSE:FTI
Same as the previous stock, this one has already broken above the breakout level, but there’s still plenty of meat left on the bone.
NASDAQ:FANG
The price has been consolidating within a triangle since the beginning of May, with the breakout level at $210.55.
We can also see that the 50-day and 200-day moving averages have formed a “golden cross,” with the 50 MA crossing above the 200 MA, adding another bullish signal to the setup.
The RSI has also been consolidating within a triangle of its own, making it a useful indicator to gauge the strength of the eventual breakout. If the RSI breaks out alongside the price, it would be a good confirmation for a strong breakout.
NYSE:OKE
This one is a bit messier than the other three and harder to analyze with precision. The breakout point is pretty clear at $95.88, but the triangle structure makes it harder to accurately project the targets. So, I went with more traditional and conservative targets here. There’s potentially much more upside than the targets I’ve marked, but it’s always better to be safe than sorry.
GOLD - The Hunt for Liquidity Ahead of the Distribution ICMARKETS:XAUUSD maintains its local bullish trend and is entering a consolidation phase, within which a clear trigger is forming. A breakout of this trigger could strengthen the continuation of the upward move
The Dollar Index remains stagnant and is testing support within a downward impulse. Further dollar weakness could become a technical driver for gold upside. The key area to watch is 4,390–4,370.
The correction in gold appears temporary. The fundamental backdrop — including a weaker dollar and expectations of lower Fed rates — continues to support the metal. Key events this week include the FOMC minutes on Wednesday, as well as U.S. housing and industrial production data.
Technically, dip-buying remains the more likely scenario.
Drivers:
Downside: higher oil prices and yields, stronger dollar, geopolitical uncertainty.
Upside: weaker dollar, lower rate expectations, dip-buying
Resistance levels: 4,435, 4,450, 4,500
Support levels: 4,388, 4,371, 4,313
Gold maintains its local bullish trend. The market is confirming resistance at 4,435, but is forming a correction ahead of a potential breakout, with a possible liquidity hunt as the objective.
A bounce from the 4,370–4,388 zone could trigger a breakout above 4,435 and open the way for further upside toward 4,480–4,500
Best regards,
R. Linda  Long
Long
AMBP – Bonus Watchlist | Breakout Structure Quietly DevelopingHello Everyone, Followers,
For this week's bonus chart, I'm looking at Ardagh Metal Packaging (AMBP).
While most market participants are focused on large-cap names, AMBP has quietly built an interesting technical structure, compressing between rising support and long-term descending resistance.
The stock is now approaching a potential breakout point, making next week's price action worth watching.
📊 Technical Overview
The chart currently shows:
• Ascending triangle formation developing
• Rising trendline continues to hold
• Multiple tests of resistance around $4.15
• Compression phase nearing completion
• Buyers gradually absorbing selling pressure
• Momentum slowly improving
The longer a stock consolidates under resistance, the more explosive the breakout can become.
🔹 Key Levels
🎯 Resistance
4.15 - 4.20 → Immediate breakout trigger
4.40 → Fibonacci 0.382
4.60 → Fibonacci 0.50
4.80 → Fibonacci 0.618
🟢 Support
4.00 → Psychological support
3.90 → Ascending trendline support
3.80 → Major demand area
🔮Outlook
AMBP is approaching a technical inflection point.
Ideally, price either:
• stays above $4.15 with increased volume and starts a new momentum leg, or
• continues consolidating while respecting the rising trendline before a later breakout.
Both outcomes keep the overall bullish setup alive.
🎯 What I Expect
🟢 Bullish Scenario
Clean breakout above $4.15 and stay above this level
Volume confirms buyer strength
Move toward $4.40 → $4.60 → $4.80
🔄 Alternative Scenario
One more consolidation phase
Rising trendline continues to hold
Breakout delayed but technical structure remains intact
💡 My Take
Sometimes the best setups are the ones flying under the radar.
AMBP has been quietly building a constructive base for several weeks, and the repeated tests of resistance suggest sellers are gradually losing control. If volume joins the move, this could become an interesting breakout candidate.
Bonus stock to keep on the watchlist for next week.
If you enjoy and like clean, simple analysis — follow me for more.
This is just my thinking and it is not invesment suggestion , please do not make any decision with my anaylsis.
Have a green trade week to all
#AMBP #Breakout #TechnicalAnalysis #TradingView #StockMarket #SwingTrading #MomentumTrading #Investing #ChartAnalysis #Watchlist
 Long
Long
My Weekly Watchlist: Triangle Breakouts With Best Risk/RewardI mainly trade symmetrical triangle breakouts, focusing on finding the setups with the best risk-to-reward (R/R) potential.
NYSE:SM
This is an oil play, so the breakout and its strength will depend heavily on how oil performs this week. With no resolution to the conflict in the Middle East in sight, I see little reason for oil prices to drop significantly in the near term.
Also, watch the 4H RSI, which is consolidating in a triangle of its own. A breakout in the RSI would add further confirmation that the price breakout is successful.
NASDAQ:DBX
This was on last week’s watchlist and is currently holding successfully above the very important breakout level while basing around this area. Basing around the breakout level is a very good sign that the stock is likely to continue higher.
NYSE:SPOT
Spotify has been consolidating in this triangle since March. The breakout confirmation level is $534, but I’m planning to get in earlier. The blue moving average is the 200-day MA, and if the price can close the trading day above it, I’ll look to take a partial position and add more on a breakout above $534.
NYSE:APO
I entered this position last Thursday after the price broke above the breakout confirmation level. Since then, it’s been consolidating right around the breakout area, which is exactly the kind of price action I like to see after a breakout. My stop-loss here is $134.80.
 Long
Long
NVDA 1D: Pause before the next chipOn the daily chart NVIDIA has shifted from a strong impulsive advance into a consolidation phase. After printing new local highs, price formed a contracting structure, broke higher, and returned for a retest of the breakout area. Selling pressure remains limited, with no follow-through to the downside, suggesting a pause within trend rather than a reversal.
Structurally, price action reflects consolidation inside a broader uptrend. The 185–190 area remains the key holding zone, where price stabilized after the retest and continues to trade above the 100-day moving average. Higher lows are preserved, keeping the higher timeframe structure intact. MACD holds above the zero line, while ADX continues to decline, confirming compression rather than directional expansion.
The primary reaction level sits near 212, marking the upper boundary of the current consolidation. Acceptance above this level would allow for continuation toward the 230–232 area, aligning with the upper expansion of the range. A failure to hold the 185-190 zone would shift price into a wider neutral structure without confirmation of trend continuation.
Fundamentally, NVIDIA remains strong. Q3 2025 EPS came in at 1.30 USD, with Q4 2025 EPS estimated at 1.52 USD ahead of the February 26, 2026 earnings release. Revenue reached 57.01B USD in Q3, with expectations of 65.56B USD for Q4. Cash flows remain robust, with operating cash flow at 83.16B USD and free cash flow at 77.32B USD. Compute and Networking continues to be the dominant revenue driver.
As long as structure holds, the market remains in digestion mode following the prior impulse.
Price action leads before fundamentals follow.
 Long
Long
GOLD - The local uptrend continuesFX:XAUUSD is bouncing off the 4,313 support level of the trading range formed within the local bullish trend. The situation remains challenging, but the market still has room for further upside
The dollar remains stagnant but continues to look weak. A decline in the Dollar Index could support further upside and the ongoing local bullish trend in gold.
The fundamental and geopolitical backdrop remains unstable.
Globally, gold remains in a bearish trend.
Locally, the market is in a bullish distribution phase, with a 4,313–4,435 range forming within it.
Gold is currently correcting within the range ahead of a potential move higher.
There are not many major events scheduled for the coming week. Attention will be focused on the FOMC meeting, initial jobless claims, and PMI data
Resistance level: 4,435
Support levels: 4,356, 4,313
A long squeeze around the local 4,356 support zone could shift the balance of power in favor of buyers and trigger a continuation of the local uptrend toward the upper boundary of the trading range
Best regards,
R. Linda Long 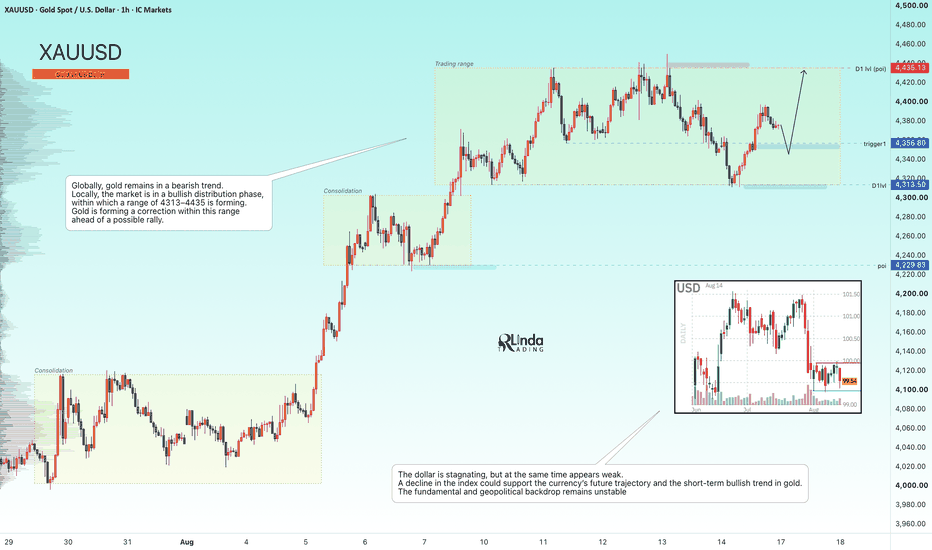
 Long
Long
 Long
Long
ETHUSDT - Consolidation Before Distribution BINANCE:ETHUSDT is attempting to hold above the 1,850 support level in the medium term, which was previously broken resistance. The reaction to support is weakening, while the broader market remains in a bearish trend
Bitcoin remains stagnant and range-bound. Globally, the market remains in a bearish trend, with no fundamental support in sight.
A decline in the market leader could trigger further downside in Ethereum. The altcoin is consolidating within a symmetrical triangle. The market is building a pre-breakdown base near the lower boundary of the current range, suggesting that a downside breakout may be approaching
Resistance levels: 1,989, 1,927
Support levels: 1,866, 1,854, 1,820
The weak reaction to support indicates that selling pressure may be intensifying. I do not rule out a local liquidity sweep (short squeeze) before the downtrend resumes.
A close below the 1,866–1,854 zone could accelerate the further decline
Best regards,
R. Linda  Short
Short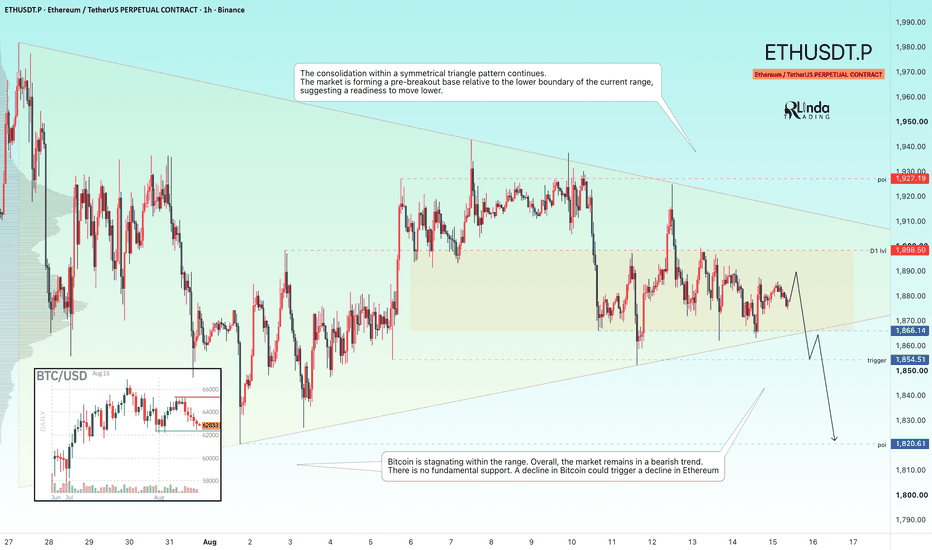
GOLD - The Hunt for Liquidity Ahead of a Rally ICMARKETS:XAUUSD is testing the 4,313 support level as part of a correction. Against the backdrop of a stagnant Dollar Index, the market still has room for further upside
The Dollar Index remains stagnant, but an unstable fundamental and geopolitical backdrop is putting pressure on the dollar and providing support for gold.
Price is correcting after the recent rally, but the fundamental backdrop — including easing rate expectations and geopolitical risks — remains favorable. Buyers are expected to step in on dips.
The key event will be the University of Michigan’s consumer sentiment and inflation expectations data, due later on Friday.
Drivers:
Downside: conflict escalation, rising yields, stronger dollar.
Upside: dip-buying, weaker dollar, easing geopolitical risks
Resistance levels: 4,356, 4,435
Support levels: 4,313, 4,300
Gold maintains its local bullish trend. Within the counter-trend correction, the market is retesting the key liquidity zone at 4,313–4,300 and is bouncing off support.
A close above 4,356 could strengthen the bullish momentum
Best regards,
R. Linda Long 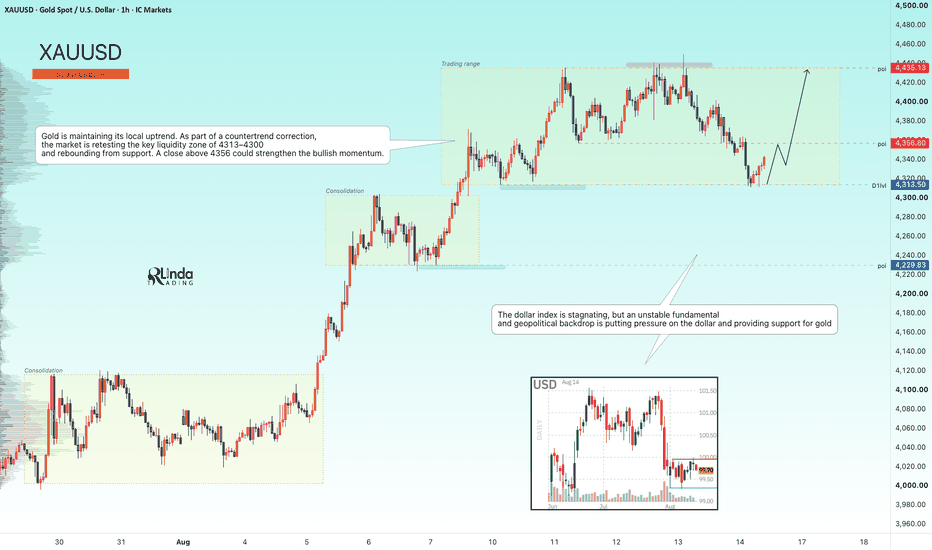
 Long
Long
MESU Aug 14: 7820 Holds the Key to 7840MESU continues to show a bullish structure, with price trading above the key intraday support around 7,820.
For the upside, yesterday’s high around 7,838–7,840 remains the first liquidity target. As long as buyers continue defending 7,820, I’m watching for another attempt to sweep that high.
A confirmed break and acceptance above 7,840 could open the door for further upside price discovery.
On the downside, 7,820 is the key level protecting my bullish bias. If we get a confirmed 1-hour close below 7,820, I would become more cautious and start watching for a deeper pullback toward the fair value gap around 7,800.
Key levels:
7,840 — upside liquidity / first target
7,820 — crucial support and decision level
7,800 — fair value gap / downside target
Bullish scenario: Hold above 7,820 → target 7,840 → potential continuation if the high breaks.
Bearish scenario: Lose 7,820 with confirmation → watch for a pullback toward 7,800.
Since this is Friday, I’ll also be cautious about profit-taking and late-session reversals.
Not financial advice. No confirmation, no trade. CME_MINI:MESU2026  Long
Long
Weekly Stock Watchlist August 10- 5 Great Breakout Setups Before becoming a consistent trader I tried almost every strategy that you can think of, momentum trading, mean reversion, trend following and many more.
I finally found consistency when I started to focus and sharpened my tools on one setup, symmetrical triangle breakouts, a pattern that I consider perfect (at least for me!).
My sweet spot is swinging these breakouts for a few days, capturing a decent chunk of the move and then cashing out. Sure, sometimes I sell too early, but as long as I’m still making good money, there’s nothing to cry about.
Each Sunday, I watch dozens, and sometimes even more than 100 charts manually, in order to build my watchlist for the coming week. Most of the stocks on my watchlist are stocks that are consolidating in a triangle pattern and are about to break out, or have already broken out but are still in the early stages of the breakout, so there is plenty of room to the upside.
My Watchlist for August 10–14
DBX-
Huge triangle forming since February 2024. The breakout above the key level of $33.43 happened on August 4th. I was reluctant to buy then, as earnings were due two days later, on August 6th, and I was worried about disappointing results and a potential gap down.
After the results came out positive on Thursday pre-market, I bought some shares after the market opened. My stop here is at $32.10, which is about $2 below my entry price, targets are on the chart.
NYSE:BA
Boeing has been consolidating in a symmetrical triangle since late January. The price is currently struggling to break through the “ceiling” of the triangle. It might take another few days, but I think this chart will eventually give the trade. The breakout confirmation level is $244.07, with the targets listed on the chart.
NYSE:SKY
Another great-looking triangle. The company beat earnings expectations, which caused the huge green candle last Wednesday. Another positive sign is that the moving averages are about to form a “golden cross,” with the 50-day moving average crossing above the 200-day moving average. Breakout confirmation level: $99.17.
NYSE:SW
Not as clean as the others, but it could still be a great trade if we get a convincing breakout above the confirmation level.
NASDAQ:MDB
Price has been consolidating in a huge triangle since January 2026. A “golden cross” has also formed, and we can see the moving averages starting to “spread apart,” which could be a sign that the price is about to accelerate to the upside. There’s huge potential for gains here if the stock behaves nicely.
If you found this content valuable, I’d really appreciate a boost and a comment. It helps me understand what you guys want to see more of and motivates me to keep creating and sharing these setups. Appreciate the support!
 Long
Long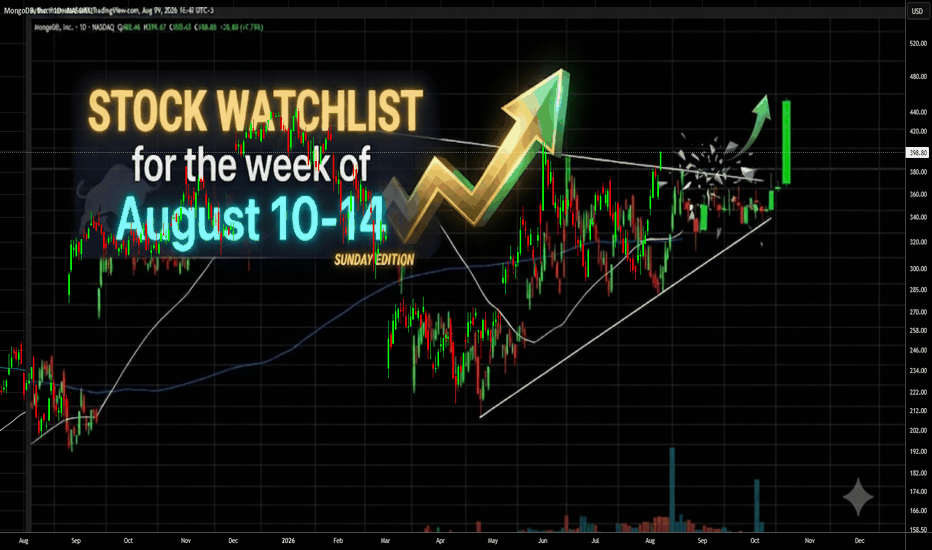
 Long
Long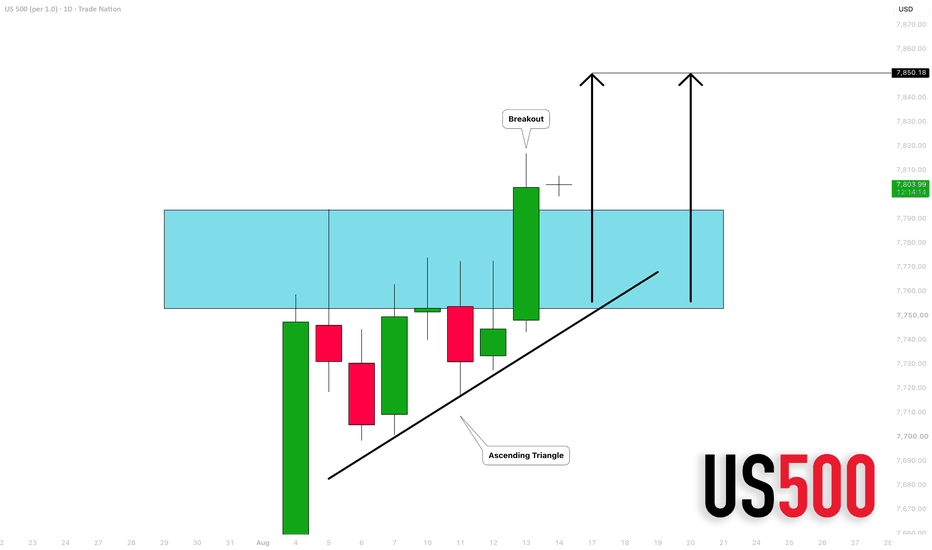
BITCOIN - A false breakout before a declineBINANCE:BTCUSDT.P closed within the 62,000–66,000 range. Liquidity zones have formed around the consolidation boundaries, but buyer weakness could potentially trigger a decline toward the areas of interest
There is no fundamental support in the market, while the geopolitical backdrop is exerting excessive pressure.
Technically, Bitcoin remains stagnant and trapped inside a sideways range that is developing within the broader global bearish trend. Simply put, the market is consolidating.
The reaction to support is weakening. However, before the decline continues, market makers may trigger a short squeeze toward the 65K resistance level. The area of interest is the liquidity zone around 62,300
Resistance levels: 64,500, 65,400
Support levels: 62,300, 61,900
A false breakout of the nearest resistance zone could shift the balance of power in favor of sellers and trigger a breakout from the triangle, potentially followed by downward distribution toward 62,000
Best regards,
R. Linda  Short
Short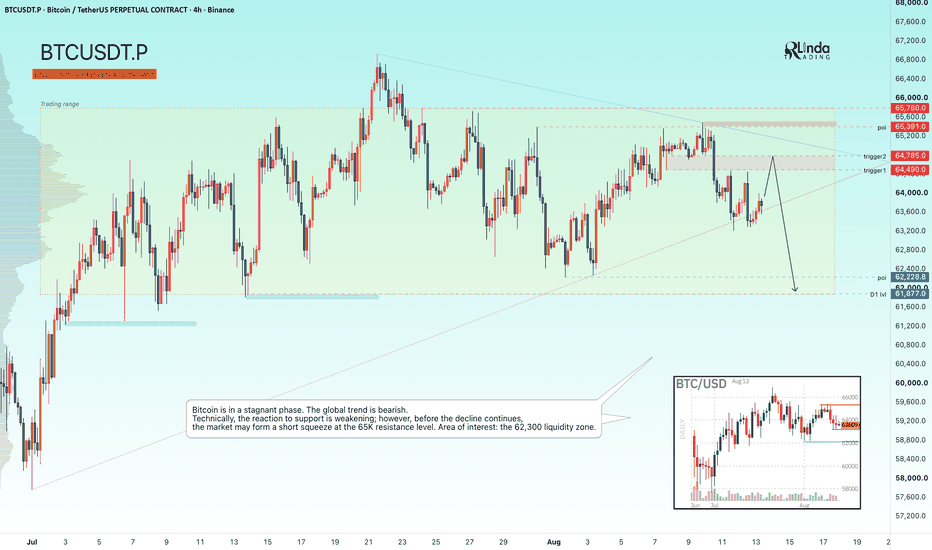
 Long
Long
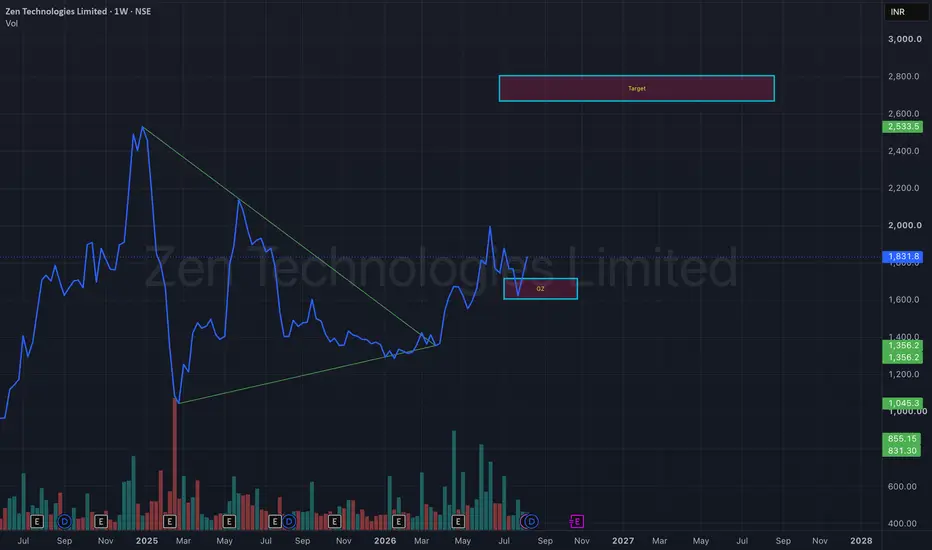
Zen Technologies: Symmetrical Triangle Breakout LoadingZen Technologies has been consolidating within a Symmetrical Triangle on the weekly timeframe, following a sharp rally and subsequent correction. The narrowing price range indicates that both buyers and sellers are reaching equilibrium, often leading to a strong directional move once the pattern resolves.
The recent breakout above the upper trendline suggests buyers are attempting to regain control, while the former resistance zone now acts as a key demand area.
📊 Technical Highlights
✅ Symmetrical Triangle breakout
✅ Higher lows indicate improving buying interest
✅ Breakout backed by strong weekly momentum
✅ Price holding above the breakout zone
✅ Volume expansion supports the bullish outlook
📍 Key Levels
Breakout Zone: ₹1,650–1,700
Immediate Support: ₹1,600
Major Support: ₹1,350–1,400
🎯 Bullish Scenario
If price sustains above the breakout zone with continued buying interest, the next leg of the uptrend could unfold.
Potential Targets:
🎯 Target 1: ₹2,100
🎯 Target 2: ₹2,350
🎯 Target 3: ₹2,700–2,800
⚠️ Risk
A weekly close back below ₹1,600 would invalidate the breakout and could lead to a retest of the ₹1,350–1,400 demand zone.
Technical Summary
Pattern: Symmetrical Triangle Breakout
Trend: Long-Term Bullish
Timeframe: Weekly
Confirmation: Weekly close above ₹1,700 with strong volume
Bias: Bullish while above the breakout level
Disclaimer:
This analysis is for educational purposes only and should not be considered investment advice. Always perform your own research and use proper risk management before making investment decisions.  Long
Long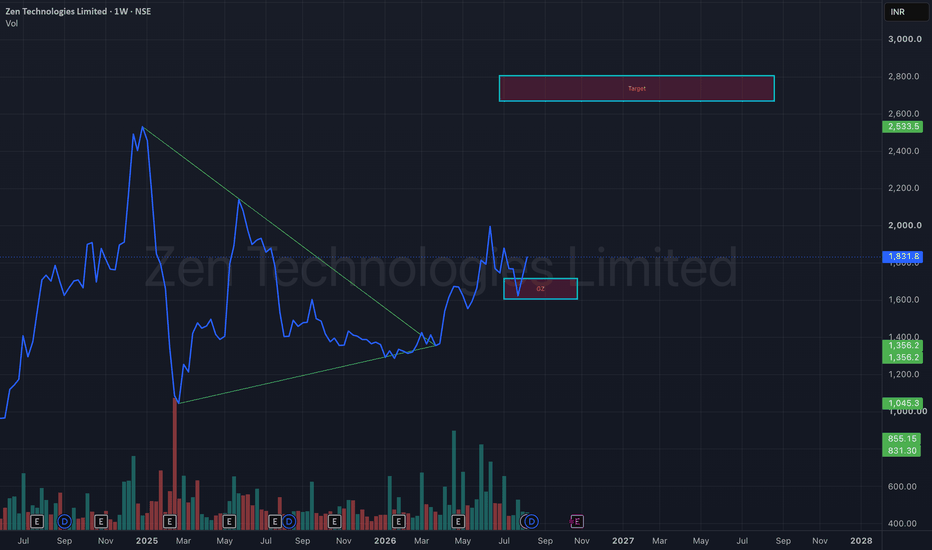
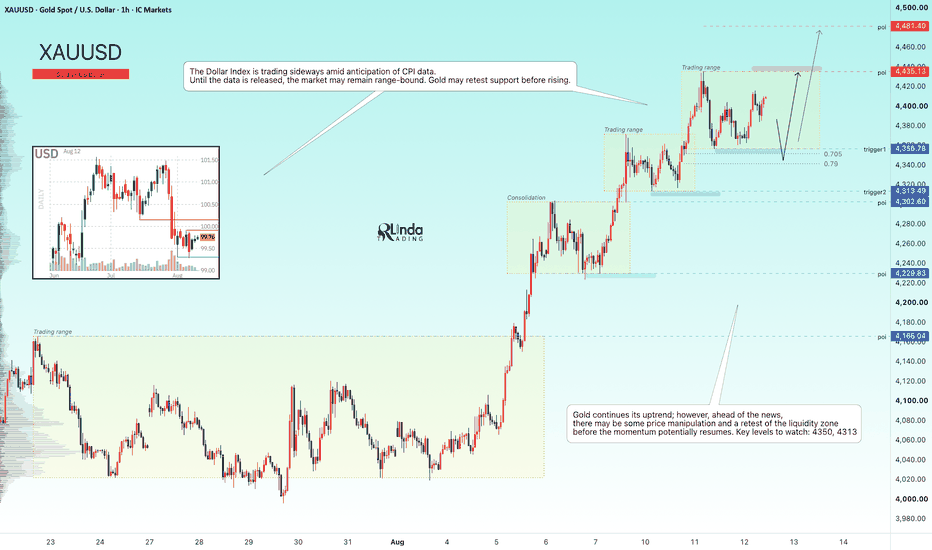
GOLD - The news could trigger a long squeezeICMARKETS:XAUUSD is consolidating within the 4355–4435 range, while the U.S. dollar remains largely stagnant ahead of the upcoming CPI data. Until the release, the market may remain trapped inside the current range while preparing for a potential liquidity manipulation
The U.S. Dollar Index is also consolidating as traders wait for the CPI report. Gold has stalled ahead of this key inflation data, and the initial reaction to CPI could be short-lived as geopolitical risks remain elevated.
A weaker-than-expected CPI could open the door to new highs, while hotter inflation data could trigger a corrective move. The market is waiting for a clear catalyst.
Bullish drivers: Weaker CPI, A weaker U.S. dollar, Lower expectations for further rate hikes, Geopolitical de-escalation
Bearish drivers: Hotter-than-expected CPI, Hawkish Fed rhetoric, A stronger U.S. dollar, Geopolitical escalation
Gold remains in a bullish phase, but news-driven volatility could create a liquidity sweep / long squeeze before the next directional move
Resistance levels: 4435, 4481
Support levels: 4356, 4313, 4302
Gold remains in a bullish phase. However, news-driven volatility could create a liquidity sweep / long squeeze before the next continuation move.
The key zones to watch are 4350 and 4313. A false breakdown of either level, followed by consolidation back above it, could become the technical catalyst for another bullish impulse.
Best regards,
R. Linda Long