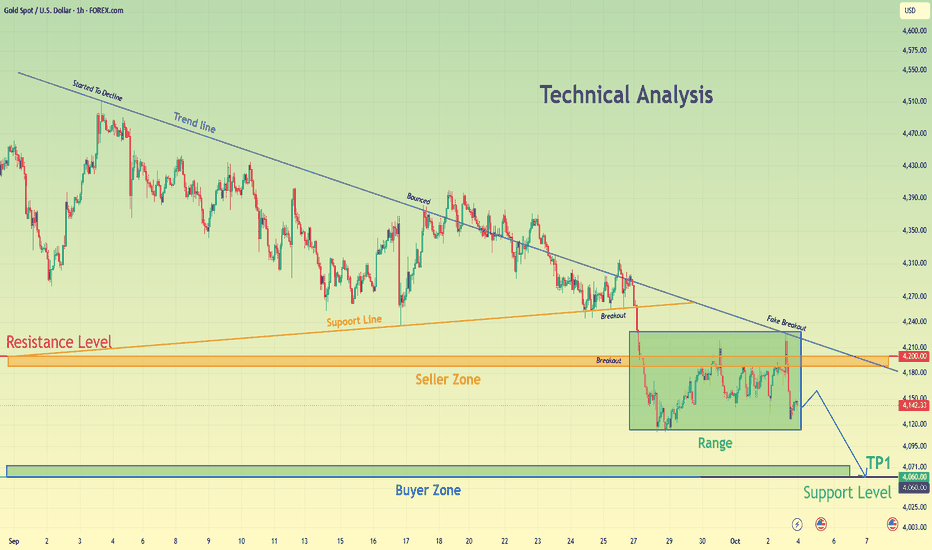
XAUUSD Stays Under Pressure as 4,200 Continues to Reject BuyersHello traders! Here’s my technical outlook based on the current XAUUSD (1H) chart structure. XAUUSD previously started to decline under the Trend Line and formed a range near the Seller Zone. Price then tested the Resistance Level with a fake breakout and was rejected. Currently, XAUUSD is trading below the 4,200 Seller Zone while holding above the 4,060 Buyer Zone. The recent rejection and descending structure suggest a possible continuation lower toward support. As long as XAUUSD remains below
Triangle
GOLD - A countertrend correction before the trend resumes CAPITALCOM:XAUUSD is bouncing from 4,065 and forming a counter-trend correction. The support zone remains relevant, as does the medium-term bearish trend.
The dollar remains strong, oil prices are rising, and the fundamental backdrop is weak, which is putting overall pressure on the metal
Gold is attempting to recover but remains under pressure from elevated yields and the Fed’s hawkish stance. Support is coming from buying on dips and longer-term factors. The focus is on jobless claims da
BITCOIN - The liquidity hunt phase ahead of the rally BINANCE:BTCUSDT.P continues to consolidate within the current bullish cycle. A liquidity-hunting phase is forming ahead of a possible continuation of the rally.
Bitcoin maintains a bullish market structure, with consolidation forming above the key resistance at 82,500. Within the current bullish trend, MM may form a manipulation around key liquidity zones. Fundamentally, the bullish drivers have faded, but technically, the market still looks strong.
The market is testing the 84,500–83,800
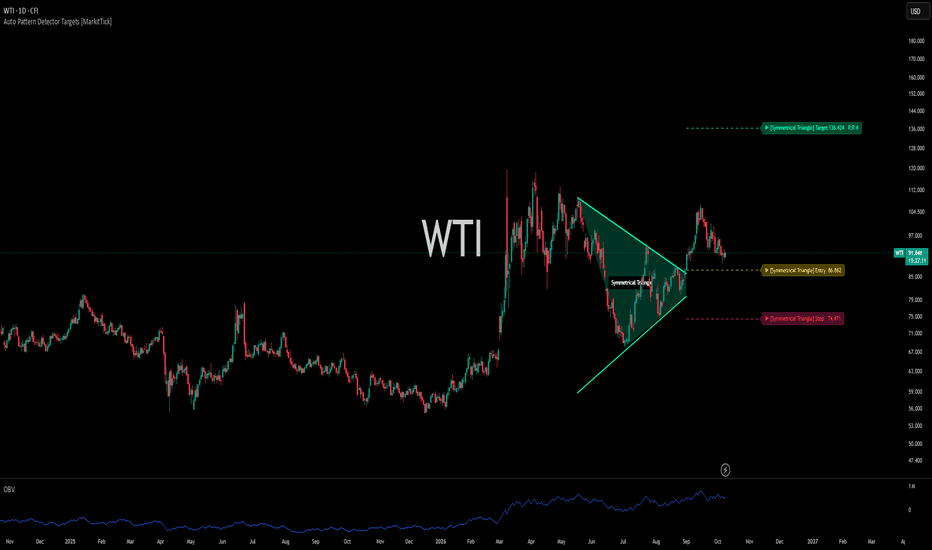
WTI Crude Oil: Macro Symmetrical Triangle & Inventory DrawWTI Crude Oil is carving out a massive **Symmetrical Triangle** consolidation pattern on the daily chart near the $91.78 level. After a series of large volatility swings, price action is coiling tightly within converging trendlines, setting up for a major macro expansion.
Here is how I am breaking down both sides of this setup:
The Bullish Case (Macro Expansion)
If buyers defend the lower trendline support and trigger a measured upside continuation from this compression zone, the macro target
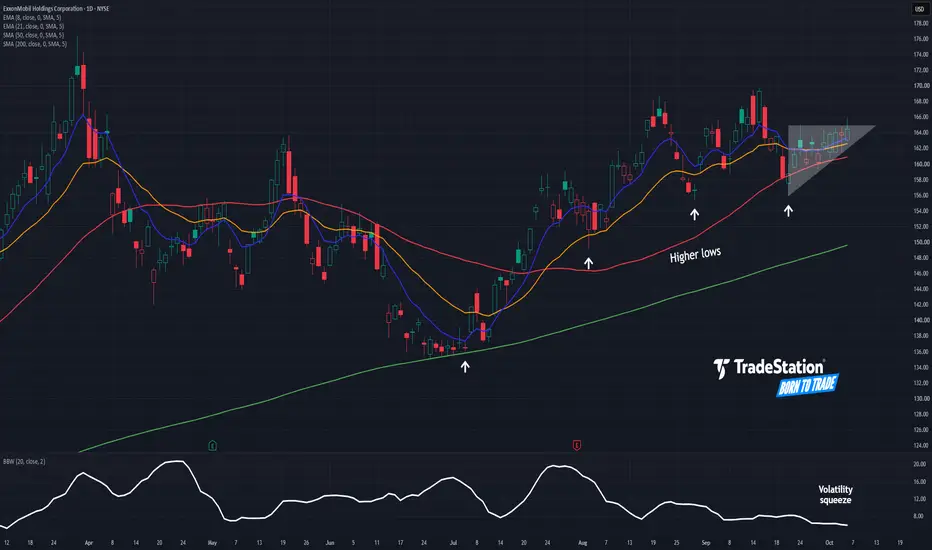
ExxonMobil: Potential Continuation PatternExxonMobil has been rising along with energy stocks, and some traders may see potential for another leg higher.
The first pattern on today’s chart is the narrowing consolidation since September 22. XOM has made higher lows while mostly staying under the September 24 high of $164.91. Is that a bullish ascending triangle that’s breaking to the upside?
Second, Bollinger Bandwidth has narrowed to the tightest range since March. Such tight consolidation may create potential for prices to expand.
GOLD - Consolidation near 4,100. Bearish trend ICMARKETS:XAUUSD remains under pressure from the bearish trend and a strong dollar, confirming its bearish market structure. A retest of the 4,110 support is forming, along with a pre-breakout base...
Gold has resumed its decline and is threatening the $4,100 level after pulling back from $4,200.
In the near term, sellers remain in control due to elevated Treasury yields, a strong dollar, and rising oil prices, despite expectations of an October Fed rate hike having almost completely disap
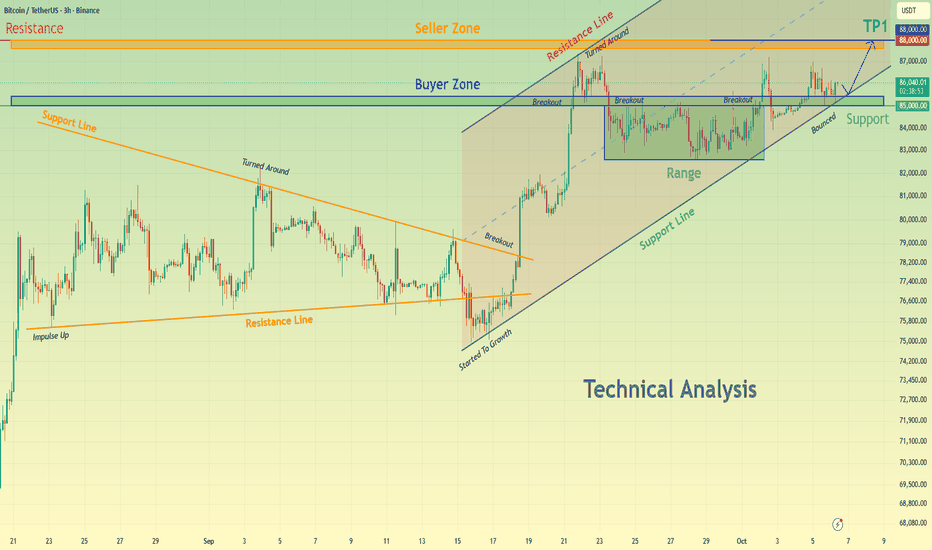
BTCUSDT Strengthens After the Range Bounce — 88,000 AwaitsHello traders! Here’s my technical outlook based on the current BTCUSDT (3H) chart structure. BTCUSDT previously traded inside a descending structure before breaking higher and shifting bullish. Price then formed a range near the Buyer Zone, tested higher levels, and bounced from support. Currently, BTCUSDT is trading below the 88,000 Seller Zone while holding above the 85,000 Buyer Zone and the ascending Support Line. The recent bounce from support suggests buyers are preparing for another move
NZDCAD: Bearish Trend Continuation 🇳🇿🇨🇦
NZDCAD is trading in a downtrend on a daily time frame.
The market was coiling for 2 weeks within a symmetrical triangle pattern.
Its support was finally broken last week.
I expect a trend-following movement.
Next goal - 0.794
❤️Please, support my work with like, thank you!❤️
I am part of Trade Nation's Influencer program and receive a monthly fee for using their TradingView charts in my analysis.
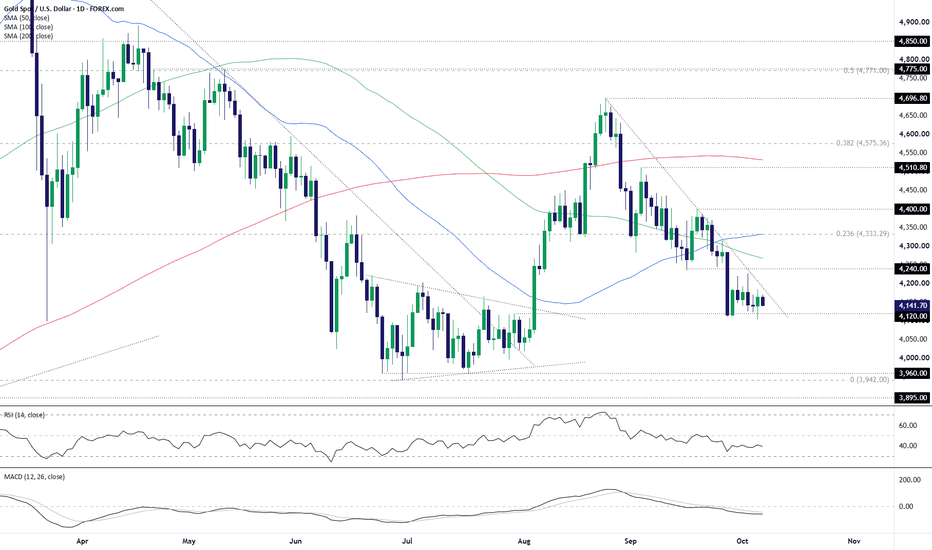
Gold risks another leg lowerGold remains heavily influenced by both the US dollar and front-end US Treasury yields, demonstrating a persistent inverse relationship with both over recent periods.
With the US dollar ripping higher following September’s near-historic surge in two-year Treasury yields, it comes as little surprise to see gold has fallen sharply over the same period.
The price now finds itself squeezed between horizontal support at $4,120 on the downside and downtrend resistance running from the August 24 high
XRP Looks ready for $1.93The current symmetrical bull pennant priceaction is at the apex of seems likely to break upward. The current candle is slightly above the top trendline, and the stochrsi is just now climbing back out of the oversold zone with plenty of room to move upward. We also have the bullish confluence of the fact that both the current pennant and the bullflag we broke up from a week or few back have the exact same measured move target right around $1.93/ All good indications that a validated breakout is a
NBIS consolidation appears broken but I smell a trapI said this before. I have alot of shares so I look to protect them and my long options with protective puts.
That said. NBIS is suck in an uptrend trying to break out of the downtrend since 280ish broke down. Those channels or trend lines pointed to consolidation that happened to come to a tight point where it was going to break. It just happens it was the earnings date… lol coincidence amiright
That said. The market is pumping but recently TA has no lied.
Today NBIS clearly broke the con
HYPEUSDT - The correction is over. Ready for the rally BINANCE:HYPEUSDT.P is consolidating near resistance formed within the trading range. The market is bullish, as is the altcoin’s trend, and I expect the rally to continue.
Bitcoin maintains its bullish structure and continues to consolidate with preconditions for further growth. A strong Bitcoin provides support to the entire altcoin market.
HYPEUSDT looks favorable for continuation of the main trend. The correction is over, and the focus is on the 91.800 trigger. A breakout of resistance c
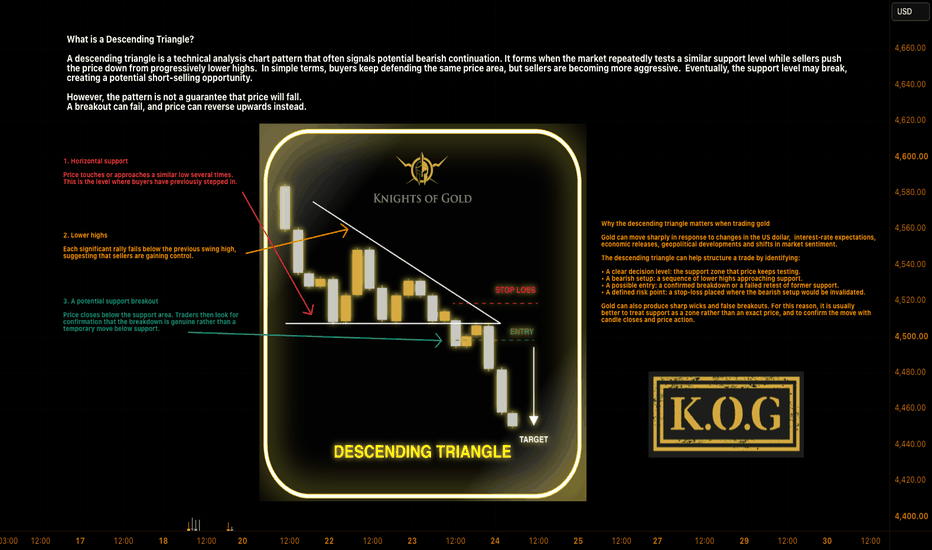
KOG - Trading the Descending TriangleFollowing on with our educational posts, The Descending Triangle:
The goal is not to sell simply because a triangle appears on the chart. The goal is to identify the pattern, wait for confirmation, calculate your risk and execute a plan.
Start with the higher timeframe
Open the XAU/USD 4-hour (H4) or 1-hour (H1) chart to identify the broader market direction.
• Is gold making lower highs and lower lows?
• Is price trading below a significant resistance area?
• Is there a clear bearish trend
Euro Slides From 1.1290 as Sellers Keep the Downtrend IntactHello traders! Here’s my technical outlook based on the current EURUSD (4H) chart structure. EURUSD previously traded inside a range before breaking higher and later forming a descending structure after turning around from the highs. Price then tested the Seller Zone and was rejected, continuing lower. Currently, EURUSD is trading below the 1.1290 Seller Zone while holding above the 1.1130 Buyer Zone. The recent rejection and descending structure suggest a possible continuation lower toward supp
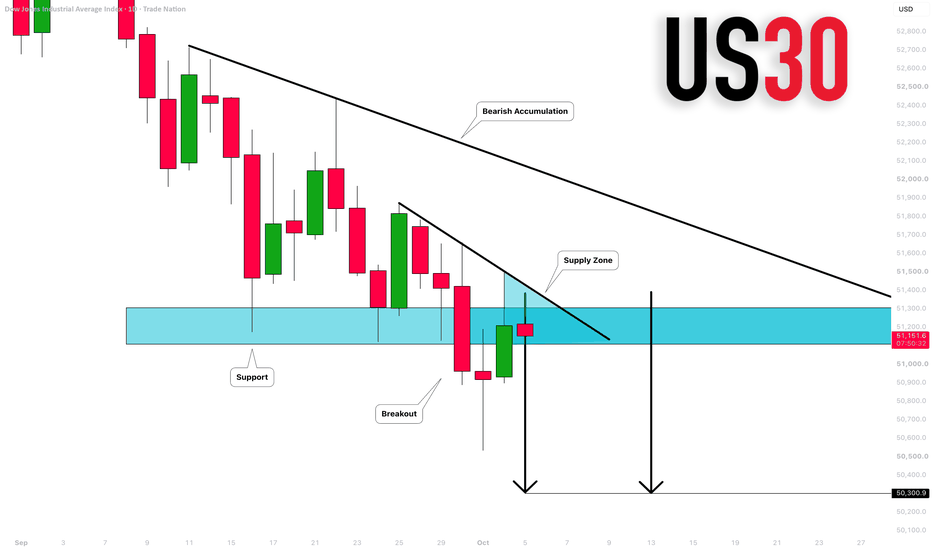
DOW JONES INDEX (US30): Strong Resistance Holds
Quick update for my analysis of the US30 Index.
Earlier, we spotted a confirmed breakout of a major support cluster.
The market is retesting it at the moment.
With a high probability, the index will drop soon.
Goal - 50300
❤️Please, support my work with like, thank you!❤️
I am part of Trade Nation's Influencer program and receive a monthly fee for using their TradingView charts in my analysis.
Himax: Potential Triangle BreakoutHimax Technologies has squeezed into a tight range after a big move in the spring. Now it could be breaking out.
The first pattern on today’s chart is the series of lower highs and higher lows since late July. The chipmaker apparently escaped the top of that triangle on Friday, which could be viewed as a breakout.
Second, Bollinger Bandwidth highlights the tight range. Does the volatility squeeze create potential for a move?
Next, the 50-day simple moving average (SMA) is above the 200-day SM
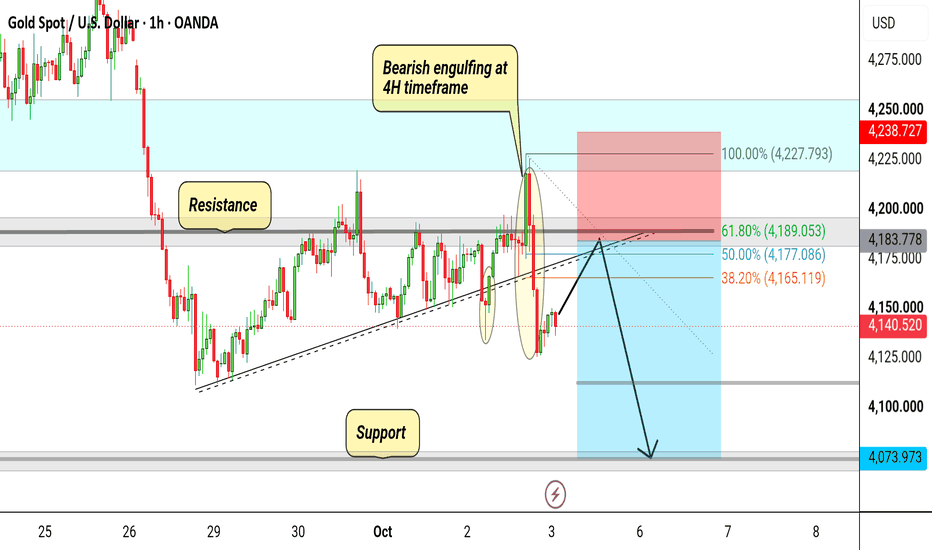
XAUUSD Bearish Rejection at Key Fibonacci ResistanceExecutive Summary
Gold (XAUUSD) is showing strong technical signs of a bearish continuation following a temporary pullback into a key confluence zone. Price recently swept local liquidity, retesting a broken ascending trendline, the horizontal resistance block near $4,185-$4,189, and the 61.8% Fibonacci retracement level. With the market failing to sustain momentum above this resistance level, a bearish impulse toward the major support zone near $4,074 is expected. This anticipated downswing r
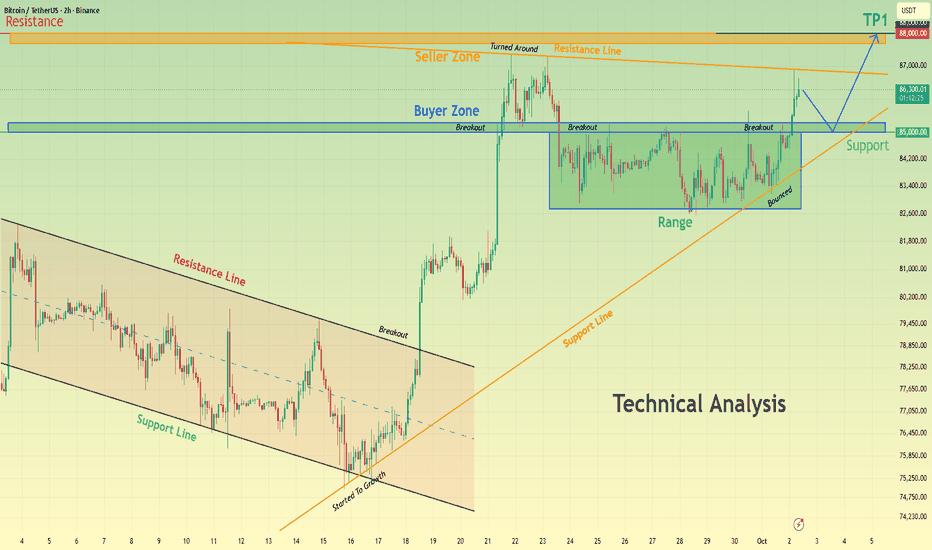
Bitcoin’s Latest Bounce Keeps the 88,000$ Upside Scenario OpenHello traders! Here’s my technical outlook based on the current BTCUSDT (2H) chart structure. BTCUSDT previously traded inside a descending structure before breaking higher and shifting bullish. Price then formed a range, tested the Seller Zone, and pulled back before bouncing from the Buyer Zone and ascending Support Line. Currently, BTCUSDT is trading below the 88,000 Seller Zone while holding above the 85,000 Buyer Zone and the ascending Support Line. The recent bounce from support suggests b
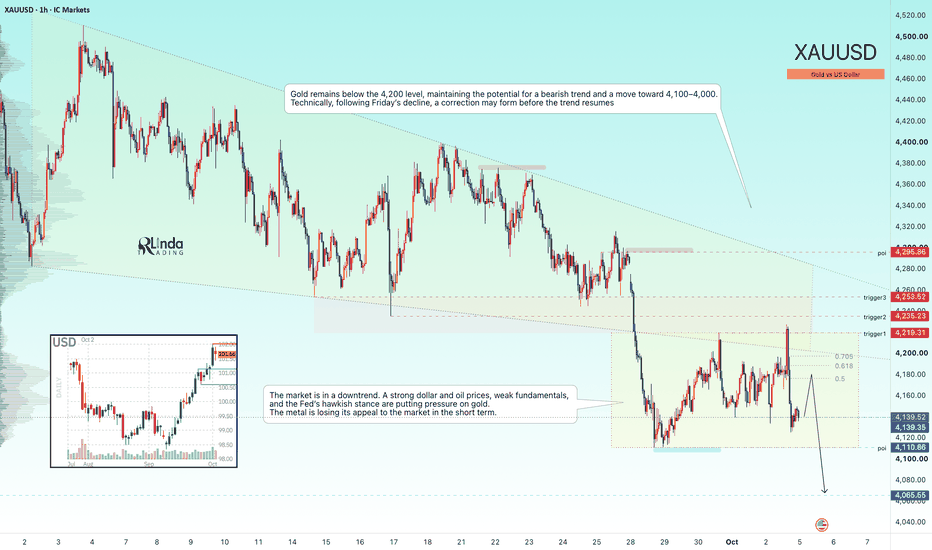
GOLD - Formation of a new range in a bear market ICMARKETS:XAUUSD is forming a short squeeze of resistance following Friday’s NFP release and, in line with the previously published scenario, continues to decline from the identified triggers.
The market remains in a bearish trend. A strong dollar and rising oil prices, a weak fundamental backdrop, and the Fed’s hawkish stance are putting pressure on gold. However, following Friday’s report, the market is beginning to question the continuation of interest-rate hikes. The fundamental backdr
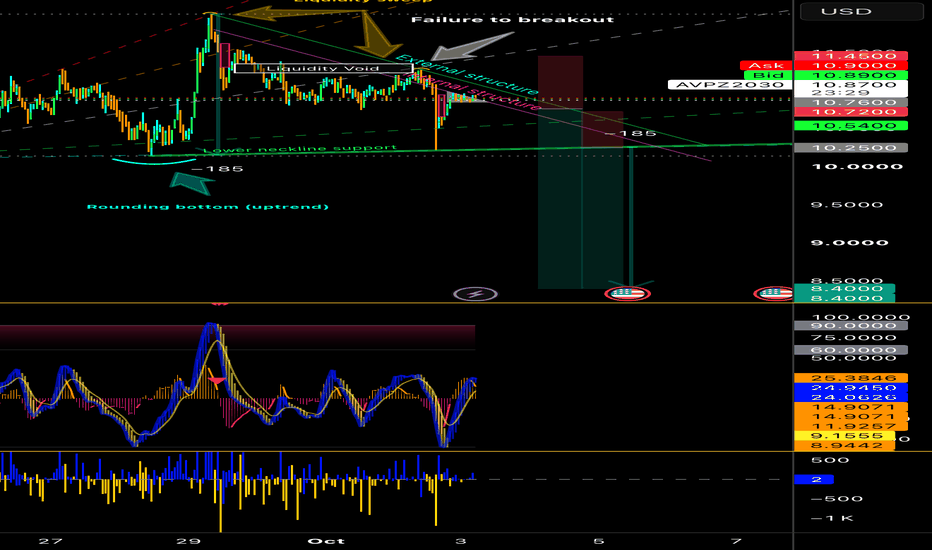
AVPZ2030 (Avax futures) reverse cup and handle Avax was in a clear uptrend until job postings were released and moved altcoin/bitcoin dominance back into bitcoins domain. 60%btc/40%alts which also coincided when Avax was in a liquidity void and attempted to make higher highs/lows. The mix of the sudden dominance swap triggered from news and no clear area of liquidity for institutions to take in the buy side liquidity made price reverse sharply into a reverse cup and handle fitting in its macro trend resembling a descending triangle formation
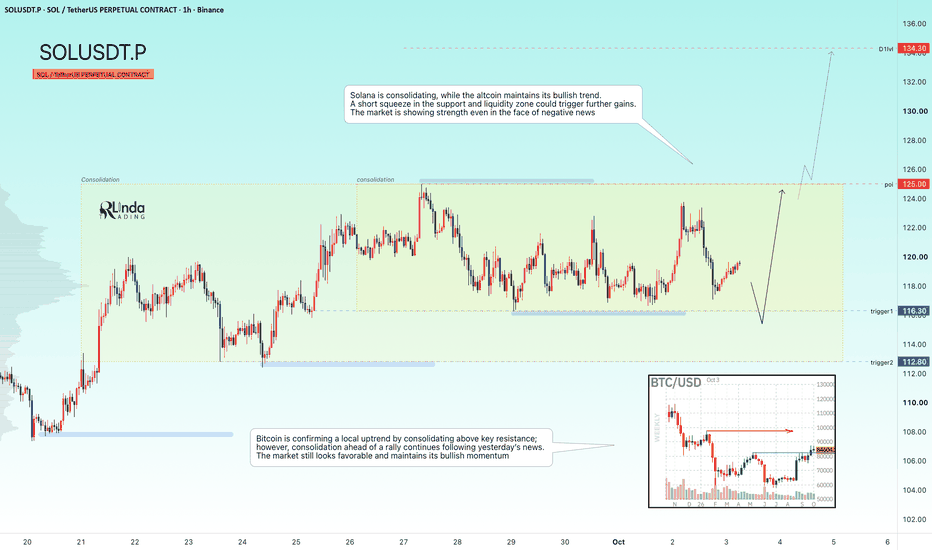
SOLUSDT - Consolidation Ahead of a Bullish DistributionBINANCE:SOLUSDT.P continues to consolidate after strong growth. Focus on the liquidity zone of 116.3–112.8; the counter-trend correction may end soon...
Bitcoin confirms the local bullish trend with consolidation above key resistance; however, consolidation before the rally continues after yesterday’s news. The market still looks favorable and maintains bullish momentum.
Solana is in consolidation; the altcoin maintains a bullish trend. A short squeeze of the support and liquidity zone cou
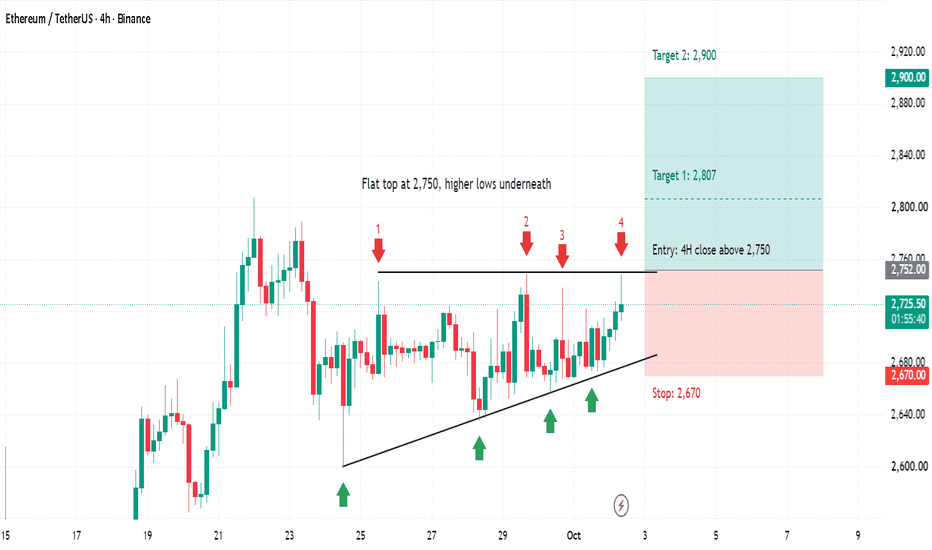
ETH: Four Knocks on 2,750 and the Floor Keeps RisingFour times now ETH has gone up to 2,740-2,750, and four times it has come back. What has changed is the other side. The dips keep getting shallower: 2,600 last week, then 2,636, 2,657, 2,673, and 2,697 today.
So the ceiling has not moved and the floor keeps coming up to meet it. Something gives soon.
I am not buying under the level. If a 4H candle closes above 2,750 I will look for 2,807 first, which is the 21 September high, and 2,900 after that if it holds. On a 4H close below 2,670 the risi