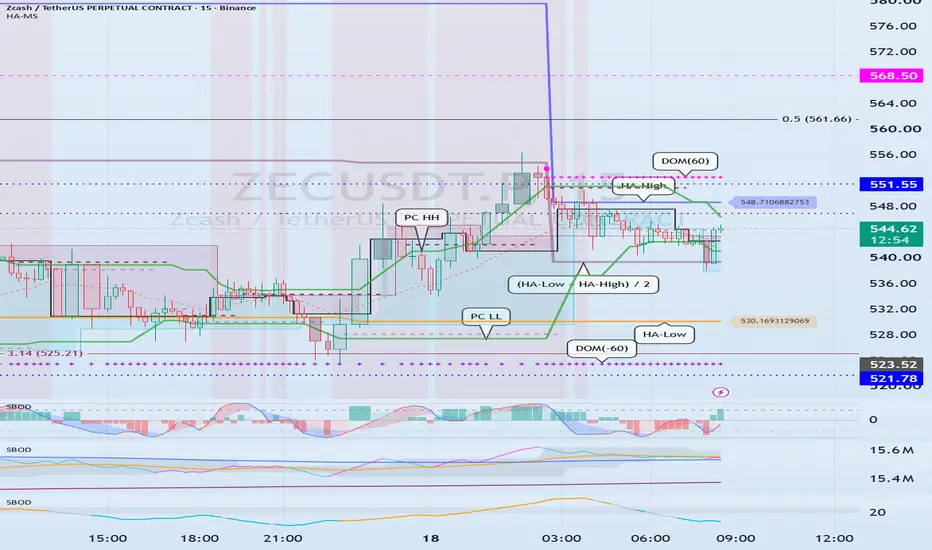
Whether 551.55 Can Be Flipped Into Support After Breakout
Hello traders,
Follow me to stay updated with the latest market insights.
Wishing everyone a profitable trading day.
────────────────────
The current price is trading near the HA-High indicator, making this a short-term resistance zone where a rejection is possible.
However, if price breaks above this area and successfully flips 551.55 into support, the next upside target is 663.91.
A sustained move and acceptance above 663.91 would significantly increase the probability of a stair-step bu
Breadth Indicators
Key Level to Watch: 1,782.28 Support
Hello, traders.
Follow for faster market updates and trading insights.
Wishing everyone a profitable trading day.
-------------------------------------
ETH is expected to remain in a volatility phase through July 18.
The next major volatility window is projected around August 12.
However, BTC's next key volatility period is expected around July 29, making it important to monitor whether the broader market establishes a clear direction at that time.
📉 Short-Term ETH Outlook
ETH recently f
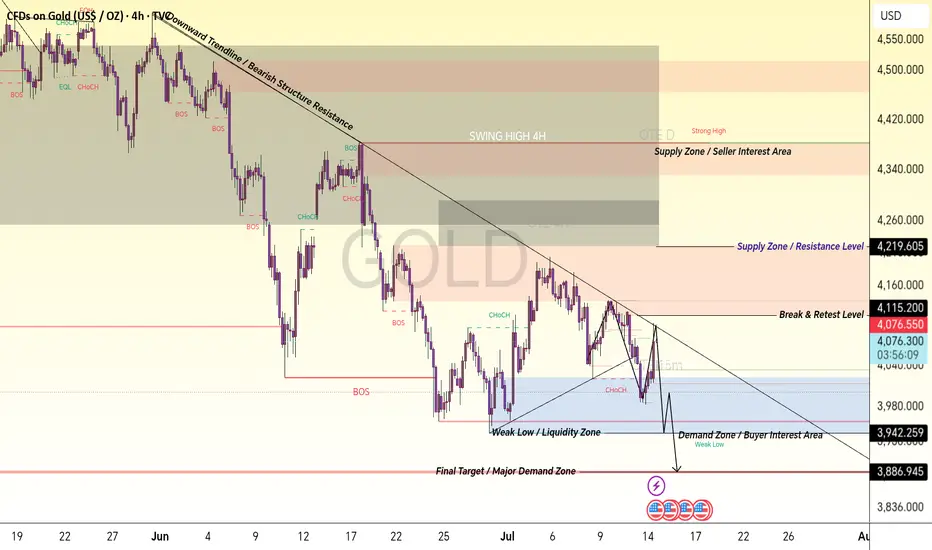
Gold 4H Market Structure Analysis | Bearish Trendline & Key zoneXAU/USD 4H Smart Money Concept Detailed Candle-by-Candle Analysis
Gold 4H chart is showing a complete market structure transition where every candle reflects the battle between buyers and sellers. The price started from higher levels with strong selling pressure after reaching the premium supply area. The early candles created rejection wicks, showing that sellers were defending the upper zone and preventing further upside continuation.
After the rejection from the high area, bearish candles s
Low-Volume Node (LVN) : 145.30 ~ 154.60
Hello traders!
If you "Follow" us, you can always get new information quickly.
Have a nice day today.
-------------------------------------
Since this chart is still relatively new, the support and resistance levels marked on it have not been fully validated by price action yet. Therefore, extra caution is required when trading.
Based on the price action so far, I believe that any price below 168.35 is likely to fall within a medium-to-long-term accumulation zone.
A Low-Volume Node (LVN)
SK Hynix Token???
Hello?
Nice to meet you, fellow traders.
If you "follow" me, you can always get new information quickly.
Have a great day today.
------------------------------------
I'm not sure if this is correct, but it appears to have been listed on the coin market after SK Hynix was listed on NASDAQ.
Since the chart was created not long ago, there is nothing we can know yet.
I will publish updates frequently whenever there is movement in the future.
-
Thank you for reading to the end.
I wish you
Explain charts only with objective information
Hello?
Hello traders!
If you "Follow" us, you can always get new information quickly.
Have a nice day today.
-------------------------------------
The reason for using the chart as an indicator is to maintain the objectivity of the explanation.
This is because objective information about why something was explained that way can be useful when passed on to others.
Indicators only provide objective information, but how to use them to explain is up to the explainer.
In that sense, I am trying
The key is whether it can rise beyond Zone 3
Hello.
Nice to meet you, fellow traders.
If you "follow" me, you can always get new information quickly.
Have a great day today.
------------------------------------
I believe that BTC is the only one that has survived among Bitcoin-based tokens.
Therefore, if you trade Bitcoin-based tokens, you must trade by increasing the quantity corresponding to your profits.
In other words, you need a trading strategy that can protect your original investment capital even if the price plummets.
-
L
Check support near 1782.28
Hello?
Nice to meet you, fellow traders.
If you "follow" me, you can always get new information quickly.
Have a great day today.
------------------------------------
#ETHUSDT
This volatility period is expected to last until July 12, but since the next volatility period is around July 17, eventually July 18 should be viewed as a volatility period.
If the HA-Low indicator of the 1W chart is to be generated at the 1782.28 point next week, support around that point is key.
However, in the big
Check if it can rise above 1.1475 and receive support
Hello?
Nice to meet you, fellow traders.
If you "follow" me, you can always get new information quickly.
Have a great day.
-------------------------------------
I remember when I first started trading cryptocurrencies.
Before I began trading, I looked at how others analyzed charts.
However, unlike stock analysis, trading volume was missing from cryptocurrency analysis.
At first, I thought this was because it was difficult to examine the movement of trading volume due to the sheer number
The key is whether it can rise to the 0.16 and find support
Hello.
Nice to meet you, fellow traders.
If you "follow" me, you can always get new information quickly.
Have a great day.
------------------------------------
Since the chart was created recently, the role of the support and resistance points marked on the chart is weak, so caution is required when trading.
The point where you can start trading is the 0.1600 level, where the HA-Low indicator is formed.
Therefore, you should look for a buying opportunity when the price shows signs of supp
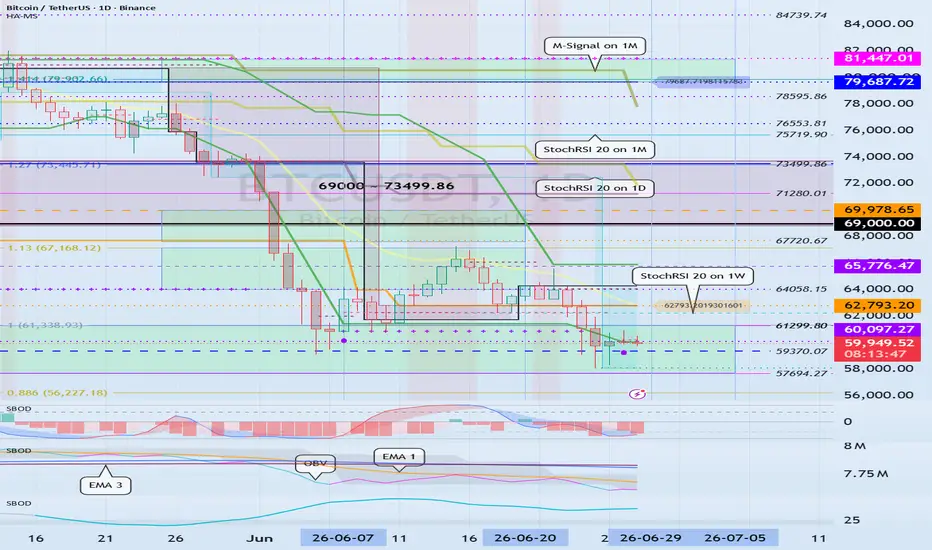
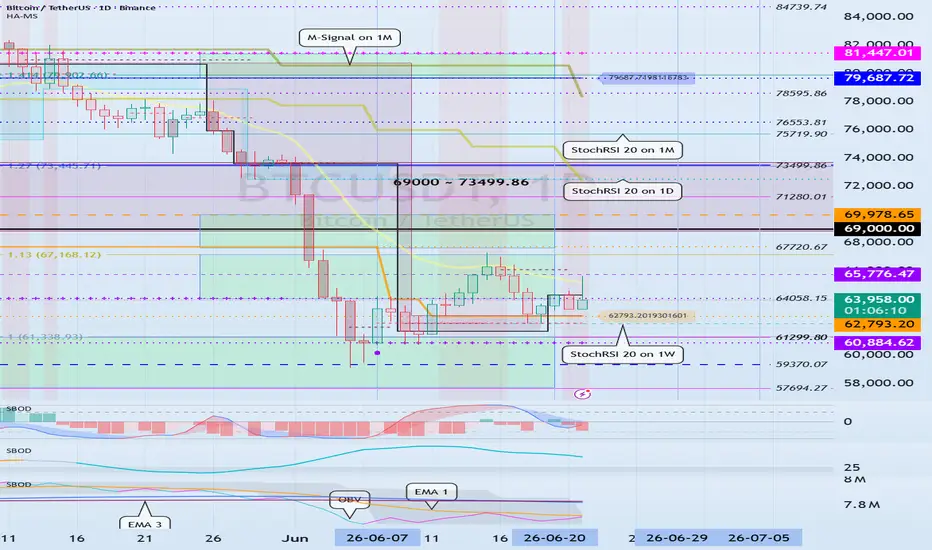
Check if it can receive support and rise around 62793.20
Hello?
Hello traders!
If you "Follow" us, you can always get new information quickly.
Have a nice day today.
-------------------------------------
This period of volatility is expected to last until around July 5th (July 4th to 6th).
The next period of volatility is around July 29th, so we need to pay close attention to the trends that have formed over this period of volatility.
In order to rise at an important point or section and continue the upward trend, the following conditions must
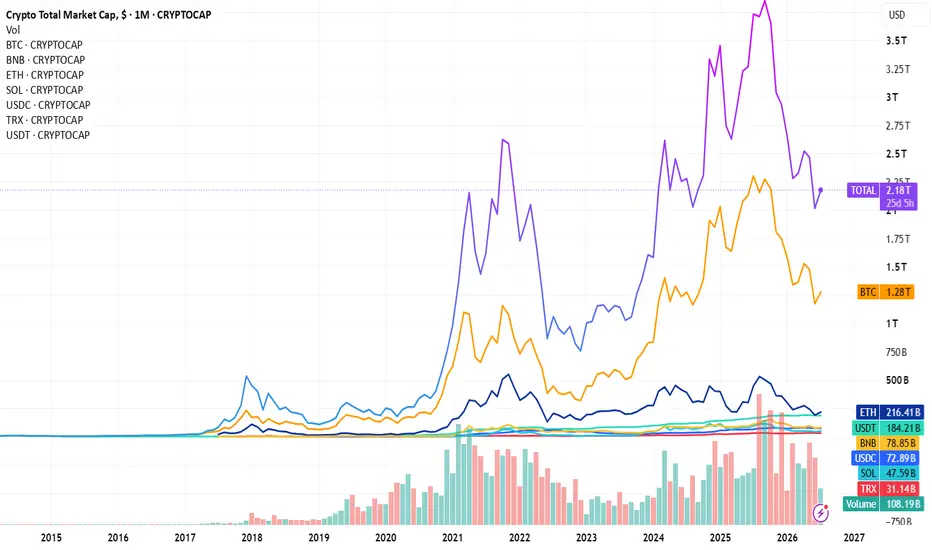
BBES$TT — Crypto Settlement Infrastructure Corewww.tradingview.com
BBESSTT is a proposed term for the core settlement infrastructure of crypto: the dominant monetary assets, stablecoin liquidity, and transaction networks through which most crypto-native value transfer currently happens.
The goal is to track whether crypto settlement is concentrating in this core — or moving away from it.
Methodology: A rules-based, cap-weighted basket of the top 7 crypto assets by market capitalization, excluding memecoins and L2 tokens, while explicit
UK100: Record highs, going nowhere fast?This video contains an analysis of the UK 100 as well as the trade setup that I have created on the 30 June , where the index is trading near all-time highs above 10,484 but without any conviction whether up or down. The MA Cross is right under price, the RSI is holding onto the neutral fifty line, and yet the MACD histogram is forming a formation that price action does not reveal on its own. In this video, you will get a comprehensive look at the FTSE 100 index in which I will explain to you th
Resistance Zone: 117.87 ~ 129.44
Hello?
Nice to meet you, fellow traders.
If you "follow" me, you can always get new information quickly.
Have a great day.
------------------------------------
Important zones are marked with circles and square boxes.
The 117.87 ~ 129.44 range is a high point zone and corresponds to a resistance zone.
However, if it finds support in this range and rises, there is a possibility of a stair-step upward trend.
Therefore, if it finds support around the 117.87–129.44 range and rises, it is exp
Key Volatility Period: Around July 5th
Hello.
Nice to meet you, fellow traders.
If you "follow" me, you can always get new information quickly.
Have a great day today.
------------------------------------
You must proceed with trading according to your trading strategy by identifying volatility zones or support and resistance points on the chart.
To do this, we use various methods that suit our own criteria.
In that sense, you can use indicators such as the Price Channel or Bollinger Bands.
I use the Price Channel indicator b
Support and resistance range: 372.0 ~ 414.23
Hello?
Hello traders!
If you "Follow" us, you can always get new information quickly.
Have a nice day today.
-------------------------------------
The areas marked with circles are important support and resistance areas.
The current price is located in the range 372.0 to 414.23.
I think that anything below 216.60 is likely to enter the mid- to long-term investment zone.
The start of the uptrend is expected to begin when the price holds above 427.94.
-
The key is whether it can rise abo
Next Volatility Period: Around June 29 (June 28 ~ 30)
Hello?
Nice to meet you, fellow traders.
If you "follow" me, you can always get new information quickly.
Have a great day.
------------------------------------
It appears that the price is testing support near the StochRSI 50 indicator point.
If the price fails to find support and falls, you must check for support in the low zone between DOM (-60) and HA-Low.
At this point, if the price falls below the OBV Low indicator, there is a possibility of a sharp decline, so caution is required wh
Let's find a chart interpretation method that suits you!
Hello.
Nice to meet you, fellow traders.
If you "follow" me, you can always get new information quickly.
Have a great day.
------------------------------------
The method for interpreting the auxiliary indicators StochRSI and OBV is as follows.
I believe that looking at the StochRSI and OBV indicators together can help you understand the waves.
Basically, the StochRSI indicator displays waves based on the 50 point.
This allows you to understand regression to the mean and median, which ar
GBPUSD Market Structure – Bearish Trend Continuation Setup
GBPUSD is currently trading within a clear bearish market structure, respecting a strong descending trendline with consistent lower highs and lower lows formation. Price is reacting between key supply and demand zones, showing strong institutional activity and liquidity grabs at important levels.
The market recently rejected from the supply zone around 1.36–1.37, confirming seller dominance. Until price breaks above the descending trendline and sustains momentum, the overall bias remains beari
Support Zone: 0.32031 ~ 0.32406
Hello?
Nice to meet you, fellow traders.
If you "follow" me, you can always get new information quickly.
Have a great day.
-------------------------------------
A high point zone has formed across the range of 0.28503 to 0.34076.
Accordingly, the key question is whether the price can rise above 0.34076 and maintain it.
A strong support zone has formed around 0.18077.
-
A low point zone has formed across the range of 0.32031 to 0.32406.
To break out of the low point zone, the price must
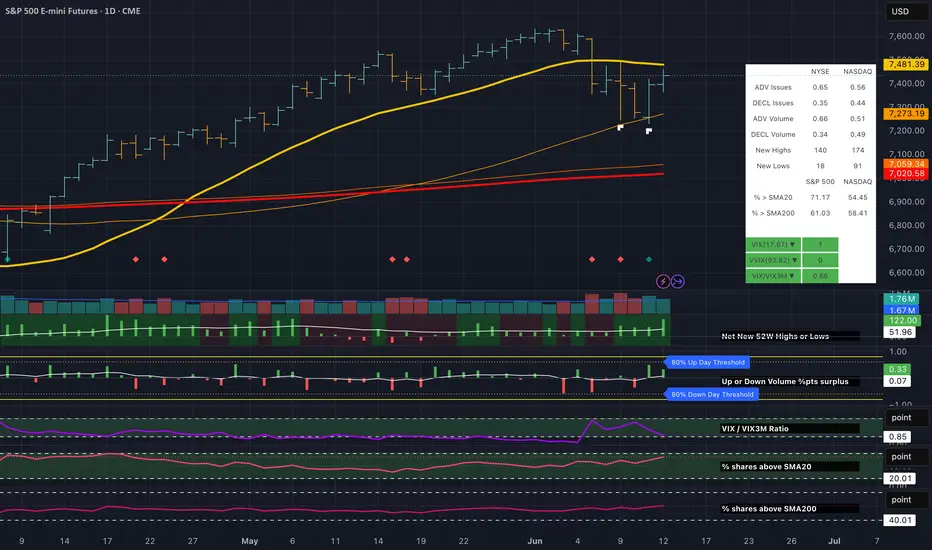
Weekly Review - Internals Recover Before PriceTLDR:
The most important message from the dashboard is that internals improved faster than price. Leadership expanded, participation recovered and volatility normalized while price remains below recent highs. That combination suggests the market's internal condition is currently stronger than the recent price action alone would imply. The evidence therefore supports a regime of Acceptance with Renewed Participation, where market internals are once again confirming rather than questioning the mes
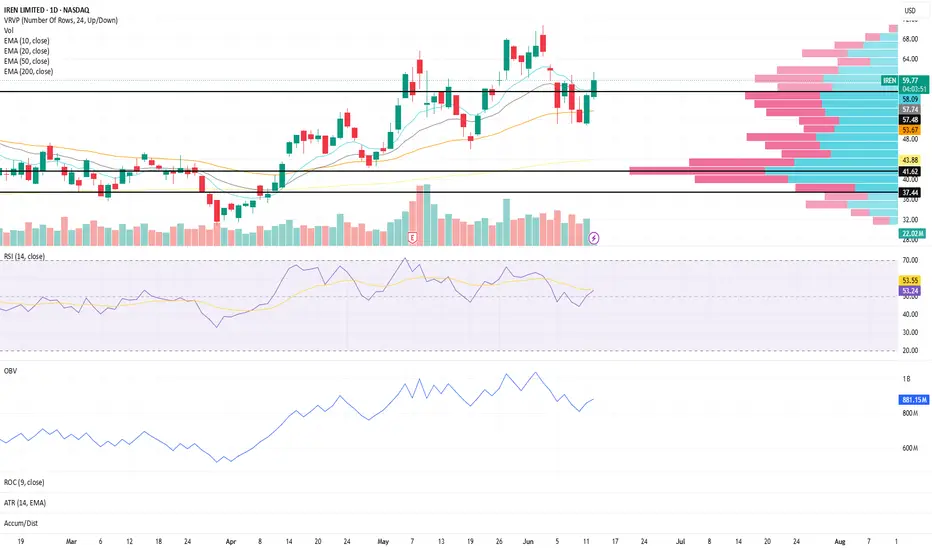
Momentum Above Value Area High | IREN Structure Update IREN continues to show constructive behavior on the daily timeframe as price trades above a key volume profile level.
Price is currently trading above the Value Area High (VAH), suggesting continued acceptance above the upper boundary of the primary value area
The Value Area Low (VAL) remains below current price and represents an area worth monitoring if momentum begins to weaken
The Point of Control (POC) sits below both levels and represents the price where the highest volume has historically
Bank of America: Potential Breakout Bank of America has been grinding higher as the broader market falls, and some traders may expect an acceleration to the upside.
The first pattern on today’s chart is the series of lower highs since early January. The lender ended yesterday above that falling trendline. It also registered its highest closing price in almost four months. Those signals could suggest prices are trying to break resistance.
Second, the 50-day simple moving average (SMA) is nearing a potential “golden cross” above t
SPY Structure Update (Daily Chart)SPY remains in a constructive trend environment despite today's pullback, with the broader moving average structure continuing to hold.
The 10, 20, 50, and 200 EMAs remain positively aligned
Price continues to trade above all major moving averages, keeping the larger trend structure intact
While short-term momentum has weakened, the overall trend remains constructive until key support areas begin to fail
Momentum conditions have cooled:
RSI is currently near 49, reflecting a notable loss of