 Long
Long
MESZ Sep 17: Bullish Above 7656 — Targets 7720, 7750 & 7770MESZ bounced strongly from yesterday’s lows and is now trading around 7,716, giving the short-term structure a bullish tone.
The first intraday pullback area I’m watching is around 7,682. If buyers defend that zone, the first upside liquidity target is 7,720.
Above 7,720, the next target is 7,750, followed by the major resistance area around 7,770.
The descending higher-time-frame trendline is still in play, so I’ll be watching carefully for reactions as price approaches those upper levels.
On the downside, 7,656 is the key level protecting the bullish structure.
Key levels: 7,682 pullback zone, 7,720 first target, 7,750 second target, 7,770 major resistance, 7,656 key support.
Bullish: hold 7,682 → 7,720 → 7,750 → potentially 7,770.
Bearish warning: lose 7,656 with confirmation → bullish structure weakens.
Not financial advice. No confirmation, no trade. CME_MINI:MESZ2026  Long
Long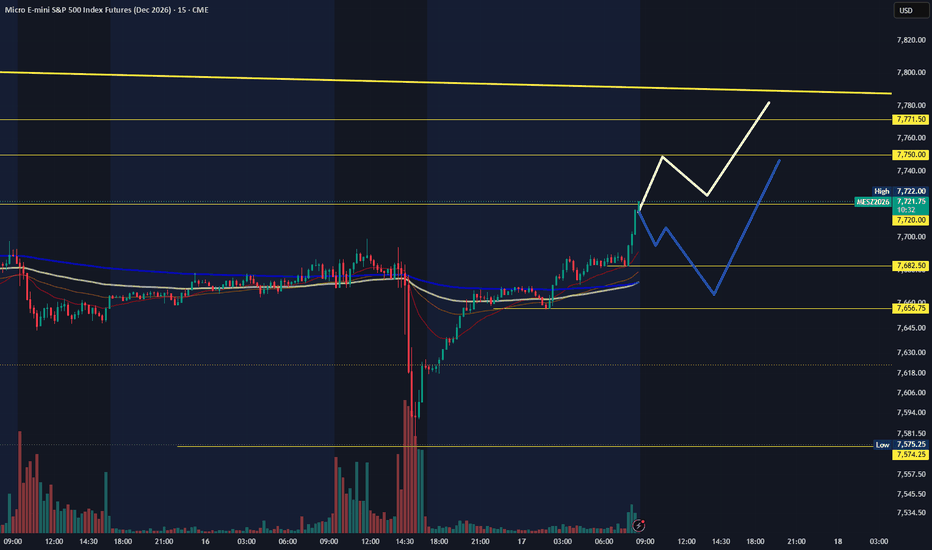
 Long
Long
 Long
Long
FOMC: What’s Next for Bitcoin?Hello everyone!☀️
Today, September 16, the main event is the FOMC meeting (US Federal Reserve), with the interest-rate decision being released today 🧨🧨🧨 The probability of a 25 bps rate hike has sharply increased to around 92% according to CME FedWatch.
And here is an important nuance going into the Fed decision ❗️
Even before the rate decision, we have already been dragged from $79,590 to $74,880, breaking through the very important $76K level.
So by the time we get to the FOMC, the market is already heavily repositioned to the downside 🐻
Therefore, if the Fed delivers exactly what is already almost fully priced in — +25 bps — BTC could see a relief move even with a rate hike.
Because the question is no longer just “Will they hike?”, but rather what they say about further rate hikes and the Dot Plot. Reuters has also pointed out that the market is particularly focused on the Fed’s forward guidance.
Let’s try to connect this event to the chart and map out the possible scenarios.
🟢🦬🚀Bullish scenario.
If $75K + the 4H EMA 200 hold the price before the meeting and BTC reclaims $76K, then the wicks we saw yesterday during the US session and today at the Asian open could turn out to be exactly the liquidity sweep I was referring to earlier:
«…we could potentially collect some decent liquidity — at $76,219 and $75,538, respectively.»
In other words, this could simply be a shakeout of weak hands ahead of the event.
For the bullish scenario to gain strength, I would then want to see BTC reclaim and consolidate above the midpoint of the trading range at $78K.
🔴🐻🪓Bearish scenario.
If $75K + the 4H EMA 200 break before the meeting, the structure becomes significantly weaker, and the chart will likely react much more sharply to every word coming from the Fed.
🔴🔴🐻🪓🔪⚰️Bearish x2 scenario
$75K + 4H EMA 200 break directly during FOMC + a hawkish Fed. In this case, $73,300 comes into play.
Let’s see what the Fed brings us.
Peace 🌄✊🏼
⚠️ Disclaimer:
All information shared on this channel is for educational and informational purposes only and is not investment advice. The author is not responsible for your trading decisions. Always manage your risks and make decisions independently. Anyone Still Alive After Friday’s Whipsaw? What’s Next for BTC?Hey traders!🌴☀️
After Friday’s violent whipsaw🧨⚰️🔪🪓⚰️, when Bitcoin, within a single 4H candle, first swept liquidity around the upper boundary of the range near $80K and then immediately dumped toward the lower boundary, printing a low at $76,030, BTC managed to stabilize over the weekend around $77K — slightly below the $78K level, which is the midpoint of the current range.
In my previous post, right before the move started, I wrote:
“If we break above the resistance cluster — 4H EMA100 + local trendline + the $78K horizontal level — there is a high probability that we’ll see yet another (already the 9th) attempt to attack the $80K level.”
Technically the $80K target was hit almost perfectly✅🎯
What I obviously couldn’t predict was that the entire move would turn into such an explosive pump and dump within the same 4H candle
What’s happening on the chart right now?
At the moment, we’re seeing an attempt to reclaim and hold above $78K.
This level has been the cornerstone for BTC since August 21🛡️🛡️🛡️
🦬🚀If bulls manage to establish a solid hold above $78K, the next target is $80K.
🐻🔪If we break and hold below $78K, bears will likely try to push the price back toward $76K.
Until we see a confirmed breakout and hold above $80K or below $76K, I expect these swings to continue, with control shifting between bulls and bears.
Sometimes this can happen several times a day, and sometimes even within a single 4H candle — exactly what we saw on Friday.
I’m not going to repeat the 📉📈outlook from my previous post today, as I think everyone already understands the logic behind this range.
❗️❗️❗️But there’s one important thing to remember:
When “everyone understands the logic,” that’s exactly when the market tends to make its strongest moves against that logic — and against all the beautiful technical analysis on the chart.
Peace 🌄✊🏼💰
⚠️ Disclaimer:
All information shared on this channel is for educational and informational purposes only and is not investment advice. The author is not responsible for your trading decisions. Always manage your risks and make decisions independently.  Long
Long
GBPCAD bullish trade setup!After significant retracement, price is bouncing back from a strong rising trendline, and at it's vicinity price has consolidated and had formed a nice setup, which has high chances of playing out in the bullish direction.
The level of 1.8700 was neckline and it's above the bearish trendline, after multiple attempts price finally gave breakout above it and currently continuing in the bullish direction, pullbacks would be the ideal opportunities for long trades, we are expecting the target 1.8829 on immediate basis and could even go till the levels beyond it.
Immediate strong support is at 1.8649, the biasness for the upcoming week is expected to be on the side of bulls, long trades would have high accuracy.
For Educational Purposes only, Not an Investment Advice, Always use strict Risk management measures.
Regards CrazyTrades247.
BTCUSDT: Range-Bound Below Resistance, Watching for a BreakdownHi!
Bitcoin is currently trading at $77,302 after rejecting the $82,000 supply zone that capped the early-September rally. Price has been consolidating inside a well-defined range between roughly $76,000 and $80,500 for the past two weeks, and the recent price action suggests sellers are starting to gain the upper hand.
The move from the $63,000 base in late August was sharp and impulsive, pushing straight into the strong daily resistance zone near $82,000–$83,000. That rejection has kept price confined to the current range, with lower highs forming since the September 5 spike. Price is now trading just below the 100-period SMA ($78,674), which is acting as dynamic resistance and reinforcing the range ceiling.
Key Levels
Resistance: $80,500–$82,500 (range high/daily supply zone)
Range support: $76,000–$77,000
Downside target/demand zone: $68,000–$69,500 (prior breakout base)
Trade Idea
The bias here is bearish-conditional: as long as price holds inside the range, this remains a wait-and-watch setup. A confirmed 4H close below the $76,000 range low would open the door for a short entry, with the $68,000–$69,500 zone as the primary downside target.
Invalidation: a reclaim and hold above the range high ($80,500) would negate the bearish setup and shift focus back toward retesting resistance.  Short
Short
Head & Shoulders in Gold before US CPIStory
Gold is testing the neckline of a head-and-shoulders top just hours before Friday's US CPI report.
A stronger-than-expected August jobs report has already pushed the odds of a Federal Reserve rate hike next week above 70%, a day after the European Central Bank delivered a hike of its own. A hot inflation print could tip gold through the neckline, though the volatility it brings may tempt bullish traders to buy the dip soon after.
Technicals
Gold's chart is telling the same story as the calendar: a decision point.
The pattern's head formed near $4,700, flanked by shoulders around $4,450=54500, with the neckline running through the $4,300 area where price now sits. Momentum has already been fading into the print, with the RSI hovering just below 50.
A CPI number strong enough to cement next week's hike would hand the dollar another leg higher and gold a reason to break that neckline, opening a path toward $4,200 and perhaps the lows at $4000.
Or a Dip Worth Buying?
Not every trader will read a break the same way.
A hawkish surprise tends to bring a burst of liquidity and volatility around the data release, and some bulls might use exactly that spike to buy gold at its cheapest level in a month rather than chase it lower.
A soft CPI number would flip the script entirely, easing the pressure on the Fed and giving gold room to reclaim $4,400 and retest the right shoulder of the pattern.  Long
Long
Don’t Underestimate a Bounce from Thin AirHello traders! ☀️
In several of my latest posts, I mentioned that “Failure to hold above $78K would weaken the bulls’ position and could quickly send price toward the lower boundary of the range at $76K.”
Unfortunately for the bulls, they failed to hold the level🪓🪓🪓, although on Tuesday and Thursday, judging by the bounces from the level and the candles with long lower wicks, the bulls were clearly trying hard to defend it 🏋🏽
Once the level broke, we got exactly the acceleration toward the lower boundary of the range that I mentioned earlier. Bitcoin printed a local low at $76,440, falling just $440 short of the $76K boundary.
What’s happening on the chart right now?
At the moment, we can see an attempt at a reversal in the middle of nowhere)
Why “in the middle of nowhere”?
Because the 4H EMA200 is significantly lower, the lower boundary of the range is at $76K, and the previous two local lows — where we could potentially collect some decent liquidity — are at $76,219 and $75,538, respectively.
So right now, we’re basically bouncing off thin air.
🦬🚀Bullish scenario.
A breakout above the resistance cluster — 4H EMA100 + local trendline + $78K horizontal level.
If that happens, there is a high probability that we’ll see another — already the 9th — attempt to attack the $80K level.
🐻🪓Bearish scenario.
The bounce off thin air fails, and we head down to collect liquidity first at $76,219, followed by $75,538.
The way price breaks through $76K and these levels should give us a better idea of how deep the move could go — and whether we will see a deeper move at all.
⚠️ Disclaimer:
All information shared on this channel is for educational and informational purposes only and is not investment advice. The author is not responsible for your trading decisions. Always manage your risk and make decisions independently. Bitcoin - Bart pattern will send BTC back to 65k (must see!)The price of Bitcoin has been forming a bart pattern, as you can see on the chart. What does it mean? The Bart pattern sometimes occurs on Bitcoin for specific reasons. - Bitcoin is very volatile, and these drops are very common. For those who are new in the crypto space or are unfamiliar with this pattern - bitcoin pumps, then makes a sideways price action, and then dumps back to the start of the pump at least. In this case, it's 65k or so. Will we see Bitcoin at 65k? There is a pretty big chance that yes. Will this be a great buying opportunity? Probably yes, the bear market probably ended, so buying at 65k is a lifetime opportunity!
September is statistically the worst-performing month for Bitcoin with an average negative return. These stats can scare institutions and big players, so a drop is pretty much expected. From the Elliott Wave perspective, I see a completed impulse wave 12345, so a correction is welcome. Will Bitcoin drop to 65? Maybe not that much, strong levels are also 70k. And then we have a strong buying zone between 70k and 65k. Let me know in the comment section what support you are buying BTC.
What about ETH and altcoins? Of course the drop will affect all coins, but some of them will do better. It's always risky holding altcoins when we expect a bigger drop on BTC.
Write a comment with your altcoin + hit the like button, and I will make an analysis for you in response. Trading is not hard if you have a good coach! I am very transparent with my trades. Short 
Long 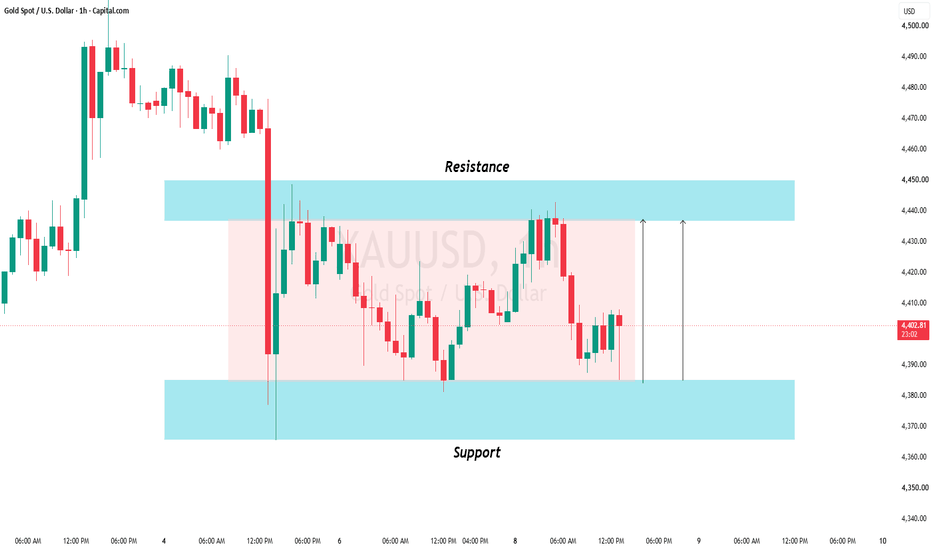
PancakeSwap Broke Its Pattern — Now It Needs to Prove ItA breakout tells you where the market wants to go. A pullback tells you whether it means it.
Before the chart, a quick word on the asset itself.
CRYPTO:CAKEUSD PancakeSwap is one of the highest-volume decentralized exchanges in the market, built primarily around CRYPTOCAP:BNB BNB Chain but now operating across multiple networks.
Its strength lies in throughput: extremely low transaction costs, deep retail liquidity, an aggressive fee-burn mechanism on CAKE, and a full ecosystem beyond simple swapping — perpetuals, liquidity provision, and prediction markets.
The weaknesses are just as honest.
The protocol remains heavily dependent on BNB Chain activity, a large share of its volume is retail and speculative rather than institutional, and emissions history has left CAKE sensitive to supply pressure despite the burn model.
In short: high activity, but cyclical demand.
That makes CRYPTOCAP:CAKE CAKE a chart that responds fast when DEX volumes wake up — and fades just as fast when they cool.
The Technical Structure
On the 4H chart, price completed a strong impulse leg and then contracted into a symmetrical triangle.
That compression resolved to the upside with a sharp expansion candle .
But notice what happened next.
Price did not follow through. It gave back most of the breakout candle and is now resting.
This is a pause, not a failure. Markets rarely move in one continuous push — they expand, exhale, and then decide.
The Setup
We are not chasing this.
The plan is to let price return to the Support Area (Pullback) around 1.72 – 1.78, which was the triangle's upper boundary before the break.
What we need there is confirmation, not hope:
A clear rejection wick from the zone
A bullish engulfing or reversal candle on the 4H close
Visible loss of downside momentum
If the market gives us that reaction, the setup becomes valid with a well-defined risk.
Pattern Target: 2.04 (100% measured move)
Mid-Term Target: 2.27 ( 161.8% extension)
Invalidation Level: 1.64
If price closes below 1.64, the entire triangle structure has failed and the idea is finished.
No adjusting, no averaging down. We step aside and wait for the next clean structure.
Right now, the correct position is observation.
Risk Warning:
This analysis is provided for educational purposes only and does not constitute financial advice. Cryptocurrency markets are highly volatile. Always use defined risk and proper position sizing.  Long
Long
Possible rejection at 7777 — stay alert!Hey traders! 🐻🦬✊🏼☀️
The range identified in the previous posts remains fully relevant, and price continues to react very predictably around its boundaries. The scenario I outlined earlier —
holding the 7625 level✅,
breaking the local trendline✅,
and then accelerating toward 7777 — also played out almost perfectly, with price reaching a peak of 7773✅
Today, I’ll continue building out the possible scenarios based on the boundaries of this range: 7625 on the downside and 7777 on the upside. Why break something when it’s working?
🦬🚀Bullish scenario.
We are now approaching the upper boundary of the trading range at 7777. A breakout and successful hold above this level could open the way toward the previous ATH at 7822, followed by the measured move target around 7950.
🐻🪓Bearish scenario.
Take a look at how many times price has been rejected from the 7777 level since August 5 🪓🪓🪓 The resistance here is clearly significant, and there are no guarantees that this attempt will be the one where we finally see a genuine breakout and acceptance above the level.
If price gets rejected once again, the initiative could shift back to the bears, with a high probability of another move toward 7625 — similar to what we saw from August 28 to September 1.
If the bulls fail to hold 7625, the scenario I mentioned earlier also remains in play: we could see a drop toward 7555. And this is where the bears will really have to work, because 7555 is a concrete wall — price has repeatedly slowed down around this level when approaching it from below.
Peace! 🌄
⚠️ Disclaimer:
All information shared on this channel is for educational and informational purposes only and is not investment advice. The author is not responsible for your trading decisions. Always manage your risks and make decisions independently. A Boringly Predictable $76-80K Range… Until Today’s U.S. SessionHey traders! 📈💎☀️
I haven’t updated my outlook for the past few days because I was taking a break from the charts and enjoying some time in the mountains 🏔️
In all of my recent posts, I’ve been talking about the ongoing consolidation within the $76K–$80K range and the importance of the bulls building a solid base around the current levels before attempting another leg higher and turning this parabolic move into a more technically structured uptrend. 🛡️🛡️🛡️
Since my last post on Saturday, Bitcoin made an attempt toward the upper 📈 boundary of the range, reaching a high of $79,394 on Sunday, followed by a move toward the lower 📉 boundary, with a low of $76,219 on Wednesday.
In other words, nothing particularly interesting happened until the opening of today’s U.S. session…🚀🚀🚀
What’s happening on the chart right now?
🦬🚀As I mentioned earlier, an impulsive break above the $78K level, followed by a breakout above $80K, would almost certainly send the price toward a breakout above the local high at $81.5K and potentially toward the $82.5K level.
That scenario is playing out right now. We’ve broken above $80K, and we could very well see $82.5K in the near future.
🐻🪓However, keep the bearish scenario in mind when making trading decisions:
If the current breakout above $80K turns out to be a fakeout, price could quickly fall back toward the middle of the range at $78K. Failure to hold $78K would weaken the bulls’ position and could quickly send price toward the lower boundary of the range at $76K.
Peace! 🌄
⚠️ Disclaimer:
All information shared on this channel is for educational and informational purposes only and is not investment advice. The author is not responsible for your trading decisions. Always manage your risks and make decisions independently. Long 
MESU Sep 3: 7695 Break Could Target 7706–7715MESU is trading near 7,695 after a choppy overnight session, and my short-term bias remains neutral to slightly bullish.
The first intraday confirmation level I’m watching is 7,695.
A confirmed 15-minute close above that level could support continuation toward the first upside liquidity around 7,706.
If buyers can break and hold above 7,706, the next upside target sits around 7,715.
On the downside, yesterday’s low around 7,618 remains an important higher-time-frame liquidity level.
The deeper 7,583 level from yesterday also remains on the chart as a longer-term downside area that could still be revisited in the future.
Key levels
7,695 — bullish confirmation
7,706 — first upside liquidity
7,715 — next upside target
7,618 — yesterday’s low / downside liquidity
7,583 — deeper higher-time-frame target
Bullish scenario: Confirmed break above 7,695 → target 7,706 → potential continuation toward 7,715.
Bearish scenario: Failure to hold the current structure could bring lower liquidity back into focus, with 7,618 remaining the larger downside level.
For now, I’m staying neutral to slightly bullish and waiting for confirmation instead of chasing price.
Not financial advice. No confirmation, no trade. CME_MINI:MESU2026 Long 
MESU Sep 2: Can 7624 Support Push Price Toward 7673?MESU tested the 7,624 level overnight and has shown an initial reaction from buyers, leaving the short-term outlook neutral to slightly bullish.
The main confirmation level I’m watching is 7,647.
A confirmed 1-hour or 4-hour close above 7,647 would strengthen the bullish structure and could support continuation toward the next upside liquidity around 7,673.
On the downside, 7,624 remains the key level protecting the bullish scenario.
A confirmed break and close below 7,624 would weaken the current bounce and could open the door toward the deeper higher-time-frame level around 7,583.
Key levels
7,647 — bullish confirmation
7,673 — upside liquidity target
7,624 — key support / bearish trigger
7,583 — deeper downside target
Bullish scenario: Hold 7,624 and reclaim 7,647 → target 7,673.
Bearish scenario: Lose 7,624 with confirmation → target 7,583.
The 15-minute structure is showing early bullish strength, but I still want confirmation from the 1-hour or 4-hour chart before becoming more aggressive.
Not financial advice. No confirmation, no trade. CME_MINI:MESU2026 Long 


