AES Corporation - Short term view with strong supportSo first of all both price and indicators are confirming the downtrend.
Today NYSE:AES opened with a gap succeeding yesterday's equilibrium in price with doji candles.
The price is still in the middle of the regression line and in the next few days the price don't seems to be close to upper 2 SD.
In the print above the yellow line shows the support at $11.43. The image's time horizon starts at the end of 2006.
Furthermore looking at short ratio available online the value is about 2,7 from
Doji
Short term trading : Be carreful of this candlestick config !!!You can acknowledge with me the absolutely astonishing XRP perf but when it's too nice to be true, a pull back does occur at some point. Please consider this not as a financial advice but educational content
Take care _
Do sport _
Take profit _
Top 3 Must-Know Candlestick Patterns for BeginnersGet your cup of coffee or tea ready we are doing a crash course on Candlesticks today
I’m walking you through three candlestick patterns every beginner trader should know—Doji, Engulfing Candles, and Hammers (including the Inverted Hammer). These patterns are super helpful when you’re trying to spot market reversals or continuations. I’ll show you how to easily recognize them and use them in your own trades. Let’s keep it simple and effective.
Key Takeaways:
Doji: Indicates indecision, poten
SPY LOVERS ! NEW ALL TIME HIGHS But be very careful ! Check hereFINALLY HERE ! NEW ALL TIME HIGHS !
But wait!!! do you really Trust those 2 last Dojis ?
Here are 2 quick scenarios to analyze for the week:
Scenario #1 (Green Line): The price may pull back to bounce off the order block zone I have marked in white, which we know as the institutional block where there was a lot of liquidity.
I call this pattern in my trading system "N3" as it consists of 1 breakout + 1 pullback + 1 trend decision.
Scenario #2 (Red Line): Always considering our active ord
The Art of Candlestick Trading: How to Spot Market Turns EarlyBuckle up, TradingViewers! It's time to unravel the ancient secrets of candlestick patterns. Originating from an 18th-century Japanese rice trader, these patterns aren't simply red and green elements on your trading charts—they are the Rosetta Stone of market sentiment, offering insights into the highs and lows and the middle ground of buyers and sellers’ dealmaking.
If you’re ready to crack the code of the market from a technical standpoint and go inside the minds of bulls and bears, let’s li
Bitcoin at Crucial Resistance Level with Doji Candle FormationDaily Chart Overview: $Bitcoin is currently facing strong resistance around the $65,000 level, as indicated by the formation of a Doji candle on the daily chart. This pattern often signals market indecision and suggests that the recent bullish momentum may be weakening.
Technical Indicators:
Relative Strength Index (RSI): 57.25 – While buying pressure has moderated, it remains at a healthy level.
Supply Dynamics: With 19.75 million BTC in circulation out of the 21 million maximum supply, Bitco
SWING IDEA - ROSSARI BIOTECHConsider a compelling swing trade opportunity in Rossari Biotech , a leading specialty chemicals manufacturer in India, renowned for its innovative and sustainable solutions across various industries.
Reasons are listed below :
Price at Support Zone : Rossari Biotech is trading at its support zone, where it was initially listed, indicating potential buying interest and stability at these levels.
Doji Candle Formation : A doji candlestick pattern has formed, confirming the bullish momentum
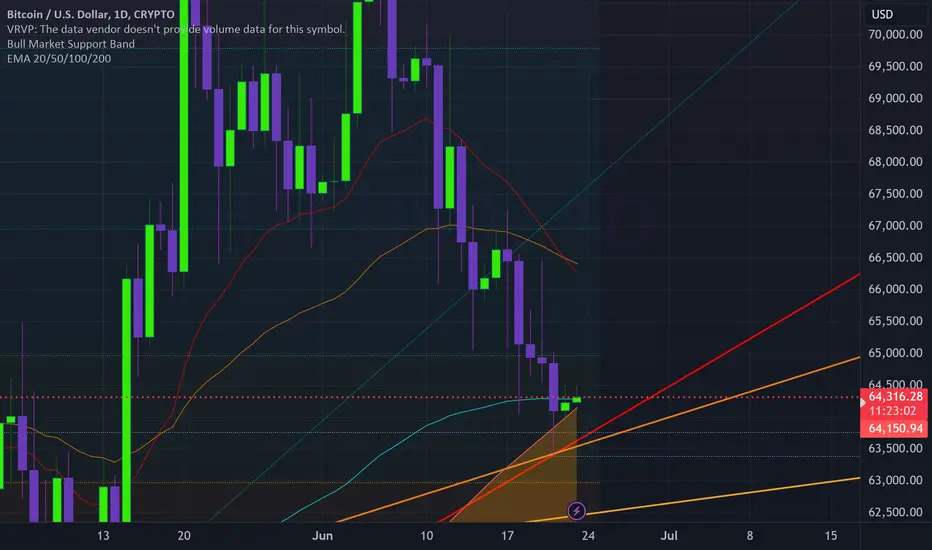
LONG! Bitcoins hit current support - BTC ready for up trendBTC has confirmed support on the daily, We have alot of market indecision and have had sideways price movement testing our bull market support.
As investors pre [are to liquidate and take up short positions BTC has failed to experience any confirmation, volume.
Without volume to confirm the price direction when the price has fallen below support the Price has recovered on all charts up to daily with backtest
We have the appearance of a Morning star Doji candle on the daily with the b
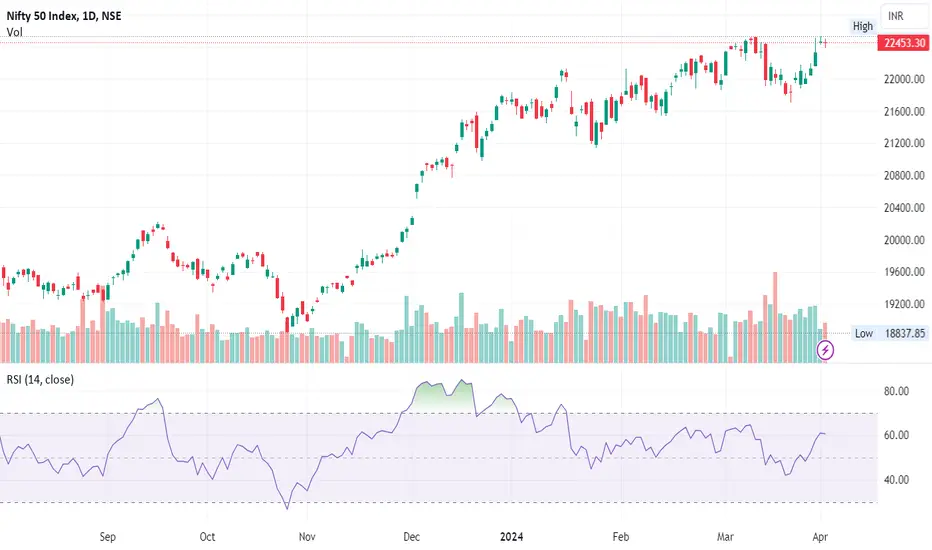
NIFTY DAILY - 2/4/2024Nifty open flat and made days high 22497 level buy didn’t sustain that level.
Index has formed another Doji candle on the daily chart at the top of the market which indicates thug of war between buyers and sellers as today’s closing was near the opening levels.
So, further levels for nifty will be 22336 will work as support level and 22520 will work as resistance level.
Today’s Advance Decline ratio of NIFTY50
Advance - 28
Decline - 22
FII Sell – 1622.69 crore
DII Buy + 1952.72 crore.
⚠️
NIFTY DAILY - 20/3/2024Nifty open higher but bulls didn’t survive into the market and traded range bound for entire session.
Nifty has formed Doji candle on a daily chart which indicates thug of war between buyers and sellers.
Double moving averages is giving cross down, we may see weakness into the market.
If the Nifty index is at a low point and if the market opens positively the next day and maintains stability at current levels, there's a chance that the downward trend could shift, and prices could start ris
NIFTY DAILY - 5/3/2024Nifty open with negative note and rangebound throughout the day.
Nifty has formed another Doji candle on daily chart, which indicate indecisiveness among bulls and bears.
Index find immediate support at 22303 level and resistance will be 22520 level.
This suggests caution and the need for careful decision-making in the current market environment.
⚠️ Important: Always maintain your Risk & Reward Ratio.
✅Like and follow to never miss a new idea!✅
Disclaimer: I am not SEBI Registered Adviso
NIFTY DAILY - 4/3/2024Index open with positive note and made all time high that is 22440.
Index has formed Doji candle on the daily chart at the top of the market which indicates thug of war between buyers and sellers as the closing was near the opening levels.
We may see trend reversal in near future.
Next levels for nifty will be 22520 upsides and 22303 level downsides.
⚠️ Important: Always maintain your Risk & Reward Ratio.
✅Like and follow to never miss a new idea!✅
Disclaimer: I am not SEBI Registered A
Monthly on btcusd.January ended with a Doji candle, a symbol of uncertainty and often when seen on the tops a prelude to reversals. But for a reversal of the trend, confirmation will be needed and we know that the underlying trend is bullish, so in this context we can use the doji candle to understand whether it will make a retracement or not, using the highs and lows of the candle. For the February or March candles, a closing below the minimum should be seen as a retracement signal because to reverse the underly
BTC DOJI on 1M 3M 6M possible reversal signalLong Legged Doji signifies the market reaching an equilibrium with a possible reversal to follow.
We've also received our allotted 5 months of green candles, which generally is the max for an impulse on the monthly.
Simple idea here, will update the other timeframes.
Not financial advice
Do your own DD
Most Powerful Candlestick Patterns Candlestick patterns are like building blocks in understanding how the stock market behaves and how prices might change. Knowing about these patterns can really help you make smarter decisions when trading.
I. Introduction to 35 Candlestick Patterns
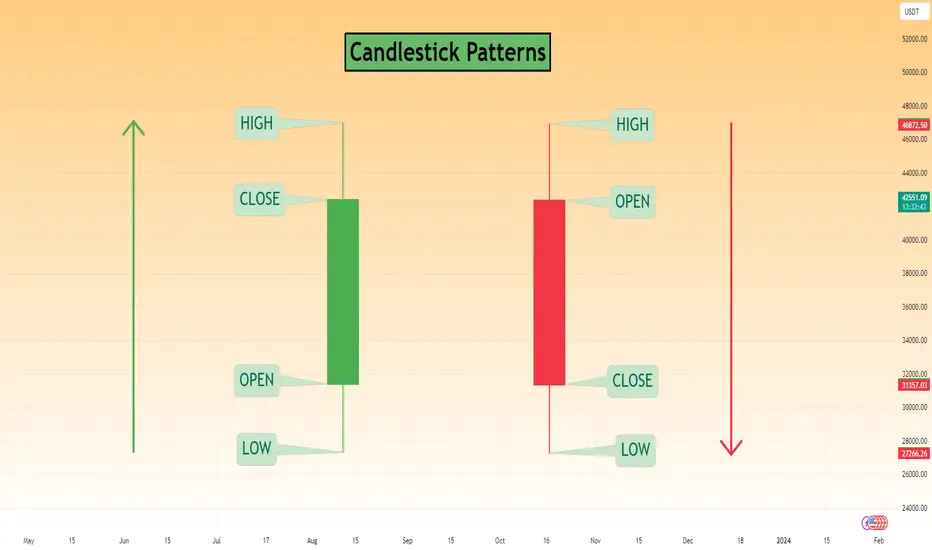
Candlestick patterns are visual representations of price movements within a specific time frame. Each candlestick represents the opening, closing, high, and low prices for that period.
The body of the candlestick is the difference between th
Mastering the Art of Trading Doji Candlesticks in Forex 📈🕯️
✅Introduction
=================
In the world of forex trading, the use of candlestick patterns is an essential tool for analyzing and predicting market movements. Among these patterns, the doji candlestick holds a special significance due to its potential to signal market reversals and trend continuations. In this article, we will explore the characteristics of doji candlesticks, their significance in forex trading, and strateg
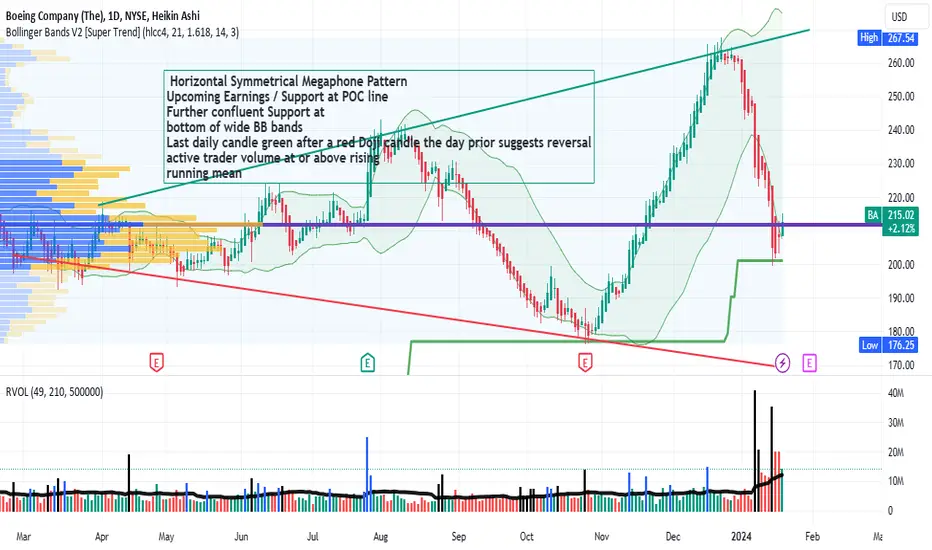
Is Boeing a buy before earnings? LONGThis is a daily Boeing chart with the idea on the chart in the text. There may be a good entry
before earnings using a stop loss under the POC line and an ultimate target of the projected
trendline resistance at $280-$300 if all goes well fundamentally with an FAA investigation
and its sequelae. A megaphone pattern demonstrates increasing volatility in price action which
is something some traders take to the bank. My analysis is that this may be a safe swing trade
until the report of th
Learn Profitable Doji Candle Trading Strategy
In the today's post, I will share my Doji Candle trading strategy.
This strategy combines the elements of multiple time frame analysis, price action and key levels.
Step 1
Analyze key levels on a daily time frame.
Identify vertical and horizontal supports and resistances.
Here are the key structures that I spotted on on AUDUSD.
Step 2
Look for a formation Doji Candle on a key structure.
This rule is crucially important: we will trade only the Doji candles that are formed on key
TSLA Trendline RetestTSLA breakout failed to end the year but is now currently backtesting the trendline. It's been surfing the 200 EMA, and If that holds, this seems like a great risk reward spot to go long. A red to green open would provide a great entry. 5 straight days down and then a doji candle smells like a possible reversal as well. Initial Targets $250 $265