Long
Long
 Long
Long
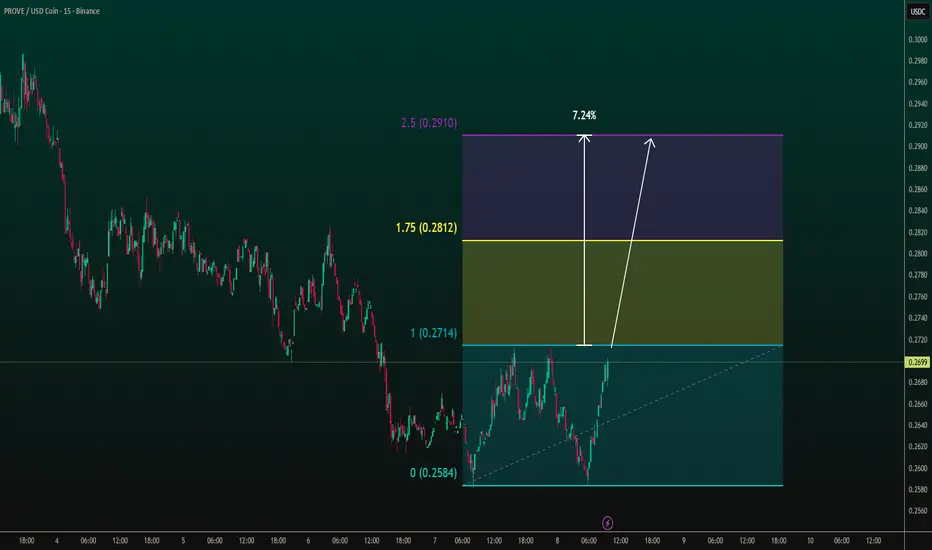
BTC Bullish Short term trendBullish 1H double bottom case: Recent dip formed twin lows near 74,000–74,100 (classic W-pattern), neckline breakout already occurred with green candles confirming reversal. Volume likely increased on second bottom test + bounce. Targets neckline projection to ~76,000–76,400 (measured move from pattern height).
4H retest of 76,400: Strong momentum from lower support (green bars dominating recent candles), holding above rising trendline / 71,100–70,800 demand zone. Bullish continuation targets 76,400 as next resistance; 4H close above 74,500–75,000 accelerates push to retest that level overnight.
Bullish if holds 74,000.  Long
Long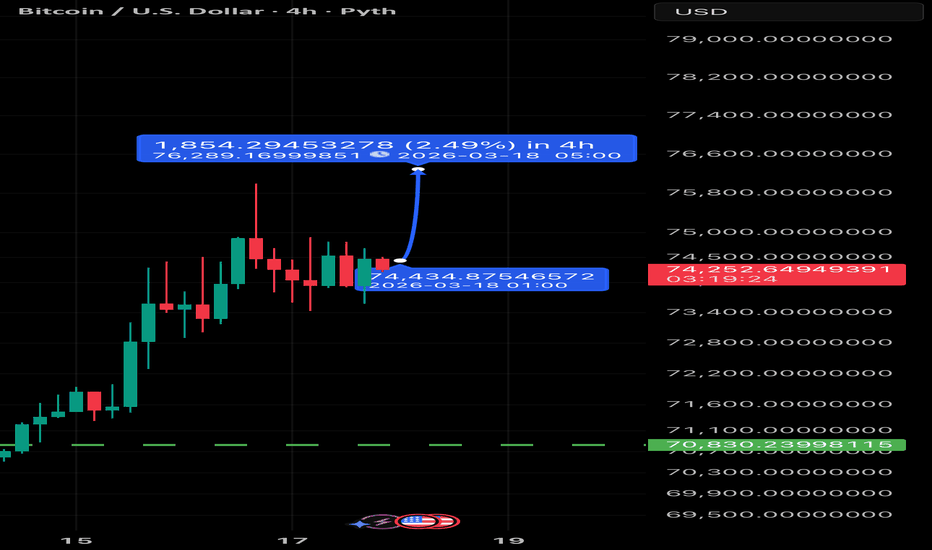
 Long
Long
#UKOIL — Cycle Update: Double Bottom Holds, $95 Target ReinforceHi guys! 👋
🔔 Since the original double bottom analysis, price action has continued to develop within the same broader technical framework — recent developments have not altered the primary thesis but have materially strengthened it on both technical and fundamental grounds.
🔔 The critical static support zone at $68.4 – $69.2 was directly tested on February 24, 2026. Despite sustained dynamic resistance from the upper band of the parallel channel capping price since February 20, buyers responded decisively at the $69 level, pushing price sharply higher — a rebound characteristic of institutional demand rather than speculative positioning.
🔔 The upper band of the parallel channel has been tested consecutively between May and June 2025, confirming the channel remains a valid and active structure.
🔔 On the weekly chart, Brent continues to trade within a falling wedge corrective structure following the ABCDE sequence. The upper band of the wedge has been tested twice as support and held on both occasions — a pattern historically associated with trend exhaustion and bullish resolution.
🔔 The SMA100 and SMA51 on the weekly timeframe are converging. Their crossover has historically marked the onset of the next major trend direction with precision. A new cross appears imminent and, if confirmed, would provide high-conviction lagging validation of the reversal thesis.
🔔 On the fundamental side, the IRGC has announced the closure of the Strait of Hormuz amid the US-Israel military action during Nuclear Deal negotiations. The strait carries 20 million barrels per day — approximately 20% of global oil supply and 27% of all seaborne oil trade. Iraq, Kuwait, and Qatar have no bypass alternatives, leaving close to 14 million b/d structurally exposed to disruption.
🔔 OPEC+ agreed to raise output by 206,000 bpd from April 2026 — a figure representing roughly 0.2% of global daily consumption. In the context of a potential 20 million b/d Hormuz disruption, this is a diplomatic gesture rather than a meaningful supply intervention. Internal non-compliance and the direct involvement of founding members Iran and Iraq in the current conflict raise serious doubts about the alliance's cohesion going forward.
🔔 The US is expected to attempt market stabilization via Venezuelan oil flows, but markets will price the risk premium well before any policy resolution takes effect.
🔔 Escalation risk remains elevated. The Islamic Republic has formally declared war, and the probability of further regional involvement is significant. A sustained supply shock of this scale could represent the most severe oil market disruption since 2022.
Bias : Bullish above $69
Primary target : $95 – $95.7 measured move
Key resistance levels : $72.5 → $77 → $86.5
Invalidation : Sustained breakdown and weekly close below $68.4
✊ Good luck with your trades! ✊
If you found this useful, hit the 🚀 button
Drop your thoughts in the comments below
Follow for the next update as this setup develops  Long
Long
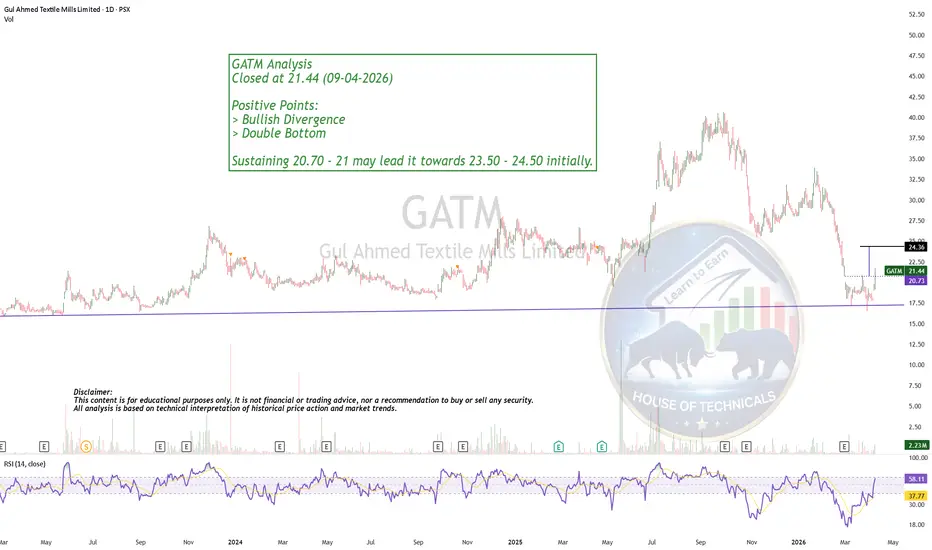
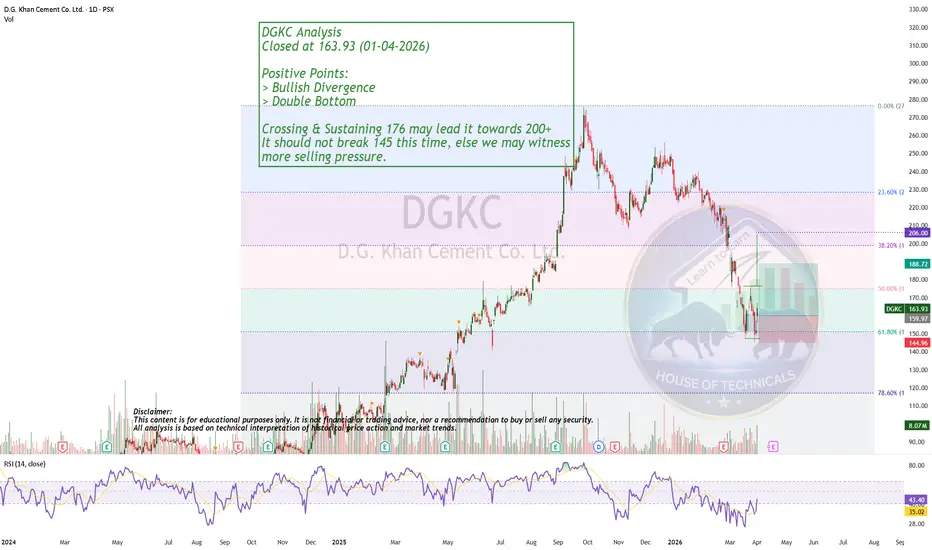
Mastering double tops and bottoms: avoid the falling knife trap!Every beginner wants to catch reversals, but most end up catching falling knives and top-ticking altcoins right before they rug your soul.
So let's talk about one of the cleanest, most classic reversal tools we have: the double top and double bottom - and what actually confirms them on crypto.
Because two bumps on the chart is not a pattern yet. It's just chaos with confidence.
What is a double bottom / double top in normal human language?
Double bottom
Picture a W at the end of a downtrend:
- Price dumps
- Makes a low
- Bounces
- Comes back to roughly the same zone
- Fails to break lower and then pushes up again
That middle high between the two lows - that's your "neckline".
Double top
Same thing upside down - looks like an M at the end of an uptrend:
- Price pumps
- Makes a high
- Pulls back
- Retests that same high zone
- Fails to break higher and rolls over
Middle low between the two highs - neckline again.
But here’s the trap everyone falls into in crypto: they see the M or W shape forming and instantly start shorting or longing. No confirmation, just pure hope, caffeine and copium.
Crypto loves to fake patterns
This market is wild. Wicks are long, volume is patchy, and whales play ping-pong with your stop loss.
So what actually confirms a double top or bottom for me?
1. Neckline break with a close
For me, the pattern is not confirmed until the candle closes through the neckline on the same timeframe where I spotted it.
- Double bottom - I want a strong close above the neckline
- Double top - I want a strong close below the neckline
Wicks through the neckline mean nothing on crypto. I want body, not just wick noise.
2. Volume backing the move
You don’t need to become a volume guru. Just ask:
- Is there more activity on the breakout than during the second top/bottom?
If yes - good sign it's real, not just a sad little stop hunt.
3. A clear prior trend
No trend - no reversal pattern.
If price was just crab-walking sideways and draws an M or W, that's not a reversal - that's just the market doodling.
Double bottom - I want a visible downtrend before it.
Double top - a visible uptrend.
4. Bonus: the retest
My favorite entries often come on the retest:
- After a double bottom - price breaks above neckline, then comes back and tests it from above, holding as support
- After a double top - breaks below neckline, retests it from below, holds as resistance
That retest, with a rejection candle, often gives a cleaner entry with tighter risk.
Where I place stops and targets
Simple version:
- For a double bottom long - stop usually goes under the second low
- For a double top short - stop usually goes above the second high
Take-profit: a classic approach is to target at least the "height" of the pattern (distance from neckline to the lows/highs) projected from the breakout.
And timeframes?
On crypto, the lower you go, the more fake stuff you see.
I trust:
- 1H, 4H, daily patterns a lot more than
- 1-minute madness on your favorite meme coin
Maybe I'm wrong, but 90% of the "double tops" people post on 5-minute charts are just noise with extra steps.
Key idea
Double tops and bottoms are not about guessing the turn.
They’re about letting the market show:
- "I tried twice - I can't go further - I'm done"
Then you step in, with structure, not emotion.
If you start training your eye to only trade the ones with:
- clear prior trend
- neckline break and close
- some volume kick
- maybe a retest
you'll filter out a ton of garbage and stop donating as much to the liquidation engine.
The market will still humble you, but at least you’ll know why - and that's already progress.  Education
Short 
 Long
Long
USD/JPY: Takaichi wipeout marks bottom ahead of US CPI?USD/JPY is trading near a double-bottom support ahead of today's US CPI release. Despite a "hot" Non-Farm Payrolls report boosting the dollar elsewhere, this pair has erased all gains from the Japanese snap election rally, driven back down to 152.00 despite Prime Minister Sanae Takaichi’s landslide victory amid renewed intervention fears.
We are watching a potential consolidation bounce from 152.00, or a breakdown if US inflation data disappoints.
Key topics covered
Takaichi wipeout : How the PM's decisive win reignited intervention fears, forcing the market to fully erase the pre-election rally. This reset to 152.00 offers a potential technical consolidation opportunity.
Fed vs. sentiment : While Fed Governor Stephen Miran warns policy is too restrictive, a hot CPI today would reinforce Wednesday's NFP data, validating the exceptionalism narrative and potentially pushing rate cuts further down the road.
Risk drivers : Why AI disruption fears and Trump's tariff rollbacks dampened risk sentiment yesterday, adding complexity to the USD/JPY outlook.
USD/JPY scenarios :
Bullish : A hot CPI validates the 152.00 support. We watch for a breakout above 153.80, targeting resistance at 154.35 and 155.60 (61.8% Fib), with a medium-term target of 157.66. A long position here offers a potential 1.7x risk-reward ratio.
Bearish : A cool CPI could break the 152.00 floor. This opens the door to 150.29 and potentially 151.87 as the next downside targets based on Fibonacci extensions.
Trade plan : Volatility will be high. We are looking at pending orders around 153.80 for the upside breakout or 153.00 for the breakdown, while being mindful of potential whipsaws.
Are you speculating on the 152.00 support holding? Share your views in the comments.
This content is not directed to residents of the EU or UK. Any opinions, news, research, analyses, prices or other information contained on this website is provided as general market commentary and does not constitute investment advice.
ThinkMarkets will not accept liability for any loss or damage including, without limitation, to any loss of profit which may arise directly or indirectly from use of or reliance on such information.  Long
Long

02/02/26 Weekly OutlookLast weeks high: $90,610.47
Last weeks low: $75,706.32
Midpoint: $83,158.39
With January of the new year wrapped up it's been quite the opening month for Bitcoin and the broader market in general.
The loss of the yearly open ($87,500) confirmed the bears remain in control and as such, with the help of an enormous crash in metals, pushed Bitcoins price back towards 2025's Yearly low of $74,500. Now in the early hours of the weekly open that exact level has been traded with a perfect double bottom on the HTF chart. Does this mean BTC is now safe to move back up?
A relief bounce may be on the cards from here, my targets would be the inefficiency zones at 0.25 ($80,000) and if the bounce has real backing maybe $86,000. However I am not yet satisfied that the April Low has been effectively traded just yet...
For more confirmation of a bottom being in I would like to see the demand zone swept with sellers continuing to pour in but buyers soaking up the volume resulting in very little price movement. In effect this would be forced sellers (liquidations) moving their BTC to high conviction buyers in the market. I am not yet satisfied that we have had this play out.
The fear and greed index sits at 14, the same score as the Covid crash but interestingly it's a higher score than the sell-off in November of last year at a score of 11. This gives us an interesting divergence similar to that of the end of the bear market in 2022. It's also significantly lower than the April low of last year at a score of 24.
This week is about seeing where/if BTC finds strength, with BTC strength alts will follow. Also Tradfi and specifically the metals market is something to keep a eye on. It's not everyday an asset loses $4T in value in 3 days like silver did! #UKOIL - Double bottom, aiming $95Hi guys! 👋
🔔Brent crude has been in a prolonged corrective phase since the 2022 highs, but price action now suggests a potential trend reversal from a well-defined long-term support zone.
🔔 The market has twice defended the $58.7 level, forming a clear double bottom structure and signaling seller exhaustion after an extended downtrend.
🔔 The first rebound occurred near the 0.5 Fibonacci retracement, strengthening the validity of the base and increasing the probability of a sustained upside move.
🔔 Key resistance levels to watch are $72.5, $77, and $86.5, each acting as a structural barrier that must be cleared to maintain bullish momentum.
🔔 A confirmed breakout above these zones opens the path toward the $95–$95.7 target, which represents the measured move of the double bottom pattern.
🔔 From a macro perspective, steady global oil demand growth and persistent geopolitical risk in major producing regions may support higher prices by sustaining a risk premium.
Bias : Bullish above $58.7
Invalidation : Sustained breakdown below the double-bottom base
✊ Good luck with your trades! ✊
• If you like the idea, hit the 🚀 button
• Please ✍️ your thoughts in the Comments section
• And follow me for more updates.
Long 
Chart Patterns ranked by reliability (1-8)Chart Patterns as a Strategy (Not a System)
In the world of technical analysis, chart patterns are often marketed as stand-alone trading systems. In reality, their real edge comes from probabilistic structure recognition, not prediction.
The key insight from my large-sample testing (10 years, 200,000+ patterns (Futures, FX)) is this:
Patterns don’t predict direction — they quantify structural bias once price has already revealed intent.
That distinction is what separates profitable traders from pattern collectors.
How These Patterns Were Tested (Why the Stats Matter)
All patterns discussed below were:
Only counted once fully completed
Required confirmed breaks of structure (trendline, neckline, or support/resistance)
Measured using objective projection rules, not discretionary targets
TP Rule: Full Head and Shoulder Height, using the Head distance and the right shoulder as the SL.
Full Height of triangles, and a full height for flags as well.
Twice the height of the Channel as TP, and Time TP for Channels, for half of the duration of the it.
Rectangles were Full Box Width as TP, and a time-based TP of 1/4 the Length.
It could be trailed further, but some such as Rectangle TP made great mean-reversion trade.
This removes hindsight bias — a major flaw in most pattern discussions.
Continuation Patterns (Trend Context Is Mandatory).
#8. Bull & Bear Flags (~67%) (Alt. Name: Cups, Volatility Contraction Pattern)
Occur after near-vertical impulse moves, typically the 50 EMA can filter the direction.
Represent temporary pauses, not reversals.
Best when:
Flag is tight
Forms near the extreme of the impulse
Volume contracts during consolidation
Professional takeaway:
Flags are trend health checks, not entries. If a flag fails, momentum is likely exhausted.
#7. Ascending & Descending Triangles (~73%)
Market compresses against a hard level
One side shows aggression, the other absorption
Breakout confirms institutional imbalance
Use them to answer:
“Is price being accumulated or distributed?”
#6. Ascending & Descending Channels (~73%) (Alt. Name: Cups & Handle)
Wide consolidations between parallel trendlines
Stronger than flags due to time + participation
Breakouts often lead to measured trend continuation
Key insight:
Channels are delayed continuation, not indecision.
Reversal Patterns (Confirmation Is Everything)
The Joker: Double Tops & Bottoms (75–79%)
Require structural failure
Completion only occurs after neckline break
Bottoms outperform tops statistically (markets rise faster than they fall)
⚠️ Common mistake:
Anticipating the second top/bottom instead of waiting for confirmation.
The Queen: Triple Tops & Bottoms (77–79%)
Stronger due to repeated rejection
Represent exhaustion of dominant participants
Interpretation:
The market tried three times — and failed.
The King: Rectangle Patterns (~78–80%)
Flat consolidation after a trend, more than 3 touches top and bottom.
Essentially failed reversal attempts.
Breakouts often trap traders positioned against the trend, it's best to enter on retest of breakout or earlier at the Bear-Bull Midline of the Box.
Critical lesson:
Most “double tops” fail — and turn into rectangles.
The Ace: Head & Shoulders (~83%)
Why it works so well:
Clear distribution → failure → confirmation
Captures institutional exit mechanics
Neckline break aligns with order-flow imbalance
Both regular and inverted versions are the most reliable classical patterns when properly confirmed.
⚠️ Common mistake: It's easy to mistake a Head and Shoulders with another pattern like a Double or Triple Bottom if it's neckline is not broken well.
The Trap Pattern: Pennants (~55%)
Despite being taught alongside flags:
Pennants break against trend too often
Over-compression increases randomness
Lack clear structural dominance, Pivot HL are spots where trader's should sell.
Professional rule:
If it looks too tight, it’s probably a coin flip.
It's better to target Equal High and Lows to the left as TP.
How Professionals Actually Use Chart Patterns
We don’t trade patterns — we trade what they imply.
Patterns help answer:
Is the market accepting or rejecting price?
Are participants trapped or in control?
Is this continuation, transition, or reversal?
They work best when combined with:
Market structure (HH/HL, LH/LL)
Time-of-day context
Volume or order-flow
Higher-timeframe bias
Final Truth About Pattern Accuracy
Pattern Type Role Best Use
Flags / Channels Continuation Trend validation
Triangles Pressure build Breakout bias
Double / Triple Reversal Failure detection
Rectangles Continuation Trap identification
Head & Shoulders Reversal Distribution confirmation
Pennants ❌ Avoid  Education