I have two options in mind: the overall trend is tuberculosis.There are about 15 sell orders, but we are in a minor buy mode. If it closes above the last high, I expect it to close above the sell zone for a short-term buy, but if it closes below the last low, you will sell on a pullback to the specified buy order block.
Economic Cycles
CRWV: A Violent Bounce, a Silent Tool - Reading It HonestlyCRWV just rallied hard off its July low - from the low 60s back above 90 in a few weeks, on high relative volume. And the structure tool watching this chart said nothing: the status panel reads NO ACCUMULATION, last signal 57 bars ago. Reading that pair honestly is today's lesson.
What the chart shows
CRWV is a young listing: a vertical advance in mid-2025, then roughly a year inside a wide, violent range. Inside that range, Structura Accumulate printed four zones - each where price was reb
Wave III?Crude Oil: Wave III?
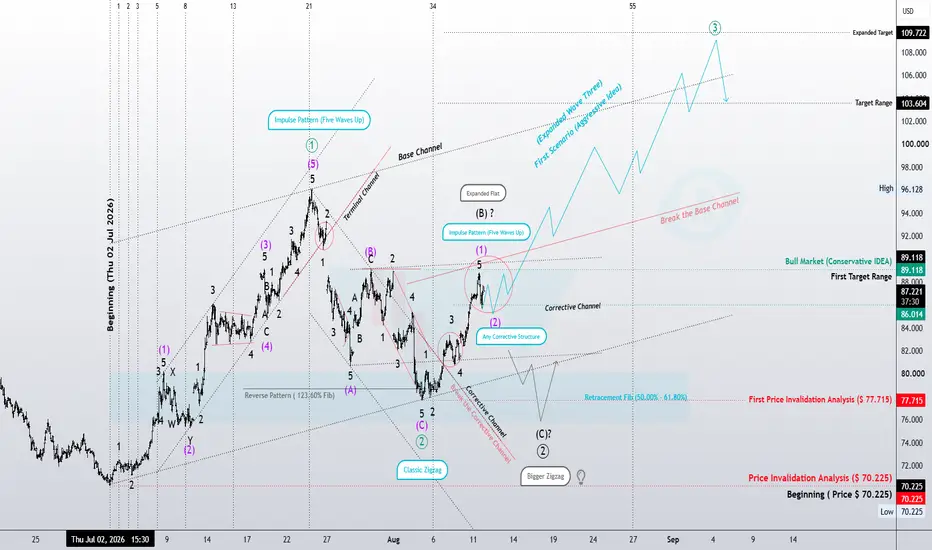
From an Elliott Wave perspective, the move from the 70.225 low to approximately 96.128 appears to have developed as a complete five-wave Impulse, which can be considered Wave (1) of a higher degree.
The market then entered a corrective phase that appears to have completed around the 77–80 area, with the structure remaining consistent with a Classic Zigzag. From this point, the primary focus shifts toward the developing bullish structure.
The recent advance from the correc
XAUUSD - SHORTGold is currently trading at a critical inflection point. After a prolonged and aggressive bullish rally, the price has reached a significant supply zone just below the $4400 psychological handle. This area represents a major resistance cluster—a confluence of historical sell-side orders and extreme overextension on the weekly timeframe.
For the recent bullish structure to sustain, the market requires a substantial fuel injection. Without a healthy pullback to clear out weak hands, the upward m
RBOB Gasoline | Is Wave III About to Begin?Under the aggressive scenario, we consider Waves (I) and (II) to represent the largest degree in the current count. Following a major correction in the previous cycle, the market entered a new bullish phase. From our perspective, the price action at the beginning of 2026 can be interpreted as a sharp and fast Classic Impulse, potentially forming Wave I of this new degree.
At present, Wave II has reached the vicinity of Wave 4 of the initial impulse. This is an important structural area and coul
CYCLE 5 QUESTIONI have been using the Nikkei comparison for one reason: not to claim that Bitcoin has to copy another market, but to understand where the current structure may sit inside a much longer cycle.
The similarity is not in individual candles. It is in the sequence.
Nikkei moved through four distinct expansion and reset phases before the final acceleration of Cycle 5. Each cycle pushed price into the same rising long term structure, followed by another period of weakness, doubt and rebuilding. The im
SHORT GOLD- We have left a lot of Low resistance liquidity back down towards Monthly FVG.
- Monthly FVG needs to get tapped.
- Yes the institutions were building their Long term positions here thus we saw this rise. Which will trap short term retail traders and hedge funds here.
- Once buyside liquidity gets taken out, a lot of retail traders will look at this as a breakout and buy here very heavily, including many large funds.
- Once a lot of liquidity has been generated, price will crash back down.
-
Crude Oil: Is a Larger Wave III Beginning?From an Elliott Wave perspective, the current structure suggests that Waves I and II of the current degree may be complete, placing the market at a critical stage.
Wave I developed as a five-wave Impulse, followed by Wave II unfolding as a corrective structure. Therefore, under the aggressive scenario, the current structure may be preparing to enter Wave III, which, if confirmed, would be expected to develop with greater strength and momentum than the initial wave.
The initial advance from the
DXY | The Diagonal Test DXY | The Diagonal Test 🌀
In this update, our focus remains on the Aggressive Scenario—a higher-degree interpretation in which the recent structure may represent either Wave (C) or Wave (III).
A closer examination of the 4-hour chart suggests that the current structure could initially be interpreted as a Double Zigzag. However, the ongoing price development also raises the possibility that the market is building a Leading Diagonal.
At this stage, the more compelling structural interpretation
Dow Jones | Is the Fifth Wave Expanding?Wave (IV) in pink, the highest degree of this structure, ended in March 2009. From that point, the market entered a structure that may be the beginning of Wave (V) of the highest degree.
In equities, an extended fifth wave is also possible. So the key question is this:
We were looking for an Impulse pattern, where V? in turquoise was expected to mark the end of the structure. But what does the equality with the initial wave tell us?
Are we dealing with an extended fifth wave, or is the curren
NQ Weekly Outlook: 10–14 August 2026The Fringe Cycles model read for the coming week suggests a mixed structure: positive early, alternating tendencies through the middle of the week, and a more negative structure developing into Thursday and Friday.
This outlook is based on the NQ Globex session, not only regular cash-session price action. Each daily bias applies approximately from 18:30 Eastern on the previous evening through 15:30 Eastern on the stated trading day. For evaluation, each daily bias is measured from the 18:30 Eas
Symmetry <Danger Zones>BTC follows Symmetry
just wait for entry signal
Price symmetry refers to comparing the size of past and current price movements to identify balance or repeating patterns.
It assumes that the market tends to make similar upward and downward moves in terms of price distance (such as wave length or correction size).
Analysts measure previous price swings and compare them with the current move to identify potential reversal or continuation points.
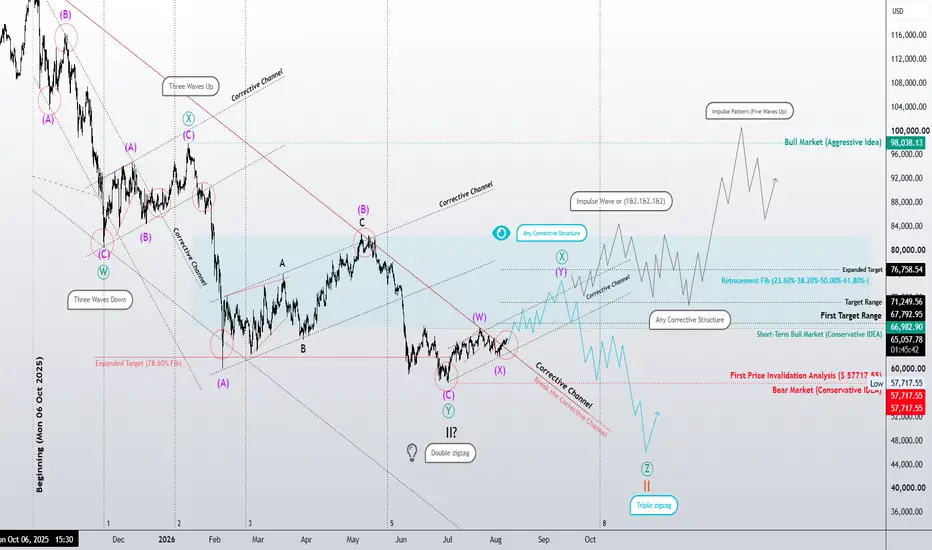
₿ Bitcoin | The Structure Must ConfirmConservative Scenario — Wave (II) Complete or Correction Still Developing?
In the Conservative Scenario, the current structure may indicate that a Double Zigzag has been completed and Wave (II) may have ended. However, this count still requires confirmation through price action and wave structure.
To confirm the completion of Wave (II), we would expect the market to develop impulsive price action—preferably a valid Impulse pattern, or structures such as a Leading Diagonal or nested 1–2 and 1–2
##Leading Diagonal Completed | What Is Silver Telling Us Next?# Silver | U.S. Dollar — XAGUSD
Following the previous analysis, the price structure has now provided us with stronger evidence.
The **Leading Diagonal** that we previously considered as one of the primary aggressive scenarios has now completed with a valid **5-3-5-3-5 structure**, remaining consistent with the rules and guidelines of the Elliott Wave Principle.
Therefore, the possibility of facing a **larger correction** from this area has become increasingly important.
The current price ac
XAUUSD | Bullish Breakout with Upside PotentialThe price has broken above the descending channel and is now retesting the breakout area as support. As long as the price holds above this level, I expect the bullish momentum to continue toward the marked resistance zone.
Entry: Current price or after a confirmed retest.
Stop Loss: Below the highlighted support area.
Target: 4839.89.
This setup is based on market structure, channel breakout, and support/resistance analysis. Always wait for confirmation and apply proper risk management.
Gold | Tracking Wave IV Before the Next Major MoveGold | Tracking Wave IV Before the Next Major Move
XAUUSD | 4H Elliott Wave Update
Based on the Elliott Wave Principle, two primary structural scenarios currently best fit the market. These represent our current interpretation of price behavior and will be reviewed as new structural evidence emerges.
In the aggressive scenario, Wave A is considered complete as a Leading Diagonal. The Base Channel has been drawn solely to evaluate the first impulsive advance of Wave B. If this structure remains