The Sun May Be Setting On EJ's Break of HighsOANDA:EURJPY has made an impressive Bullish Rally after breaking out of the Resistance that was holding price down around 183 - 183.1, but currently seems to be showing a great deal of exhaustion with a strong Bearish Reversal pattern forming, the Evening Doji Star!
The Evening Doji Star consists of 3 candlesticks:
1) Large Bullish Candle
2) Doji Candle
3) Large Bearish Candle
If Bears are able to Close this candle strong down at the Lows of the large Bullish Candle that started the pattern,
Evening Star
Evening Doji Star Forms at Weekly Resistance on UJAn Evening Doji Star is a Bearish Reversal Candlestick Pattern that consists of 3 Candlesticks:
1) Large Bullish Candle
2) Doji Candle
3) Large Bearish Candle
The Doji Candle represents indecision in the markets where the Bulls nor the Bears were able to overcome one another.
The last candle being a bearish one suggests that the Bears have successfully taken over and are looking to push price down!
This Candlestick Pattern itself is a strong indication that price is looking to reverse from th
Evening Doji Star Sets On USDCHF, Price To FollowOn Wednesday, November 5th, Price on OANDA:USDCHF rose and tested the Resistance Level that's been overhead since August. Today with the decline in price on the Daily, suggests that we are looking at a very strong 3 Candlestick Pattern, the Evening Star Doji!
The Evening Star Doji is a Bearish Reversal Candlestick Pattern consisting of 3 candles: first being a large Bullish candle, second is a Doji candle representing the indecision between Bulls and Bears then followed by the 3rd candle bein
Mastering Trend Reversals: Morning & Evening Star PatternsSo, you're trying to nail those trend reversals? The Morning and Evening Star patterns are perfect for that. They show up right when the market’s about to shift, giving you a chance to get in before the move really takes off. Let’s break down how these setups work and why they’re such solid tools for traders like you.
🌅 Morning Star Pattern: The Bullish Reversal
The Morning Star pattern is one of the best ways to catch a trend reversal from bearish to bullish. It usually pops up after a d
How to Trade Morning Star and Evening Star Candlestick Patterns Learn to identify and trade Morning Star and Evening Star candlestick formations using TradingView’s charting tools in this detailed tutorial from Optimus Futures.
Morning and Evening Stars are powerful reversal patterns that often mark turning points in the market. Recognizing them can help you anticipate when momentum is about to shift—and take advantage of new trading opportunities.
What You’ll Learn:
• How Morning Stars signal bullish reversals at the end of a downtrend
• How Evening Stars
#TAOUSDT #4h (ByBit) Ascending trendline near breakdownBittensor printed an evening doji star deviation, a retracement down to 200 MA support seems next.
⚡️⚡️ #TAO/USDT ⚡️⚡️
Exchanges: ByBit USDT
Signal Type: Regular (Short)
Leverage: Isolated (5.0X)
Amount: 5.0%
Entry Targets:
1) 430.38
Take-Profit Targets:
1) 362.01
Stop Targets:
1) 464.64
Published By: @Zblaba
GETTEX:TAO BYBIT:TAOUSDT.P #4h #Bittensor #AI #DePIN bittensor.com
Risk/Reward= 1:2.0
Expected Profit= +79.4%
Possible Loss= -39.8%
Estimated Gaintime= 1 week
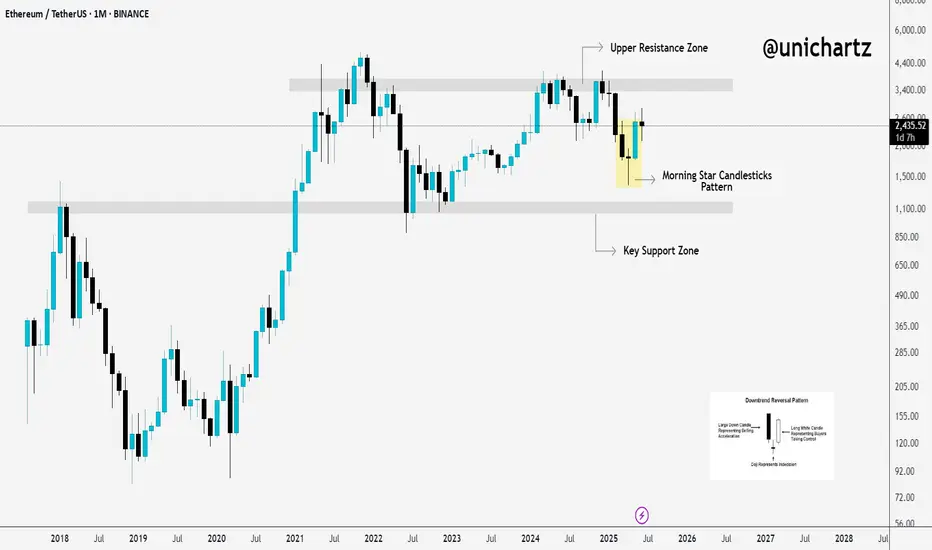
Ethereum Rebounds from Strong Base – ATH in Sight?Hello traders, here’s the CRYPTOCAP:ETH Monthly Outlook
Ethereum is flashing early signs of a bullish reversal, with a clean Morning Star candlestick pattern forming right above the $1,050–$1,200 support zone, a historically strong base.
After bouncing hard from this level, ETH is now approaching the major resistance area at $3,400–$3,800, the same zone that previously rejected upward moves.
If ETH can break and close above this resistance, we could see the start of a fresh bullish leg. Bu
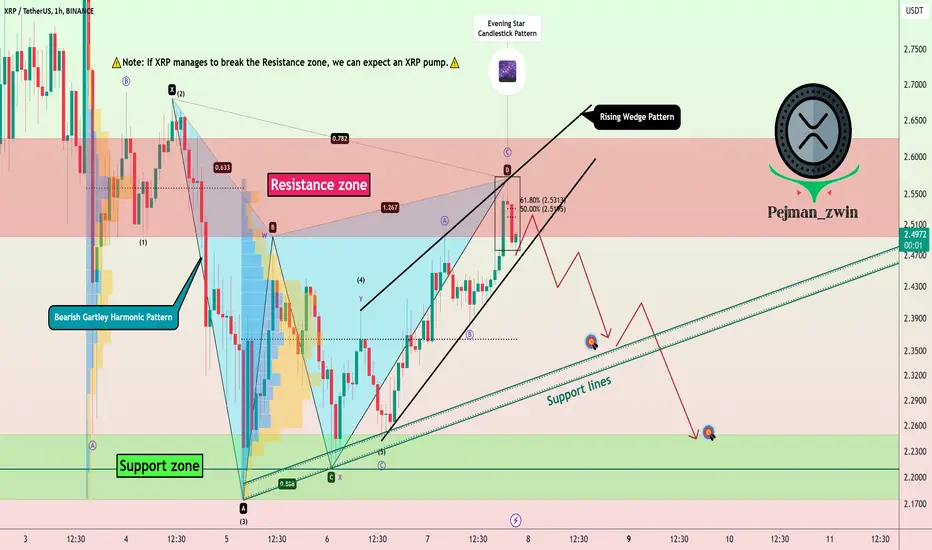
XRP Analysis==>>Correction Signs!!!XRP ( BINANCE:XRPUSDT ) is moving in the Resistance zone($2.63-$2.50) .
In this post, I want to show you some signs that XRP may still need to be corrected in a one-hour time frame :
1 -Regarding Classical Technical Analysis , XRP seems to have succeeded in forming the Rising Wedge Pattern .
2 -The formation of the Evening Star Candlestick Pattern in the Resistance zone can signify the reverse of XRP .
3 -The formation of the Bearish Gartley Harmonic Pattern can also be a
DIXON Short Setup: Evening Star & Potential HNS with Trendline Weekly Analysis
Pattern Observed: Evening Star on Weekly Timeframe
Additional Insights
- The Evening Star pattern tends to be more reliable on Daily and Weekly timeframes, making this setup particularly noteworthy for swing traders.
Trade Setup
1. Entry: Enter after a decisive break below the low of the third (red) candle in the Evening Star pattern.
- Alternatively, you may enter on the fourth candle if it signals a reversal, with a stop loss set according to your risk tolerance.
Goatseus Maximus(GOAT) Ready to FALL!!!(Alert)!!!Today, I want to analyze the Goatseus Maximus(GOAT) memecoin, which has increased almost 😱+1500%😱 in less than 12 days .
What is Goatseus Maximus (GOAT)!?
Goatseus Maximus (GOAT) is a meme coin within the Solana( BINANCE:SOLUSDT ) ecosystem, which has gained significant attention due to its AI-driven features and strong community backing. Its recent surge in price has been driven by multiple factors, including listings on major exchanges.
⚠️Regarding the GOAT memecoin , I must warn
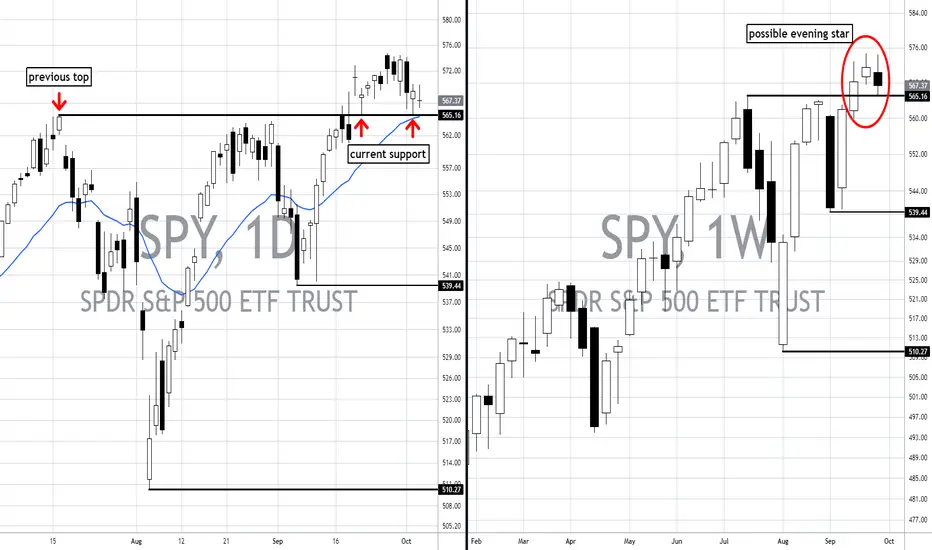
SPY: A Critical Inflection Point! (D&W charts)In our last analysis last week, we had already identified a critical support point around $565, which is once again acting as a support, as expected. However, in the light of new evidence, we have to update the central point of the idea, and draw up possible scenarios for us to work on next.
The link to our prevous analysis on SPY is below this post, as usual.
Daily Chart (Left):
Previous Top at $574.71: This level represents the recent all-time high, which has become a point of resistanc
Apollo Tyres, Bearish Reversal with Divergences & Evening StarStock : Apollo Tyres
CMP : 499
Timeframe : Monthly
Pattern : Bearish Reversal with Divergences & Evening Star
Trade Type : Short
Price Action & Technical Analysis
- Bearish Divergence
- MACD Down
- Price is below 5 Moving Average
Target 1 - Rs. 436
Target 2 - Rs. 366
Stoploss - Rs. 520
Disclaimer : "The information provided in this content is for educational purposes only. Please do your own research and consult with a professional financial advisor before making any investment or tradi
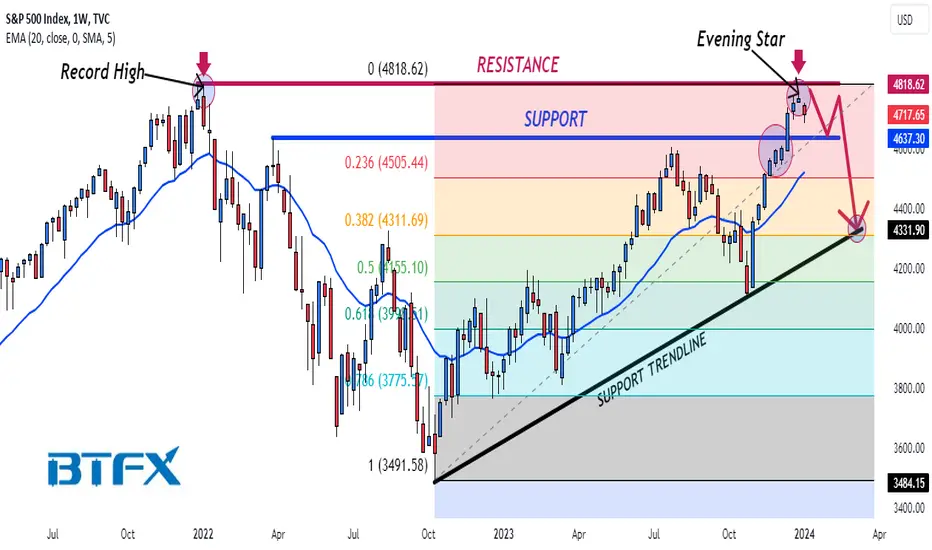
SPX Bull Run May Be OverHi Traders!
SPX looks to have fallen short of the record high, and there could potentially be a big pullback that is about to occur.
Here are the details:
There is an evening star candle pattern currently on the 1W chart, and this is the first week the market's weekly open price has opened substantially lower than the previous week's closing price in about 8 weeks.
We are looking for a pullback to test the previous resistance break at 4637.30, which is now the support, and if the market brea
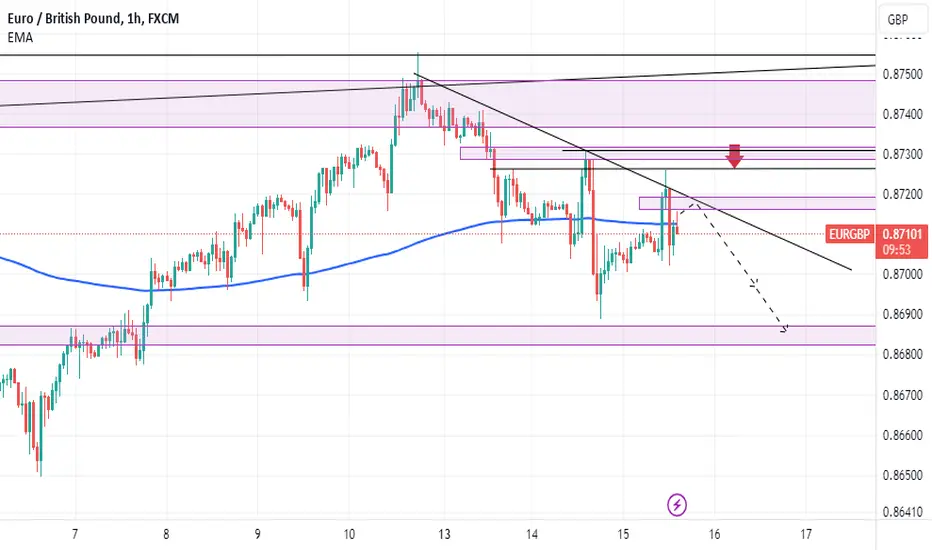
#EURGBP selling opportunityEURGBP exhibits a valid bearish market structure in the 1-hour timeframe, as illustrated in the chart. This structure begins after the price tested an important daily resistance and was subsequently rejected.
With this ongoing bearish move, we are inclined to take sell positions in this pair as long as the current structure persists.
Upon closer examination, the price tested the bearish trendline and formed a 1-hour engulfing candlestick pattern . When combined with the preceding candles, it
MSTR Evening Star Poses Whipsaw Risk"Evening stars" are not as reliable as they used to be. They occur after heavy speculation and a steep angle of ascent. A few days ahead of earnings, NASDAQ:MSTR could not break through the resistance above.
The Gap up was HFT driven. This stock has a lot of retail interest at the moment, with every eye on AI. But the selloff from last quarter's reporting season is creating resistance on the daily scales. It is a very pricey stock for this market condition and the emotional state of most inv
usdjpy reversal signal at retest highAfter a 1 hour variation of an evening star during the London session this morning, I was alert during the New York session to see if price would be strong enough to push beyond its latest high; especially after a bullish engulfing. Price merely closed off with some buy exhaustion only to followed by a doji. This set-up looks like a false break of a major resistance level which is why I decided to take advantage of the retest during the best time of the day. Although the dollar yen is still over
Shorting a Daily shooting star re-testAUDUSD provided a daily shooting star on Monday which signaled that intraday it may become bearish. This re-test is after a Bearish Engulfing was confirmed on the prior touch. The 4H failed to break beyond a monthly resistance. I took a 1H evening star short beneath resistance.
Catching Falling Knife Series= "IZMO"In this Knowledge Nugget, I have explained logic behind my own trade in "IZMO" which rallied 50% + from its swing low in just days. I am found of entering such stocks for one round of buying at support level with my own set up logic.
This is for educational purpose & please do not copy this trade without understanding risk & position sizing.
Ethereum is retracing to create its lower highIt's a great thing we're no longer fooled by big big candles being a big move. Proce closed pretty Bullish on Sunday only adding to the combination of randomness . Anytime price created a lower low, I project and expect it tush lower after a retest. This is exactly what price is doing, a reversal candlestick at a key area suggests its almost time to short. If anything price has determined where it wants to slow down. This 61.8 retracement is no surprise considering the fact that the weekly was
XAU/USD Swing Trade PlanHello Guys.
Hope you have good times and great trades too!
Today i'm going to explain why GOLD will fall to at least 1930 in coming days.
First of all as you can see in my chart we see a strong Bearish Divergence Between
RSI and price in Daily TF , that i show them with white lines.
Next , We can see a Evening Star Pattern in this strong Resistance level(2050 $).
After that we pass through 20 and 50 MA 's and according to Pullback to MA50 ,
I personally predict we can continue downside.
as you
XShort
A Four Hour Evening Star Formed at 38.2Weekly momentum may suggests that intraday momentum is bullish. Last week closed out a very strong bullish engulfing from the low of a weekly range. However The Daily is currently at a key reversal area despite its attempt to create a higher high. The 4 hour has been uptrending with high highs and higher lows despite many weak bullish candles. I believe price is relativelty close to topping out at its high for a reversal given that a confirmed evening star formed at a zone, resistance and the ma
TSLA Looks Exhausted; Flashes a Reversal SignalA few months ago, SquishTrade wrote a bearish technical analysis on TSLA that forecasted a drop to a series of targets that were all reached. TSLA's downward move was more violent and rapid than anyone may have expected. Indeed, TSLA broke down from a huge head-and-shoulders pattern. Supplementary Chart A is the head and shoulders pattern that broke through its neckline in October 2022. It backtested and chopped for a bit, then fell like a stone. What seemed to be a move that would take several