COT Net Positions - Commercials vs Large SpeculatorsOverview
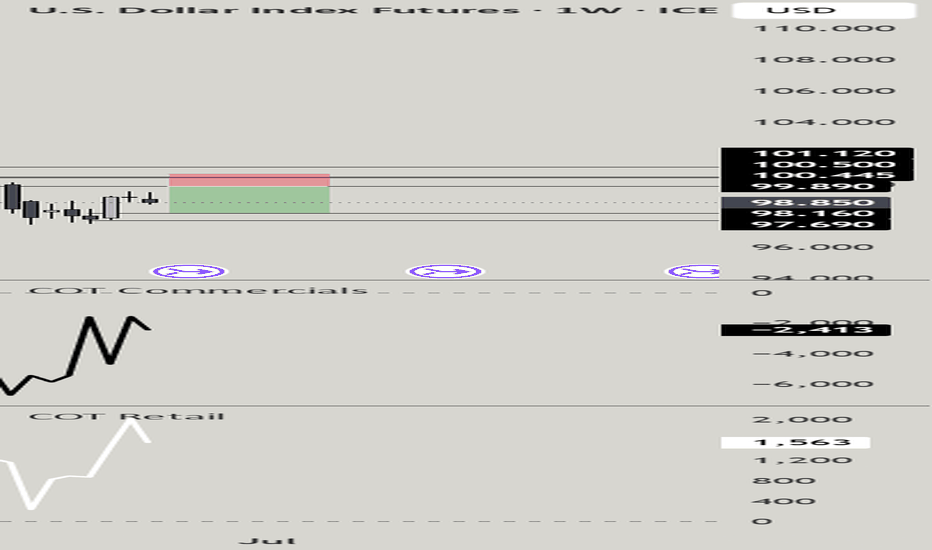
This indicator plots the net positioning (Long minus Short) of Commercial Traders and Large Speculators from the CFTC Commitment of Traders (COT) report, side by side, so you can see how the two groups are positioned relative to each other on the same chart.
How It Works
For each group, net position is calculated as:
Net Position = Long Positions - Short Positions
This is calculated separately for Commercials and for Large Speculators (Non-Commercials). Optionally, either series can be displayed as a percentage of total Open Interest instead of raw contracts:
Net % of Open Interest = 100 * Net Position / Open Interest
This normalization makes readings easier to compare over time and across contract-size changes (e.g. after a rollover or a change in typical position sizes), since raw contract counts alone don't account for changes in overall market participation.
COT data is requested with lookahead disabled, so this indicator does not repaint. Values only change on the bar where new CFTC data is published, regardless of chart timeframe.
Default Settings
Show Commercials: on
Show Large Speculators: on
Display Mode: Contracts (switchable to % of Open Interest)
Info table: on, top right
All adjustable in the script's Settings.
Interpretation
Commercials (often producers, processors and hedgers) and Large Speculators (large funds and managed money) are typically positioned on opposite sides of the market. Watching both net lines together shows the balance between these two groups.
A rising Commercials Net line while Large Speculators Net falls (or vice versa) reflects a shift in who is taking on more directional exposure.
The info table also shows the week-over-week change for each group and the current Open Interest.
Typical Use Cases
Compare Commercial and Large Speculator positioning on one chart
Track how net positioning shifts week to week
Normalize positioning across markets or over long histories using % of Open Interest
Combine with seasonality, price structure, trend and market regime for a fuller picture
Support commodity and futures market research
Limitations
COT data is weekly and delayed: the report reflects positions as of Tuesday and is usually published the following Friday. This indicator is not designed for intraday timing and is not a standalone trading system. Net positioning alone does not predict price direction. Both groups can remain positioned the same way for extended periods, especially in strong trending markets. Past positioning patterns do not guarantee future price behavior.
Symbol Support
Designed for futures and continuous futures charts. Some micro contracts, CFDs, broker-specific symbols or otherwise unsupported markets may not return valid COT data.
Originality
COT data retrieval uses the public TradingView "LibraryCOT" community library. The net-position calculation for both trader groups, the optional % of Open Interest normalization, the weekly change tracking, and the info table are original to this script. It complements the companion "Commercials COT Index Weekly" indicator, which shows Commercial positioning as a normalized 0-100 index rather than as raw/percentage net values.
For educational and research purposes only. This is not financial advice. Gösterge

COT Index - Commercial Positioning (Weekly)Overview
This indicator helps futures traders identify relative Commercial Trader positioning extremes using weekly Commitment of Traders (COT) data from the CFTC.
How It Works
The script calculates Commercial Net Position each week:
Commercial Net Position = Commercial Long - Commercial Short
It then normalizes this value against its own recent history over a configurable lookback period:
COT Index = 100 * (Net Position - Lowest Net Position) / (Highest Net Position - Lowest Net Position)
This shows where current Commercial positioning stands relative to its own recent range, rather than looking at absolute long/short numbers in isolation.
The script runs its core calculation on a fixed Weekly timeframe internally, regardless of the chart timeframe it's added to — so it stays useful on daily, 4H, 1H and intraday charts while still showing correct weekly positioning context. COT data is requested with lookahead disabled, so the indicator does not repaint.
Default Settings
Lookback period: 26 weeks
Upper threshold: 75
Lower threshold: 25
Neutral midpoint: 50
All adjustable in the script's Settings.
Interpretation
A high COT Index indicates Commercial Traders are positioned relatively bullish compared to their own recent history.
A low COT Index indicates Commercial Traders are positioned relatively bearish compared to their own recent history.
Readings above the upper threshold (default 75) may indicate elevated Commercial positioning.
Readings below the lower threshold (default 25) may indicate depressed Commercial positioning.
Typical Use Cases
Identify relative Commercial positioning extremes
Add COT context to futures swing trades
Compare positioning across different futures markets
Combine COT data with seasonality, price structure, trend and market regime analysis
Support commodity research and trade planning
Limitations
COT data is weekly and delayed: the report reflects positions as of Tuesday and is usually published the following Friday. This indicator is not designed for intraday timing and is not a standalone trading system. Extreme COT readings are not automatic reversal signals. Commercial positioning can remain elevated or depressed for extended periods, especially in strong trending markets. Past positioning patterns do not guarantee future price behavior.
Symbol Support
Designed for futures and continuous futures charts. Some micro contracts, CFDs, broker-specific symbols or otherwise unsupported markets may not return valid COT data.
Originality
COT data retrieval uses the public TradingView "LibraryCOT" community library. The Commercial Net Position calculation, the lookback-based normalization into a 0-100 COT Index, the configurable thresholds, and the visualization are original to this script.
For educational and research purposes only. This is not financial advice. Gösterge

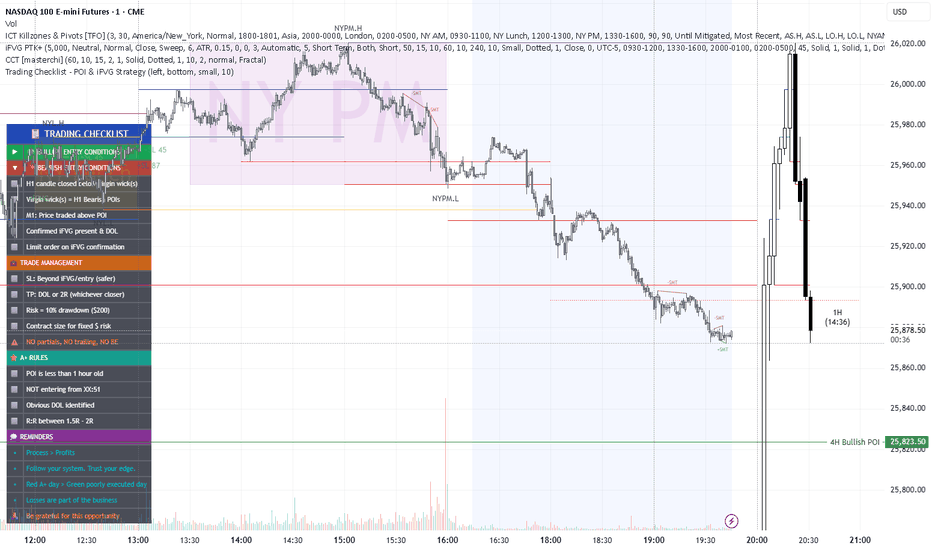
Coasyn Session AnchorCoasyn Session Anchor
Coasyn Session Anchor is an intraday session-reference tool for marking important FX trading-session events directly on the chart.
The indicator can track:
Tokyo Open
Tokyo Close
Europe Open
London Open
New York Open
New York Close
Each enabled event can create:
a vertical timing marker showing when the session event occurred
a horizontal price anchor extending from that event
an optional label identifying the session
The indicator does not generate trade signals, determine market direction, or execute orders.
Its purpose is to provide consistent session timing and price-reference levels.
How to use it
Open the indicator settings and first choose your Anchor Timezone.
The default is:
Etc/UTC
All session times entered in the indicator are interpreted using this timezone.
For each session event, you can:
Enable or disable the event.
Enter the event time using HH:MM format.
For example:
00:00
07:00
08:00
13:30
Session times
The default configuration is:
Tokyo Open — 00:00
Tokyo Close — 09:00
Europe Open — 07:00
London Open — 08:00
New York Open — 13:30
New York Close — 21:00
These times are fully editable.
If your preferred session definition, broker convention, daylight-saving adjustment, or operating timezone is different, change the values in the settings.
Horizontal anchor price
The Horizontal Anchor Price setting determines which price is used when a session event occurs.
Event Open
Uses the chart bar's opening price when the session anchor is detected.
Event Close
Uses the chart bar's closing price.
The resulting level extends to the right as a reference for later price interaction.
Vertical session markers
Enable:
Show Vertical Session Timing Lines
to draw a vertical line at each enabled session event.
This provides a visual reference for when major trading sessions begin or end.
Horizontal session levels
Enable:
Show Horizontal Anchor Levels
to extend the selected event price across the chart.
These levels can be used to observe how price behaves relative to prior session participation points.
The indicator does not assign bullish or bearish meaning to those levels.
Labels
Enable:
Show Anchor Labels
to identify each session directly on the chart.
Labels include:
TOKYO OPEN
TOKYO CLOSE
EUROPE OPEN
LONDON OPEN
NY OPEN
NY CLOSE
Historical anchors
By default, Keep Historical Anchors is disabled.
When disabled, each session event keeps only its most recent anchor.
For example, when the next London Open occurs, the previous London Open anchor is removed and replaced with the new one.
Enable Keep Historical Anchors if you want previous session anchors to remain visible.
Be aware that keeping large amounts of historical session data can create substantially more chart objects.
Display controls
The indicator allows you to configure:
session colors
line width
horizontal levels
vertical timing markers
labels
historical anchors
Each major session can use its own color so different session events remain easy to distinguish.
Example workflow
A trader operating during the London and New York sessions might enable:
Europe Open
London Open
New York Open
while disabling session events they do not use.
The chart will then maintain timing and price anchors for those specific events.
This makes it easier to observe whether price is trading:
above or below a session-opening reference
back through a prior session level
around the transition between trading sessions
The interpretation remains entirely with the trader.
Timeframe note
Coasyn Session Anchor is designed primarily for intraday charts.
The precision of an anchor depends on the chart timeframe.
On lower intraday timeframes, the bar containing the configured session time will generally provide a more precise representation of that event.
On larger chart intervals, one candle may span multiple session events, so the event price should be treated as a broader reference rather than an exact tick-level session price.
Important
Coasyn Session Anchor is an informational charting tool only.
It does not provide:
buy or sell signals
trade entries
targets
stop placement
position sizing
automated execution
directional recommendations
It provides time and price anchors around the session events selected by the user.
Built by Coasyn Market Systems. Gösterge

COT Commercial Hedger ExtremeIn commodities, the crowd and the smart money sit on opposite sides of the same report every week. The Commitment of Traders breaks open interest into commercials -- the producers, merchants and processors who hedge physical -- and large speculators, who are mostly trend-following money. The commercials are the ones who actually touch the barrel, the bushel, the bar. When they move to an extreme, it pays to listen.
The pattern that marks real commodity bottoms is simple to say and hard to wait for: commercial hedgers covering shorts en masse, from a multi-year net-short extreme, and curling back toward flat or net long. That is the producers deciding price has fallen far enough that they no longer need to hedge aggressively. It happened at the 2008 low, it happened into the 2018-19 lows, and I used this exact tell to call the September 2022 gold bottom near $1,640 in real time on TradingView. Gold peaked above $5,500 in January 2026, a move of more than 200% from that low.
This indicator puts that read on your chart.
The colored net line is the commercial position: red when they're at an extreme and still pressing shorts (no bottom), yellow when they start covering up off that extreme, green when they curl to flat or net long (the bottom tell). A triangle marks the first week they begin covering, a diamond marks the cross to net long. The blue line is large speculators for context -- they are usually heaviest long right as commercials are heaviest short, which is the whole point. Optional small-trader line too.
The dashboard shows commercial net, where it sits in its multi-year percentile, the spec and small-trader nets, and whether covering is underway. Alerts fire when hedgers start covering and when they flip toward net long.
Works on any futures with a CFTC code -- gold, silver, copper, oil, grains, even the index futures. Set the code in the settings to match the contract you're charting. Default is gold.
One read in isolation is a tell, not a trigger. I pair it with trend and price structure -- it tells you the tank is full of fuel, not that the match is lit. But when commercials cover their shorts, I want to know. Gösterge

xKen-t COT Index & Extremes (Native)Overview
COT Index & Extremes (Native) turns Commitments of Traders positioning into a single, decision-ready sentiment reading. It fetches CFTC COT data directly, converts a chosen trader group's net position into a 0–100 index that shows where current positioning sits within its own historical range, and flags when that positioning reaches a bullish or bearish extreme. The goal is to replace "eyeballing" raw COT lines with a defined, repeatable number.
The concept behind it
Raw COT net positions are hard to act on because "a lot" or "a little" only means something relative to an asset's own history. This script applies a position-in-range normalization (in the spirit of a Williams %R calculation, but applied to positioning rather than price): it takes the selected group's net position (long minus short) and measures where today's value falls between its lowest and highest readings over a lookback window, scaled 0–100. A reading near 100 means positioning is at the top of its historical range; near 0, the bottom. Two windows are used together — a short (26-week) read for the current swing in sentiment and a long (~3-year, 156-week) read for the structural picture.
Extremes are then defined mechanically: at or above 80 = an extreme in that group's positioning (bullish bias for commercials), at or below 20 = the opposite extreme (bearish bias). This makes "extreme" a number you can journal and alert on, not a subjective judgment.
What it does
- Fetches CFTC COT data natively and auto-resolves the correct futures contract from the chart's symbol — no need to wire in another indicator as a data source.
- Builds the net position for the selected trader group and normalizes it to the 0–100 index (short and long lookbacks).
- Marks the bullish/bearish extreme threshold zones and states a plain bias: BULLISH, BEARISH, or NO EDGE.
- Lets you switch between Commercial, Non-Commercial, and Retail (non-reportable) groups. Note these read differently — commercial hedgers are commonly used as a contrarian ("smart money") read at extremes, while non-commercials and retail are the crowd typically faded at extremes.
- Fires alerts when the index crosses into a bullish or bearish extreme.
When a symbol has no CFTC data (cash indices, most single stocks, crypto, exotic crosses), it clearly states "NO COT — use the futures symbol" and prompts you, instead of silently plotting a misleading line off price.
- Displays a panel confirming the resolved CFTC code, the active trader group, and whether the chart is on the correct (weekly) timeframe.
What's original here
Most COT tools plot raw net positions or require you to wire in another indicator's data. This one is self-contained and reframes the data for decision-making through three things: (1) it fetches CFTC Commitment of Traders data natively via TradingView's COT library and auto-resolves the correct contract from the chart's futures symbol, so no source-wiring is needed; (2) it converts a chosen trader group's net position (long − short) into a 0–100 "position-in-range" index — a Williams-style normalization showing where current positioning sits within its own historical range over a short (26w) and long (~3y) lookback — so an "extreme" becomes a defined number (≥80 / ≤20) instead of a visual guess; and (3) it switches cleanly between Commercial, Non-Commercial, and Retail groups and states a plain bullish/bearish/neutral bias from the index. When a symbol has no CFTC data (cash indices, most stocks, exotic crosses) it says so and prompts for the futures symbol, rather than silently plotting noise. A panel confirms the resolved CFTC code, the group, and whether you're on the correct weekly timeframe.
How to use it
1. Open a weekly chart of the futures symbol (e.g. 6E1!, GC1!, DX1!, ES1!, 6N1!) — not the cash index or spot pair. COT is weekly data, and the lookbacks are counted in weekly bars.
2. Read the index and bias. ≥80 = bullish extreme, ≤20 = bearish extreme, mid-range = no positioning edge.
3. Use it as directional context, confirmed by your own entry method, levels, and risk management.
4. If the panel shows no code, enter the 6-digit CFTC code manually in settings, or switch to the contract's futures symbol.
Inputs
Trader group (Commercial / Non-Commercial / Retail) · optional CFTC code override · include-options toggle · short and long lookbacks · bullish/bearish thresholds · display and shading options.
Attribution
COT data access uses TradingView's official LibraryCOT. This script's original contribution is the index construction, bias logic, no-data handling, and presentation built on top of that data.
Limitations and disclaimer
COT is weekly, reported with a lag, and only exists for CFTC-reported futures — so this is context, not a timing signal, and it will not read non-CFTC instruments. Positioning extremes indicate potential, not certainty, and can persist for extended periods. This is an analysis tool, not financial advice. Always confirm with your own analysis and manage risk. Gösterge

xKen-t Williams %R + EMA w/COT Bias GateWhat's original here
This isn't a Williams %R repaint. Standard %R gives a level; this script converts it into a filtered, context-aware timing engine through four combined mechanisms: (1) exit-from-extreme triggers that fire when %R crosses back out of −80/−20 rather than when it reaches them, so signals mark the reversal instead of the ongoing move; (2) EMA-side confirmation that validates the exit against the 13-EMA; (3) a −50 regime filter that blocks counter-regime signals; and (4) a directional-bias gate that normalizes any external series you feed it (e.g. a COT commercial-net line) to a 0–100 position-in-range index and suppresses every signal that disagrees with that bias. The gate is the core idea — it makes the oscillator time entries only in a separately chosen direction, turning a reversal oscillator into a with-context pullback tool. A status table surfaces %R, its EMA, the regime, the active bias, the higher-timeframe read, and the last signal in one place.
Overview
A Williams %R momentum tool rebuilt around three ideas: it signals on the exit from an extreme rather than the touch, confirms that exit with the %R/EMA relationship, and can gate every signal by an external directional bias (such as Commitments of Traders positioning) so only signals agreeing with that bias are shown. This targets the two classic Williams %R weaknesses — catching falling knives at the band, and firing endless counter-trend reversals during strong trends.
What it calculates
- Williams %R (default 21): the standard oscillator (0 to −100) measuring where the close sits within the lookback's high-low range.
- 13-EMA of %R: a smoothing/confirmation line.
- Triggers: in "Band exit" mode a long fires when %R crosses back up through −80 (leaving oversold) and a short when it crosses back down through −20 (leaving overbought). In "EMA cross in zone" mode the trigger is %R crossing its EMA while in the lower/upper half. Either way, it marks the turn, not the extreme reading itself.
- EMA confirmation (optional): requires %R on the trigger side of its EMA at signal time.
Regime filter (optional): longs only when the %R EMA is above the −50 midline, shorts only when below.
- COT Bias Gate: point the "COT source" input at any external series on the chart — e.g. a Commitments of Traders commercial-net or COT-index line. The script converts it to a 0–100 position-in-range index over a lookback; ≥80 is treated as bullish bias, ≤20 as bearish. With the gate on, longs show only in a bullish bias and shorts only in a bearish one; opposite-bias signals are suppressed. You can also set the bias manually or turn the gate off for standalone %R.
- Divergence (optional): regular bull/bear divergence between price pivots and %R pivots.
Higher-timeframe read (optional): shows a higher-timeframe %R value in the table for top-down context.
How to use it
1. Add it on your entry timeframe (defaults: %R 21, EMA 13, band-exit, EMA confirmation on).
2. Set the bias — manually (Bullish/Bearish), or "Auto" pointed at a COT/context line, or Off.
3. Trade the markers: green up-triangle = confirmed long trigger, red down-triangle = confirmed short. Combine with your own levels and risk management.
Notes and limitations
- Divergence markers are drawn back at the confirmed pivot using an offset — they plot in the past and can repaint until the pivot forms. Treat them as context, not a standalone trigger.
- The gate reads whatever series feeds the source input; on the default (Close) the "bias" is computed from price, not COT — point it at a real COT/context line for it to be meaningful.
- The higher-timeframe read uses non-lookahead requests (no future data).
- Analysis tool for timing within a chosen bias. It does not predict outcomes and is not financial advice. Gösterge

Session LevelsPlots the High/Low of the three major sessions, the previous FULL trading day's High/Low, the all-time high, and fires sweep alerts when price takes out any of these levels.
ROLLING WINDOW:
// Each session shows only the CURRENT trading day's level plus the previous
// trading day's level -- never older -- so old session lines stop piling up
// and crossing each other.
//
// WEEKLY RESET:
// A trading day starts at 18:00 ET (CME open / Asia open). At the Sunday
// 18:00 ET weekly open every session line is wiped for a clean week.
//
// HOLIDAY AWARENESS:
// The previous-day references (PDH/PDL, the rolling session "previous day",
// and the Monday RTH/Post-market refs) skip US market holidays AND early-close
// half-days (Juneteenth, July 3, Black Friday, Christmas Eve...) and pull from
// the most recent FULL session instead. Holidays are computed algorithmically
// (incl. Good Friday via computus and the NYSE Sat->Fri / Sun->Mon observed
// rules), so there is no yearly list to maintain. Example: the Mon after a
// Juneteenth Friday references Thursday.
// PDH/PDL use a CALENDAR-day (midnight) boundary by default so the prior
// evening's overnight move is NOT lumped into the day -- switch to "RTH only"
// in the inputs if you prefer the cash-session high/low. They draw as a single
// line spanning only the live reference, not a step across all history.
//
// MONDAY REFERENCES:
// Monday's "previous day" is the weekend, so it shows the last full day's
// RTH High/Low and Post-market High/Low for context. These clear Mon evening.
//
// SWEEP ALERTS (new):
// Alert conditions fire when price sweeps a session High/Low (after that
// session closes), the PDH/PDL, or makes a new all-time high. Gösterge

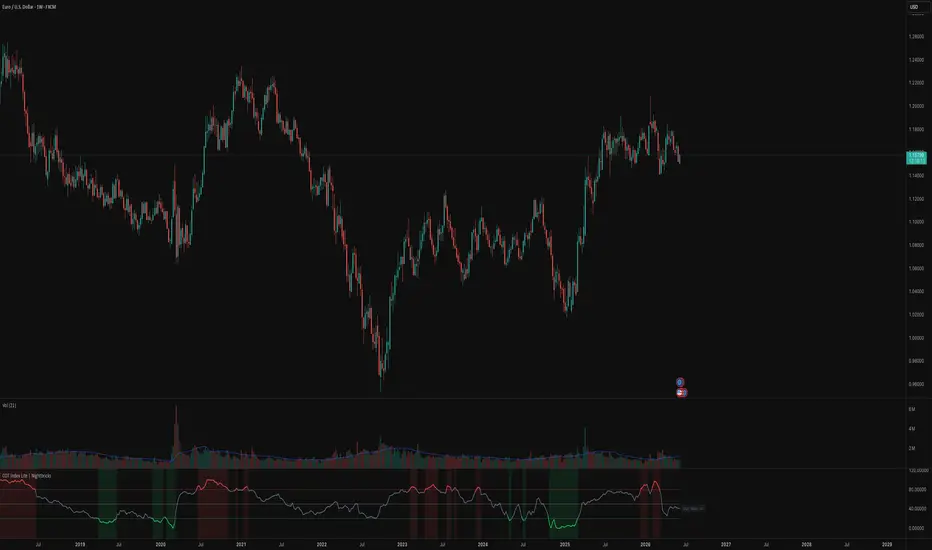
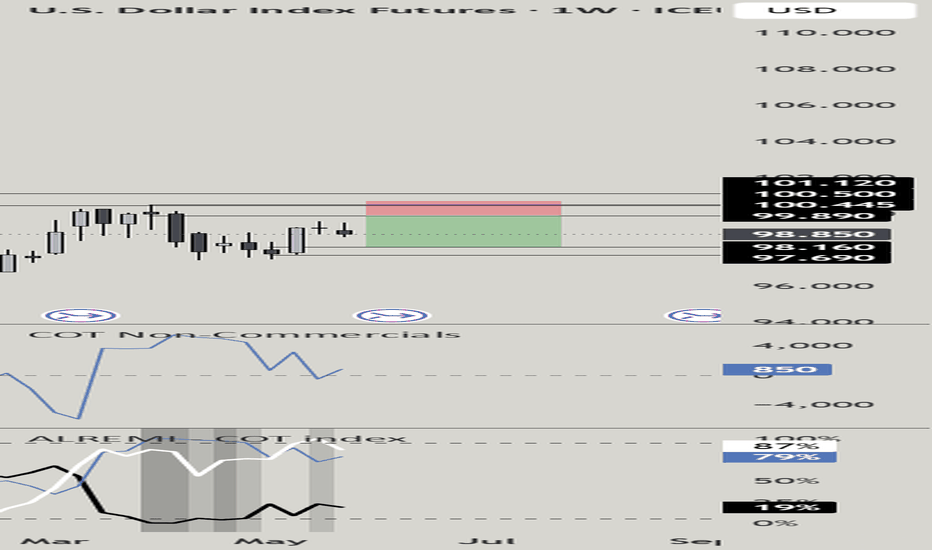
COT Index Lite - by NightbricksThe COT Index shows Managed Money (Non-Commercial) net positioning as a normalised
0–100 value, auto-detected from your chart symbol across 60+ futures markets. No manual
CFTC code required for supported assets.
**What it measures**
Net positioning (longs minus shorts) from the CFTC Commitment of Traders report,
normalised against a 3-year (156-week) lookback window:
- **100** — net longs at a 3-year high. The crowd is maximally long.
- **0** — net shorts at a 3-year high. The crowd is maximally short.
- **50** — the midpoint of the 3-year range.
- **Above 80** — historically crowded-long zone (red background shading).
- **Below 20** — historically crowded-short zone (green background shading).
Updated every Friday after the CFTC 3:30 PM ET release. The script reads the last
*completed* weekly value, so the printed reading does not repaint intra-week.
**Why a 3-year window?**
Many COT Index tools use a 26–52 week lookback. Short windows produce unstable readings
that jump as old extremes age out of the window. A 156-week window spans a full market
cycle, so an "extreme" reading is extreme relative to years of behaviour — not just the
last few months.
**Supported markets — auto-detected**
- Equity indices: S&P 500, Nasdaq 100, Dow, Russell 2000, Nikkei, VIX
- FX: EUR, GBP, JPY, CHF, CAD, AUD, NZD, MXN
- Rates: 30Y, 10Y, 5Y, 2Y T-Notes, Fed Funds
- Crypto: Bitcoin, Ethereum
- Energy: WTI, Brent, Natural Gas, Heating Oil, Gasoline
- Metals: Gold, Silver, Copper, Platinum, Palladium
- Grains: Corn, Wheat, Soybeans, Soybean Meal/Oil, Oats, Rice
- Softs: Cotton, Sugar, Coffee, Cocoa, OJ
- Livestock: Live Cattle, Lean Hogs, Feeder Cattle
For any unlisted instrument, type its CFTC market code into the "CFTC Code override" input.
**How to use it**
- Add it to a **Weekly** chart — COT data is weekly; the script warns you on other timeframes.
- Treat readings above 80 and below 20 as *context*, not signals. A crowded-long market
can stay crowded; the index tells you how stretched positioning is, not when it turns.
- Combine with price structure and your own risk rules.
**What the COT Index does — and does not — tell you**
The COT Index answers one question: *where is positioning within its 3-year range?* By
design it does **not** measure how statistically extreme the reading is, whether
positioning is accelerating or unwinding, or whether price and positioning are diverging.
Those are separate calculations on the same underlying data — useful to understand as
their own concepts, but out of scope for a single 0–100 line.
Open-source. Read the code, fork it, learn from it. Gösterge

Gösterge

Gösterge
Gösterge
Gösterge

Gösterge
Gösterge

Gösterge

xLevTrading AI SMC Algo v.0.6The xLevTrading AI Smart Money Concept Indicator is a significantly expanded and independently developed institutional trading framework based on LuxAlgo’s Smart Money Concept source code. While the script builds upon established Smart Money Concept principles such as market structure, liquidity analysis, order blocks, and fair value gaps, the internal logic, filtering systems, visual prioritization, and execution tools have been heavily redesigned and extended to create a more adaptive and context-aware analytical environment.
The primary objective of this indicator is not to generate excessive signals, but to help traders better understand how price interacts with liquidity, imbalance, and structural shifts in real market conditions. Instead of treating Smart Money Concepts as isolated visual tools, the indicator combines multiple layers of analysis into a unified framework where each component contributes contextual information to the others. This allows traders to evaluate not only where price currently is, but also why certain areas may become important during future market movement.
At the core of the system is the Adaptive Market Structure Engine, which acts as the foundation for all higher-level calculations. This engine continuously evaluates swing highs, swing lows, internal structure transitions, and external break-of-structure events in order to determine directional context across changing market conditions.
Unlike simplified structure indicators that only label highs and lows, the system distinguishes between internal market behavior and broader external trend development. This distinction allows traders to identify whether price action is currently impulsive, corrective, ranging, or transitioning into a potential reversal phase.
The structure engine also serves as a contextual filter for all other modules. Order blocks, fair value gaps, liquidity sweeps, and entry confirmations are evaluated relative to active structural conditions. This prevents isolated signals from appearing without broader market confirmation and helps traders focus on areas where multiple concepts align simultaneously.
One of the major components of the framework is the enhanced Order Block Engine. Traditional Smart Money Concept implementations often display large amounts of order blocks regardless of quality or contextual relevance, which can quickly overcrowd charts and reduce clarity. In this script, the order block system was redesigned to prioritize quality, structural alignment, and reaction probability instead of quantity.
The engine analyzes several contextual variables before validating a zone, including displacement strength, mitigation behavior, structural positioning, surrounding liquidity conditions, and overall market alignment. Zones that do not meet minimum contextual requirements are filtered out in order to reduce noise and improve readability.
This process creates a cleaner chart environment where institutional-style supply and demand zones become easier to interpret. The goal is not simply to identify historical candles, but to highlight areas where market participants may still have unfilled interest or where future reactions could become more likely.
To further improve usability, the indicator introduces Dynamic Fill Technology across both order blocks and fair value gaps. Instead of displaying every zone with equal visual weight, transparency levels dynamically adapt according to the internal scoring and contextual relevance of each area.
This visual hierarchy helps traders quickly distinguish stronger zones from weaker ones without manually analyzing every individual structure. Higher-confidence zones appear more visually dominant, while weaker areas fade into the background. The intention behind this system is to transform complex structural information into an intuitive visual workflow that supports faster decision-making during live market conditions.
Another major feature is the Dual Fair Value Gap Engine. Fair value gaps represent areas where price moved aggressively, creating temporary inefficiencies in the market. These imbalances often become important reaction zones as price later revisits them in an attempt to rebalance liquidity and restore market efficiency.
The Dual FVG system was specifically developed to identify strong imbalances across both lower timeframes (LTF) and higher timeframes (HTF) simultaneously. This allows traders to observe not only short-term inefficiencies, but also broader institutional imbalances that may influence market behavior over extended periods.
One of the key advantages of this approach is the ability to identify overlapping imbalances between different timeframe structures. When lower-timeframe and higher-timeframe fair value gaps align within similar price regions, these areas can represent stronger institutional interest and potentially more precise market impulses.
This multi-timeframe imbalance framework helps traders better understand where price may accelerate, react, or seek liquidity. By combining local execution zones with broader macro inefficiencies, traders gain additional context for identifying higher-probability entries and continuation opportunities.
The Liquidity Engine represents another central pillar of the framework. Liquidity behavior is one of the most important concepts in institutional trading because price often seeks areas where stop-loss orders, breakout traders, and resting liquidity are concentrated.
Instead of relying solely on static support and resistance levels, the liquidity system actively identifies equal highs, equal lows, liquidity pools, sweep conditions, and engineered liquidity grabs in real time. These events are then evaluated relative to structure and directional context.
This allows traders to better understand potential market intent rather than simply reacting to price movement after it has already occurred. For example, a liquidity sweep occurring against higher-timeframe directional bias may indicate temporary stop-hunting behavior rather than genuine reversal strength.
The interaction between liquidity and structure becomes especially important when combined with order blocks and fair value gaps. Areas where liquidity sweeps occur directly into structurally aligned imbalance zones can often provide significantly stronger contextual setups than isolated technical signals.
To further support directional analysis, the indicator also incorporates a Multi-Timeframe Moving Average Module. This feature provides optional trend filtering and directional confirmation by allowing traders to compare lower-timeframe execution against higher-timeframe trend conditions.
The moving average framework is not intended as a standalone signal generator, but rather as an additional contextual layer that helps traders avoid counter-trend positioning during strongly directional environments. This can be particularly useful when combining liquidity sweeps with continuation structures.
One of the newest additions to the framework is the Entry Finder Module, which is currently in Beta development. The purpose of the Entry Finder is not to replace discretionary trading decisions, but to assist traders in locating areas where multiple forms of confirmation align simultaneously.
The Entry Finder analyzes the relationship between structure direction, liquidity interaction, order block positioning, fair value gap alignment, and market momentum in order to identify potential execution zones. The system attempts to detect moments where price may be transitioning from liquidity collection into directional continuation.
For example, during bullish market conditions, the Entry Finder may identify a scenario where downside liquidity is swept below recent lows before price re-enters a bullish order block or bullish fair value gap that aligns with higher-timeframe structure. In bearish environments, the same logic can apply inversely after upside liquidity has been collected.
The purpose of this process is to help traders avoid emotional momentum entries and instead focus on structurally supported retracement opportunities where institutional participation may become more probable.
The Entry Finder can also assist traders by improving timing during volatile conditions. Many traders correctly identify directional bias but struggle with execution precision. By highlighting areas where liquidity, imbalance, and structure align simultaneously, the system attempts to improve entry location and reduce unnecessary chasing behavior.
Because the Entry Finder remains in Beta, its filtering logic and confirmation models are still being refined. Current versions should be viewed as execution assistance tools rather than fully automated signal systems. Traders are encouraged to combine the Entry Finder with their own risk management and market interpretation.
In addition to its analytical capabilities, the overall design philosophy of the indicator focuses heavily on chart readability and workflow efficiency. One of the common challenges with Smart Money Concept tools is visual overload caused by excessive labels, overlapping zones, and unnecessary calculations appearing simultaneously.
This framework was designed to reduce that issue through selective filtering, contextual prioritization, and dynamic visual weighting. Rather than attempting to display every possible technical event, the indicator focuses on highlighting areas where multiple concepts converge.
The result is a cleaner trading environment that allows users to focus more effectively on liquidity behavior, structural shifts, and execution planning without becoming overwhelmed by chart clutter.
The xLevTrading AI Smart Money Concept Indicator should be viewed as a professional-grade analytical framework designed for discretionary traders who want a deeper understanding of institutional price behavior. By combining enhanced Smart Money Concept principles with proprietary filtering systems, dynamic visualization methods, liquidity analysis, and multi-timeframe contextual alignment, the script aims to transform complex market behavior into a more structured and actionable decision-making process.
This indicator does not guarantee profitable trades and should not be interpreted as financial advice. It is intended as a decision-support and market-structure analysis tool that assists traders in interpreting price action, identifying contextual confluence, and improving overall market awareness across different trading environments.
Chart Visualization & Color Structure
To improve chart readability and help traders quickly distinguish between different market concepts, the indicator uses a structured color hierarchy across all major components. The visual system was intentionally designed to reduce confusion during live analysis and to make the interaction between liquidity, structure, order blocks, and fair value gaps easier to interpret.
Bearish higher-timeframe order blocks are displayed in purple. These zones represent institutional-style supply areas that align with broader bearish market structure and may act as potential reaction or continuation zones during retracements.
Bearish higher-timeframe fair value gaps (HTF FVGs) are displayed in orange. These imbalance zones represent aggressive bearish displacement on higher timeframes and are intended to highlight areas where price inefficiencies may still attract future reactions or rebalancing behavior.
Bearish chart timeframe fair value gaps are displayed in red. These zones reflect local bearish imbalances directly on the active chart timeframe and are primarily used for short-term execution analysis and momentum continuation setups.
Bullish chart timeframe fair value gaps are displayed in green. These indicate local bullish inefficiencies where price moved aggressively to the upside, potentially leaving behind imbalance zones that may later provide support during retracements.
Bullish higher-timeframe fair value gaps are displayed in turquoise. These zones represent larger bullish imbalances from higher timeframe price action and are intended to provide macro directional context and stronger institutional reaction areas.
The interaction between these colors and zones is an important part of the overall framework. Traders can use overlapping higher-timeframe and lower-timeframe imbalances to identify areas where multiple forms of market inefficiency align simultaneously. For example, when a lower-timeframe bullish fair value gap develops inside a higher-timeframe bullish imbalance zone, this may indicate stronger continuation potential and improved structural confluence.
The chart layout shown in the publication intentionally focuses only on the indicator’s own analytical components without unnecessary overlays or unrelated tools. This cleaner presentation is designed to help traders clearly identify how the different modules interact with one another in real market conditions.
Labels such as Break of Structure (BOS), Change of Character (CHoCH), liquidity sweeps, moving averages, order blocks, and fair value gaps are displayed directly within their relevant market context to support visual interpretation and execution planning.
Gösterge

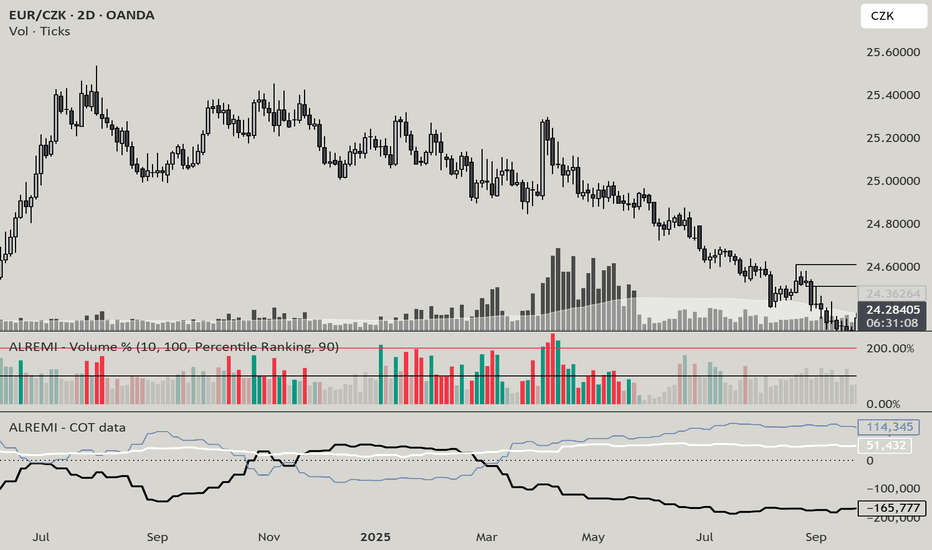
COT IndexCOT Index — Managed Money / Large Spec / Commercials
Short tagline:
Three-line COT Index (0–100) for futures: Large Spec, Managed Money, Commercials. Min-max normalized over a configurable rolling weekly window.
---
Description:
The COT Index plots three trader-group positioning gauges on a single 0–100 scale, derived directly from the CFTC's weekly Commitments of Traders reports. Useful for spotting positioning extremes, divergences between speculator and
commercial flow, and contrarian setups.
# What it shows
Three colored lines:
- 🔵 **Large Speculator** — Managed Money + Other Reportable (combined non-commercial positioning)
- 🟣 **Managed Money** — Managed Money only (Disaggregated) or Leveraged Funds (Financial / TFF)
- 🟠 **Commercials** — Producer/Merchant (Disaggregated) or Dealer/Intermediary (Financial)
Plus reference levels:
- Dashed red at **90** — extreme long
- Dashed green at **10** — extreme short
- Dotted gray at **50** — mid
# Formula
For each group, the indicator computes net positioning (Long − Short), then min-max normalizes over a rolling N-week window:
COT Index = (currentNet − min(net, N)) / (max(net, N) − min(net, N)) × 100
Default N = 156 weeks (3 years). Other common values: 13 (3M), 26 (6M), 52 (1Y).
# Auto contract resolution
Apply to any of the supported futures contracts and the indicator auto-resolves the CFTC code from the chart symbol. No manual configuration needed.
| Asset | Symbol | Report |
|---|---|---|
| Gold | COMEX:GC1! | Disaggregated |
| Silver | COMEX:SI1! | Disaggregated |
| Copper | COMEX:HG1! | Disaggregated |
| Platinum | NYMEX:PL1! | Disaggregated |
| Palladium | NYMEX:PA1! | Disaggregated |
| WTI Crude Oil | NYMEX:CL1! | Disaggregated |
| Brent Crude Oil | NYMEX:BZ1! / ICEEUR:BRN1! | Disaggregated |
| Natural Gas | NYMEX:NG1! | Disaggregated |
| RBOB Gasoline | NYMEX:RB1! | Disaggregated |
| Heating Oil | NYMEX:HO1! | Disaggregated |
| Euro FX | CME:6E1! | Financial (TFF) |
| British Pound | CME:6B1! | Financial (TFF) |
| Swiss Franc | CME:6S1! | Financial (TFF) |
| Canadian Dollar | CME:6C1! | Financial (TFF) |
| Japanese Yen | CME:6J1! | Financial (TFF) |
| Australian Dollar | CME:6A1! | Financial (TFF) |
| New Zealand Dollar | CME:6N1! | Financial (TFF) |
| Mexican Peso | CME:6M1! | Financial (TFF) |
Apply to a non-mapped symbol (e.g. a stock) and the indicator returns a clear runtime error.
# Inputs
- **Lookback (weeks)** — rolling window (4–520, default 156)
- **Show Large Speculator / Managed Money / Commercials** — toggle each line independently
- **Extreme long / short thresholds** — adjust the dashed reference lines
# How to read it
- **Large Spec / Managed Money near 90+** → speculators are very long, often a contrarian sell signal
- **Large Spec / Managed Money near 10−** → speculators are very short, often a contrarian buy signal
- **Commercials are the inverse** of speculators by definition (they take the other side of the trade) — Commercials at 1 typically pairs with Specs near 100
- **Watch divergences** between price and the indicator — speculative positioning peaking while price still rises is a classic distribution warning
# Notes
- Uses TradingView's official `LibraryCOT` (by TradingView) for ticker construction.
- Forces weekly resolution regardless of chart timeframe — values only update on Tuesday COT release days.
- `lookahead = barmerge.lookahead_off` — no future data leak; backtesting is honest.
- Auto-detect requires applying to the **futures** symbol (e.g. `6E1!`), not the spot pair (`EURUSD`). Spot FX charts are not supported.
- Data comes from the Disaggregated report for metals/energy and the Traders in Financial Futures (TFF) report for FX. Both are futures-only (`includeOptions=false`).
# Credits
Data fetching: ().
Open-source — feel free to fork and adapt.
--- Gösterge
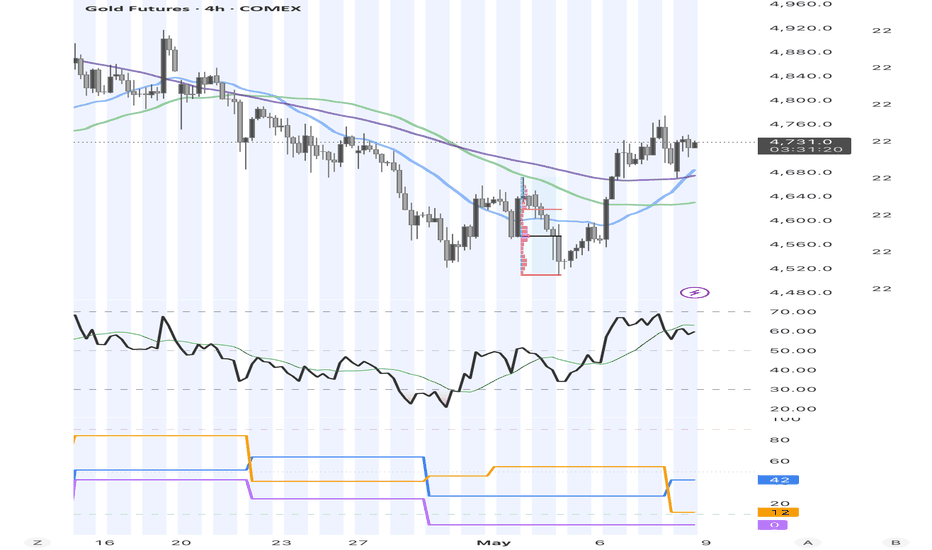
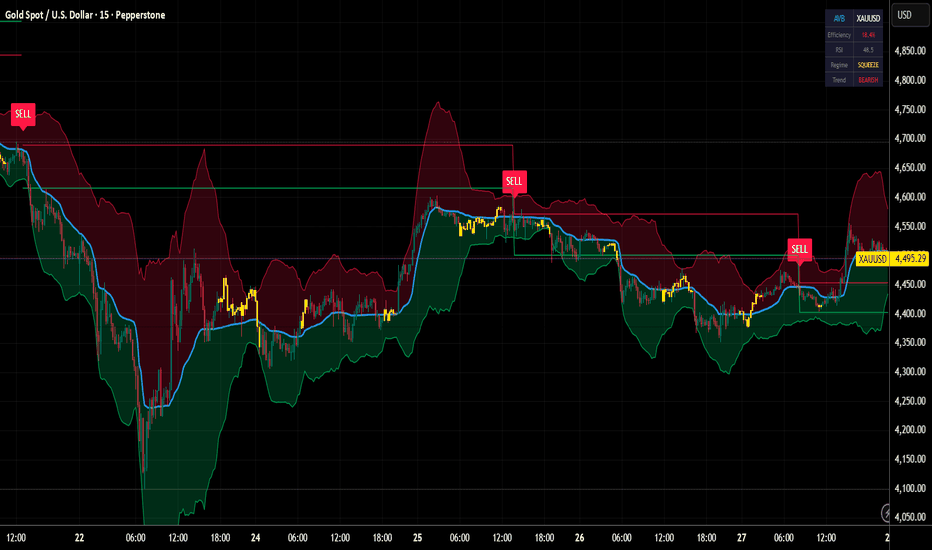
Adaptive Volatility Bands [AVB]Adaptive Volatility Bands (AVB) is a volatility-aware trend-following overlay indicator built on the Kaufman Adaptive Moving Average (KAMA) and dynamically adjusted Bollinger-style bands.
**Mathematical Foundation:**
The core of AVB is the Kaufman Efficiency Ratio (ER), which measures the ratio of directional price movement to total price movement over a lookback period. An ER near 1.0 indicates a strong trend with minimal noise; an ER near 0.0 indicates choppy, range-bound conditions. The KAMA uses this ratio to automatically adjust its smoothing constant — responding quickly during trends and slowly during consolidation.
The bands around the KAMA are not static standard deviations. Instead, they use an adaptive standard deviation that widens when the Efficiency Ratio is low (noisy markets) and tightens when ER is high (trending markets). This creates bands that contract during consolidation (squeeze) and expand during breakouts.
**Signal Logic:**
Buy signals are generated when price touches the lower band with RSI in oversold territory during an uptrend, or when a squeeze releases with price above the KAMA. Sell signals fire at the upper band with RSI overbought during a downtrend, or at squeeze release below KAMA. Volume confirmation is applied to filter low-conviction signals.
**Features:**
- Kaufman Adaptive Moving Average with adjustable fast/slow smoothing periods
- Adaptive volatility bands that respond to market efficiency
- Volatility squeeze detection with bar coloring
- RSI and volume filters for signal confirmation
- ATR-based stop-loss and take-profit levels
- Real-time dashboard showing efficiency ratio, RSI, volatility regime, and trend direction
- Fully customizable colors and parameters
**Use Cases:**
Suitable for forex, crypto, commodities, and equities across all timeframes. Works well on 15-minute to daily charts.
Gösterge
Gösterge

Gösterge

Gösterge
COT: CTA POSITIONINGCOT: CTA POSITIONING
A comprehensive Commitment of Traders (COT) indicator that tracks institutional money manager positioning across futures markets. This indicator displays CTA (Commodity Trading Advisor) net positioning as a percentile rank, helping traders identify potential market extremes and contrarian opportunities.
Key Features:
Multi-Market Coverage: Automatically detects and displays COT data for 60+ futures contracts across equity indices, bonds, currencies, cryptocurrencies, metals, energy, grains, livestock, and softs
Percentile Rank Display: Shows CTA net positioning (long minus short) as a percentile over a customizable lookback period (default 156 weeks ≈ 3 years)
Extreme Zones: Visual highlighting of potential reversal zones when CTAs reach positioning extremes (>80th percentile = bearish, <20th percentile = bullish)
Liquidity Analysis Table (optional): Displays detailed positioning breakdown including:
Gross long and short positions
Net positioning
20-day average volume
Net position as % of average daily volume
Estimated days to unwind net position
Methodology:
The indicator pulls CFTC Commitment of Traders data from both Financial Traders (COT3) and Disaggregated (COT2) reports, focusing specifically on leveraged money managers (CTAs/hedge funds). It calculates:
Net Positioning = CTA Longs - CTA Shorts
Net as % of Open Interest
Percentile rank of current net positioning vs. lookback period
Interpretation:
High readings (>80): CTAs are extremely net long - potential bearish reversal signal
Low readings (<20): CTAs are extremely net short - potential bullish reversal signal
Works best as a contrarian indicator on weekly timeframes
Consider liquidity metrics to assess position size relative to market capacity
Settings:
Lookback Period: Adjustable percentile calculation window (default 156 periods)
Show Table: Toggle detailed positioning and liquidity data display
Supported Markets:
Equity Indices (ES, NQ, RTY, YM), Treasuries (ZT, ZF, ZN, ZB, UB), Currencies (6E, 6J, 6B, 6C, 6A), Crypto (BTC, ETH), Metals (GC, SI, HG, PL, PA), Energy (CL, NG, RB, HO, BZ), Grains (ZC, ZW, ZS, ZM, ZL), Livestock (LE, HE, GF), and Softs (SB, CT, KC, CC, OJ)
Note: COT data is released weekly on Fridays and reflects positions as of Tuesday close. This indicator works best on daily or weekly timeframes.
Data sourced from CFTC Commitment of Traders reports via TradingView's COT library. Gösterge

Gösterge