Quantum Trend SignalQuantum Trading Indicator
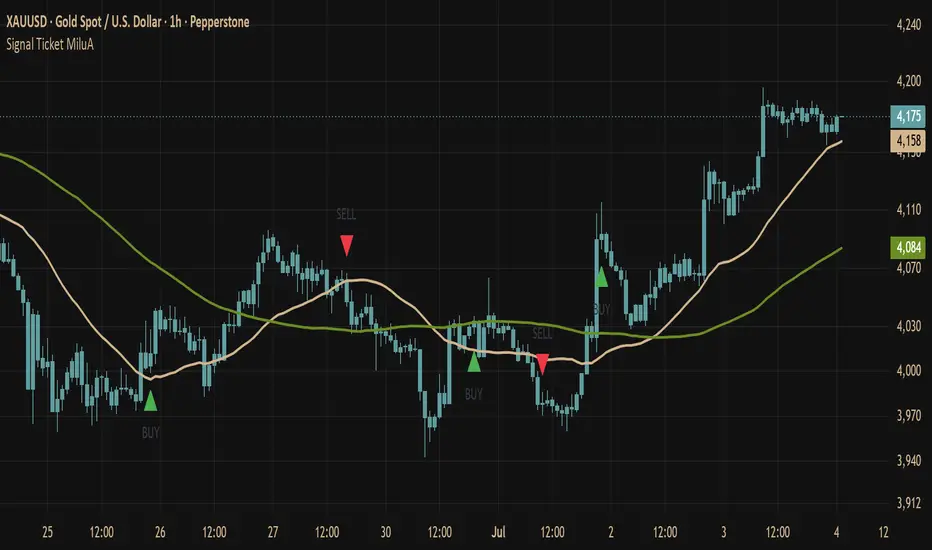
Quantum Trading Indicator is a multi-factor trend and momentum analysis tool designed to help traders identify high-probability trading opportunities while reducing market noise. Instead of relying on a single indicator, it combines several technical concepts into one decision-making system.
How It Works
The indicator evaluates market conditions using a confluence of signals, including:
- Trend Analysis: Identifies the dominant market direction to help traders trade with the prevailing trend.
- Momentum Confirmation: Measures buying and selling pressure to filter out weak setups.
- Volatility Filter: Detects whether market conditions are suitable for trading and avoids low-volatility periods that often produce false signals.
- Signal Validation: Generates Buy and Sell signals only when multiple conditions align, increasing signal quality and reducing unnecessary entries.
- Dynamic Risk Levels: Displays adaptive stop-loss and target levels based on current market volatility to support disciplined risk management.
Key Features
- Multi-factor signal confirmation
- Trend-following market analysis
- Momentum and volatility filtering
- High-quality Buy & Sell signals
- Non-repainting signal logic
- Suitable for Forex, Crypto, Stocks, Indices, and Commodities
- Compatible with scalping, intraday, swing, and position trading
- Customizable settings for different trading styles and timeframes
Best Practices
For improved decision-making, use the Quantum Trading Indicator alongside sound risk management, price action analysis, and key support and resistance levels. No indicator can guarantee profitable trades, and traders should always confirm signals within their own trading plan.
Trade with discipline. Trade with confidence. Trade with Quantum. Gösterge

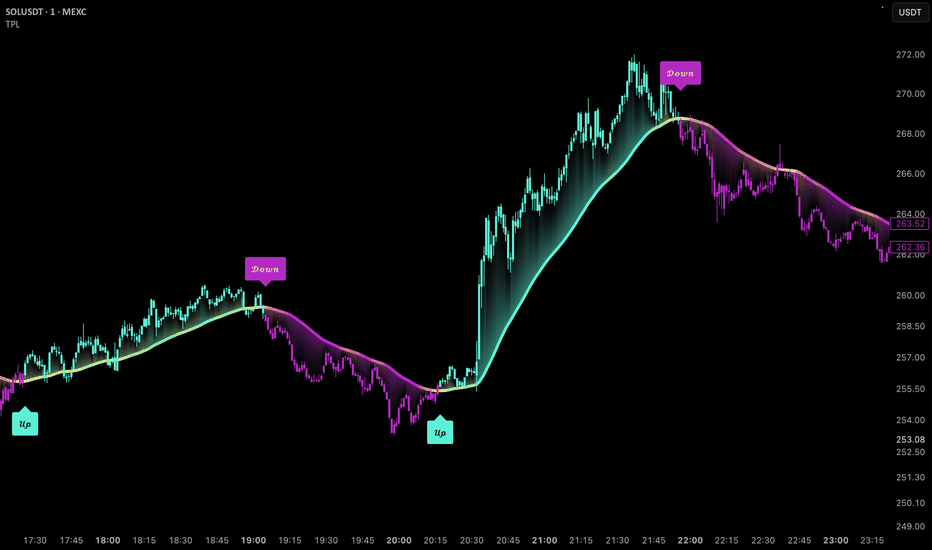
Uptrick: Trend Pressure LineIntroduction
Uptrick: Trend Pressure Line is a trend-following overlay that measures directional pressure by combining price displacement from a moving average, candle body strength, and short-term momentum into a single weighted composite. The composite is smoothed and converted into both a dynamic trend line and a bar coloring system, giving traders a continuous read on how strong buying or selling pressure is, rather than a simple binary trend flag.
Originality
While the script uses common building blocks such as an EMA baseline and ATR normalization, its originality lies in how these components are combined. Instead of relying on a single trend filter, the script blends three independently weighted pressure sources, price position relative to trend, candle body direction, and bar-to-bar momentum, into one normalized pressure value using user-adjustable weights. This composite pressure value is then used simultaneously to plot a smoothed adaptive trend line, generate a three-color gradient reflecting pressure intensity, calculate a reversal probability score based on how stretched pressure is relative to its recent range, and drive bar coloring through three separate selectable modes. No single one of these elements is novel on its own, but the integration of weighted multi-factor pressure scoring with a dedicated reversal exhaustion metric and multi-mode visual feedback is not a standard combination found in common trend or ATR-band indicators.
Features
Weighted trend pressure engine combining price position, candle body, and momentum into one composite score
Adjustable weighting for each of the three pressure components
Smoothed adaptive trend line plotted directly on the chart
Three-color gradient (bearish, neutral, bullish) that reflects live pressure intensity
Up and down trend signals with optional cooldown to reduce repeated signals
Four selectable signal anchor points (Default, High/Low, Close, Trend Line)
Optional take profit signals based on an ATR multiple from entry
Reversal probability calculation based on pressure stretch and distance from the trend line
Adjustable reversal lookback and sensitivity settings
Three selectable bar coloring modes (Reversal Probability, Latest Signal, Current Default)
Strong and extreme pressure level alerts for both bullish and bearish conditions
Dashboard table showing trend state, signal state, bars since last signal, pressure value, reversal percentage, bar mode, take profit status, ATR value, and trend line value
Four selectable table positions
19 distinct alert conditions covering signals, flips, pressure levels, and price/line crosses
Inputs
Source, Trend Length, ATR Length, Pressure Smoothness, and Line Smoothness control the core trend engine
Price Position Weight, Candle Body Weight, and Momentum Weight control how the three pressure components are blended
Show Up/Down Signals, Trend Threshold, Signal Cooldown, and Signal Anchor control signal generation and placement
Show TP Signals and TP ATR Multiplier control the optional take profit logic
Line Width, Gradient Sensitivity, Gradient Smoothness, and Bar Coloring Mode control the visual presentation
Reversal Lookback, Reversal Sensitivity, and High Reversal Alert Level control the reversal probability calculation
Strong Pressure Level and Extreme Pressure Level set the thresholds for pressure strength alerts
Show Table and Table Position control the on-chart dashboard
How It Works
The script builds a baseline using an EMA of price, then measures three separate pressures relative to ATR: how far price sits from that baseline, the strength of the current candle's body, and short-term momentum. These three values are combined using the user's weight settings and smoothed to produce a single pressure reading. This pressure reading is added to the baseline to draw the adaptive trend line, and it is also compared against a threshold to classify the market as bullish, bearish, or neutral, which drives the up and down signals. Separately, the script tracks how far current pressure is from its recent extreme and how far price has drifted from the trend line, combining both into a reversal probability percentage that increases as a trend becomes stretched.
How to Use
Watch the trend line color and the dashboard Trend row together to identify the current directional bias at a glance
Use the Up and Down labels as potential entry cues, and adjust Signal Cooldown if signals print too frequently on your chart's timeframe
Adjust the three weight inputs (Price Position, Candle Body, Momentum) if you want the pressure reading to favor trend positioning, candle strength, or short-term speed, depending on your trading style
Monitor the Reversal row on the dashboard as a trend matures; a rising percentage suggests the current move is becoming stretched and may be due for a pause or reversal
Switch Bar Coloring Mode to Reversal Probability if you want the candles themselves to visually flag exhaustion, or to Latest Signal if you prefer bars colored by the most recent up/down call
Enable Show TP Signals and set a TP ATR Multiplier if you want a visual marker for a fixed ATR-based profit target after each signal, then adjust the multiplier to match your own target distance
Use Signal Anchor to reposition labels relative to price action, high/low, or the trend line itself depending on chart clutter or personal preference
Set alerts on any of the nineteen available conditions to be notified of trend flips, pressure extremes, or price crossing the trend line without needing to watch the chart continuously
Conclusion
Uptrick: Trend Pressure Line gives traders a single adaptive line and pressure reading that reflects the combined influence of price positioning, candle strength, and momentum, along with a built-in gauge for how exhausted the current trend may be. It is intended as a trend and exhaustion visualization tool rather than a standalone signal generator.
Disclaimer
This script is provided for informational and educational purposes only and does not constitute financial advice. Past performance, including any signals or visual patterns shown on the chart, is not indicative of future results. Trading involves substantial risk, and users should perform their own analysis and risk management before making trading decisions based on this or any other indicator. Gösterge
Gösterge
Gösterge

CQ_(L)_Squeeze Momentum Suite Overlay================================================================================
CQ_(L)_SQUEEZE MOMENTUM SUITE OVERLAY
Description and User Manual
================================================================================
--------------------------------------------------------------------------------
1. OVERVIEW
--------------------------------------------------------------------------------
CQ Squeeze Momentum Suite Overlay is an all-in-one price-chart overlay that
combines several classic sub-pane oscillators (Squeeze Momentum, ADX/DMI, an
Expert Trend Locator, a Hull Moving Average, and Momentum divergence
detection) into a single indicator that draws directly on the price chart
instead of a separate panel below it.
Every oscillator-scale value (Momentum, Momentum Strength, Signal, ADX, Key
Level) is mapped onto real price coordinates using a shared "baseline"
reference. This baseline is the single zero-point anchor for all of the
above: when an oscillator crosses zero, its line will touch the baseline
exactly, and the whole visible window of oscillator history is drawn flush
against that same flat, straight reference line.
--------------------------------------------------------------------------------
2. HOW THE OVERLAY MAPPING WORKS
--------------------------------------------------------------------------------
- The script looks back over "Display Length (bars)" candles and finds the
highest high / lowest low in that window.
- Depending on "Placement" (Top or Bottom), the baseline is anchored either
just above the recent highs or just below the recent lows, with some
breathing room controlled by "Vertical Position Adjustment."
- "Height" controls how much vertical price-space the oscillators are
allowed to occupy above/below the baseline.
- All oscillator values are rescaled into that price-space and drawn as
lines/boxes anchored to the baseline, so the whole panel effectively
"floats" over the candles without needing a separate sub-chart.
- Because one single baseline value is used across the entire redrawn
window, the zero-line and every series are always shown as a flat,
straight reference instead of a value that drifts bar-to-bar.
- The redraw happens once per bar-close (snapshot pattern), which keeps the
indicator inside TradingView's per-indicator line/box drawing limits.
--------------------------------------------------------------------------------
3. FEATURE LIST
--------------------------------------------------------------------------------
A) SQUEEZE MOMENTUM
- Momentum oscillator (linear-regression based), selectable moving-average
engine (SMA, EMA, WMA, HMA, DEMA, TEMA, VWMA, ALMA, KAMA, JMA, Zero Lag,
Tillson T3, VIDYA, and more).
- Four render styles: Columns, Histogram, Line, Area.
- Optional Momentum Strength cloud (Momentum minus its own moving-average
Signal line).
- Optional Signal(Momentum) line.
- Multiple color palettes (5 built-in color schemes) reflecting whether
Momentum is positive/negative and rising/falling.
- Optional background tint reflecting the current Momentum color state,
plus a separate "dark mode" gray background option.
B) SQUEEZE PRO DOTS
- Circular markers above price flag when a Bollinger Band / Keltner
Channel squeeze is active, using three intensity levels (Low/Mid/High
squeeze) with distinct colors.
- Only rendered within the "Display Length (bars)" window (see Section 5).
C) ADX WITH KEY LEVEL
- ADX (Average Directional Index) rescaled to sit on the same baseline as
Momentum, so trend strength can be read directly against price.
- A "Key Level" reference line (ADX's neutral/trigger threshold, offset by
the "Distance" input) drawn alongside it.
- Colored Directional Movement Index (DMI): triangle markers below price
mark whether +DI is above or below -DI, colored by trend strength/slope.
- A DMI status label anchored at the baseline explaining, in plain text,
the current trend state (Bullish/Bearish/Weak/No Trend), the ADX value,
whether it is growing or falling, and how many bars since the last DI
cross.
- Bullish/Bearish DMI trend-change alert conditions.
D) EXPERT TREND LOCATOR (XTL)
- A CCI-style trend classifier (traditional or non-traditional formula)
that can recolor the candlesticks themselves (Bull / Bear / Neutral)
based on a configurable threshold.
E) HULL MOVING AVERAGE (HMA)
- Selectable Hull variant: HMA, EHMA, THMA, or Adaptive HMA (AHMA).
- Long/short cross markers (triangle up/down) when the Hull average
changes direction.
- Optional background tint reflecting the Hull trend direction.
F) MOMENTUM DIVERGENCE ENGINE
- Automatic detection of regular and hidden bullish/hidden bearish
divergence between price and the Momentum oscillator.
- Configurable pivot lookback, "2 pivots back" comparison, and a
repaint-safe "delay until candle closes" option.
- Connector lines and "R"/"H" labels drawn at the correct baseline-mapped
price level.
- Alert conditions for all four divergence types.
G) OVERLAY LAYOUT (shared baseline settings)
- Display Length (bars): how many recent bars the baseline / oscillator
mapping and the Squeeze Dots / DMI triangles are drawn across.
- Placement: Top or Bottom of the visible price range.
- Height: how much vertical price-space the oscillators occupy.
- Vertical Position Adjustment: padding between the baseline and the
actual candle range.
--------------------------------------------------------------------------------
4. INPUT REFERENCE (BY GROUP)
--------------------------------------------------------------------------------
SQUEEZE MOMENTUM
Show Momentum - toggles the Momentum plot.
Color Format - selects one of 5 color palettes (1-5).
Background Off - disables the Momentum-colored background tint.
Momentum Style - Area / Columns / Histogram / Line.
Show Signal - toggles the Signal(Momentum) line.
Show Strength (MOM) - toggles the Momentum Strength cloud/line.
Draw Divergence - master toggle for the divergence engine.
Gray Background for Dark Mode - alternate gray background tint.
Show Squeeze PRO - toggles the Squeeze dots.
Show SQZ Zero Line - draws the flat baseline/zero reference line.
ADX
Show ADX with KeyLevel - toggles ADX + Key Level lines.
Scale for ADX - divisor used to rescale ADX into Momentum units.
Positive/Negative slope colors - ADX line color when rising/falling.
KeyLevel with color - colors the Key Level line by DMI trend instead
of the ADX slope color.
Distance between KeyLevel and 0 - offsets the Key Level line from zero.
Display the colored DMI triangles - toggles the +DI/-DI triangle markers.
Hide DMI Label - hides the plain-text DMI status label.
DMI Label Text Size - Auto/Tiny/Small/Normal/Large/Huge.
(unnamed group, XTL bar coloring)
Use XTL Bars Color - recolors candles per the XTL trend state.
XTL: Trend Up / Neutral / Trend Down - colors for each XTL state.
HULL MOVING AVERAGE
Show (Hull Moving Average) Signal - toggles Hull cross markers.
Background - toggles the Hull-trend background tint.
OVERLAY LAYOUT
Display Length (bars) - lookback window for the baseline mapping AND
the Squeeze Dots / DMI triangle visibility.
Placement - Top or Bottom anchor for the baseline.
Height - vertical space (in "notches") given to the
oscillators.
Vertical Position Adjustment - padding between the baseline and the
recent price range.
SQUEEZE MOMENTUM INDICATOR PARAMETERS (SQZMOM)
MOM Length / Source / Type - Momentum calculation length, price source,
and moving-average engine.
Signal Length - smoothing length for Signal(Momentum).
Squeeze Length / Source - length and source used for the Bollinger Band
/ Keltner Channel squeeze detection.
BB Calculation Type / MultFactor - Bollinger Band moving-average type and
standard-deviation multiplier.
Keltner Channel Calculation Type / Use TrueRange - Keltner Channel
moving-average type and range source.
DIRECTIONAL MOVEMENT INDEX (Colored DMI)
Alert: Bullish/Bearish Trend - enable/disable DMI trend-change alerts.
ADX Smoothing / DI Length - standard ADX/DMI calculation lengths.
Key level for ADX - the ADX threshold considered "trending."
Weak Trend Threshold - the ADX threshold below which trend is
considered absent.
Historical Label Readings - shows the DMI label's reading from N bars
back instead of the current bar.
EXPERT TREND LOCATOR (XTL)
Length / Type / Source - CCI-style calculation length, moving-average
type, and price source.
Threshold Level - the +/- CCI threshold that defines Bull/Bear.
Use the traditional CCI formula - switches between the classic and
non-traditional CCI denominator.
HULL MOVING AVERAGE (HMA)
Length / Type / Source - Hull average length, variant, and price
source.
DIVERGENCES FOR MOMENTUM
Plot Bullish / Hidden Bullish / Bearish / Hidden Bearish - toggle each
divergence type independently.
Delay plot until candle is closed - avoids repainting divergence signals.
Lookback 2 Pivots? - also compares against the pivot two bars back.
Pivot Lookback Right/Left - pivot-detection window.
Min/Max of Lookback Range - how far back (in bars) a divergence pair may
span to still be considered valid.
--------------------------------------------------------------------------------
5. NOTES ON THE "DISPLAY LENGTH (BARS)" SETTING
--------------------------------------------------------------------------------
"Display Length (bars)" (in the Overlay Layout group) controls THREE things
at once:
1. How many historical bars the baseline/oscillator snapshot engine
redraws (Momentum, Strength, Signal, ADX, Key Level, Zero Line).
2. How many recent bars show Squeeze PRO dots above price.
3. How many recent bars show the colored DMI triangles below price.
Anything older than this window is simply not drawn, keeping the chart
readable and staying within TradingView's per-indicator object limits
(500 lines / 500 boxes / 50 labels). Increasing this value shows more
history but uses more of that budget; the input is capped at 100 bars to
leave headroom for all series that can be active simultaneously.
--------------------------------------------------------------------------------
6. ALERTS
--------------------------------------------------------------------------------
- DMI Bullish Trend / DMI Bearish Trend (on trend-state change)
- Regular Bull Divergence / Hidden Bull Divergence
- Regular Bear Divergence / Hidden Bear Divergence
--------------------------------------------------------------------------------
7. QUICK START
--------------------------------------------------------------------------------
1. Add the indicator to a price chart (it renders as an overlay, not a
separate pane).
2. In "Overlay Layout," set Display Length to match how much recent price
history you want the oscillators plotted against, and adjust
Placement/Height/Vertical Position Adjustment until the oscillator
band sits where you want it relative to candles.
3. Enable/disable Momentum, Strength, Signal, ADX, Squeeze Dots, DMI
triangles, and Divergences as needed under their respective groups.
4. Use "Show SQZ Zero Line" if you want an explicit flat reference line
at the baseline.
5. Set up alerts from the DMI or Divergence alert conditions if you want
notifications outside of TradingView.
================================================================================
End of manual.
================================================================================ Gösterge

Coil & Fire - Ashish*Updated version of Momentum Scanner*
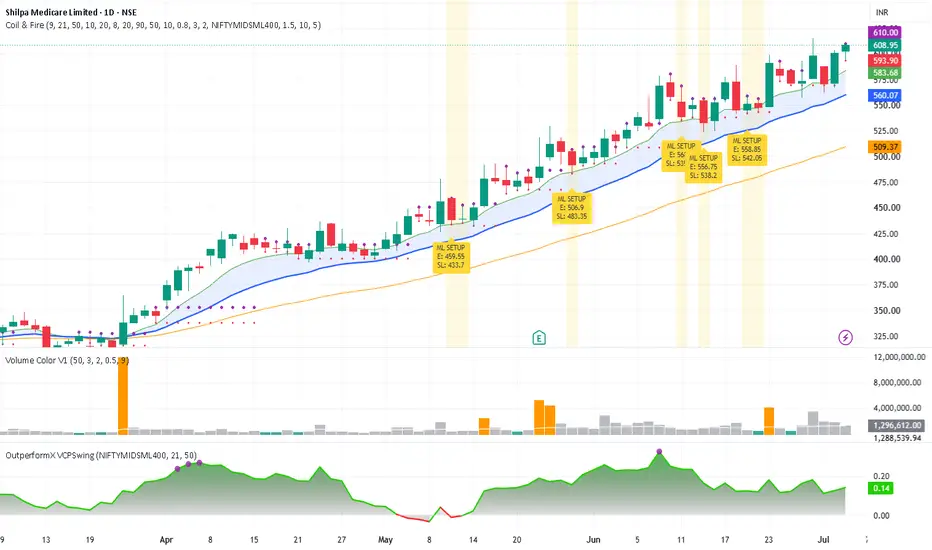
Finds stocks that had a strong explosive move (EP candle), are now coiling quietly near their EMAs, and marks the exact entry and stop-loss levels based on the most recent low-volume healthy-dip candle.
How it works:
Screens for stocks with a recent 8%+ single-day move that are outperforming their benchmark since that move, holding above the EMA9/21 cloud with the trend structure intact, and showing genuinely quiet volume on the pullback. When all conditions align, it marks a teal bar — a low-volume healthy-dip candle sitting within 5% above EMA9. The high of that bar is your entry. The low is your stop-loss. Purple dots show the entry level. Red dots show the stop.
Orange background = price has crossed the entry level. Yellow background = setup is valid, waiting for the trigger.
What's different from Momentum Scanner:
Entry and stop-loss are now anchored to the most recent teal bar rather than a historical coil-high level, so levels are always close to current price. Volume comparison for the teal bar now uses a 10-day average instead of 50-day, making it more responsive to recent trading activity rather than a long historical baseline.
Note: Indicators are tools, not oracles — every signal still requires human judgment, risk management, and context before any trade is taken. Gösterge

Gösterge

Gösterge

Gösterge

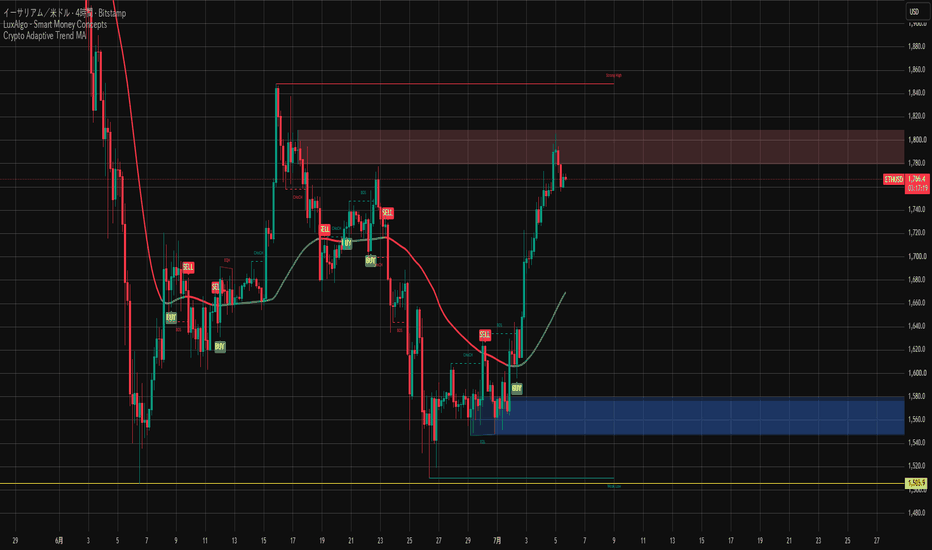
Crypto Adaptive Trend MACrypto Adaptive Trend MA
Crypto Adaptive Trend MA は、BTC・ETHをはじめとする仮想通貨市場のために開発された、適応型(Adaptive)移動平均線インジケーターです。
一般的なEMAやSMAは常に同じ期間で計算されるため、急激なボラティリティ変化が発生しやすい仮想通貨市場では、反応が遅れたり、逆にダマシシグナルが増えたりすることがあります。
このインジケーターは、市場のボラティリティをATR(Average True Range)でリアルタイムに分析し、移動平均線の計算期間を自動で調整します。
トレンドが強い局面では素早く価格へ追従し、レンジ相場では感度を落としてノイズを抑えることで、相場環境に応じた最適なトレンドラインを表示します。
さらに、価格だけでなく移動平均線自体の傾きを利用してトレンド方向を判定するため、単純な価格クロスよりも安定したトレンド判断が可能です。
主な特徴
仮想通貨市場専用に最適化
ATRによる自動適応型移動平均
ボラティリティに応じて期間を自動変更
上昇トレンド・下降トレンドを色で表示
ノイズを軽減しながら高い追従性を実現
BTC・ETH・主要アルトコイン対応
4時間足・日足で特に高いパフォーマンス
BUY / SELLシグナル搭載
TradingViewアラート対応
推奨設定
BTC
ETH
4時間足
日足
推奨期間
Base Length:55
Fast Length:21
Slow Length:144
使用方法
緑色の移動平均線:上昇トレンド
赤色の移動平均線:下降トレンド
BUYシグナル:移動平均線が上向きへ転換
SELLシグナル:移動平均線が下向きへ転換
本インジケーターは、トレンドの方向をシンプルかつ直感的に判断するために設計されています。単独でも使用できますが、サポート・レジスタンスや市場構造分析と組み合わせることで、より精度の高いトレード判断が可能になります。
English
Crypto Adaptive Trend MA
Crypto Adaptive Trend MA is an adaptive moving average indicator specifically designed for cryptocurrency markets, including Bitcoin, Ethereum, and major altcoins.
Traditional moving averages such as EMA and SMA use fixed calculation periods, making them either too slow during strong trends or too sensitive during sideways market conditions. As a result, they often produce delayed signals or excessive market noise.
Crypto Adaptive Trend MA solves this problem by dynamically adjusting its calculation period using the Average True Range (ATR). During periods of high volatility, the moving average becomes more responsive to capture strong trends earlier. During low-volatility or ranging markets, it automatically smooths its calculations to reduce false signals.
Instead of relying solely on price crossing the moving average, the indicator also evaluates the direction and slope of the moving average itself, providing a more stable and reliable trend confirmation.
Features
Optimized for cryptocurrency markets
ATR-based adaptive moving average
Automatically adjusts to market volatility
Dynamic trend coloring
High responsiveness with reduced market noise
Supports Bitcoin, Ethereum, and major altcoins
Optimized for 4H and Daily timeframes
Built-in BUY / SELL signals
TradingView alert support
Recommended Settings
Assets
Bitcoin (BTC)
Ethereum (ETH)
Timeframes
4 Hours
Daily
Recommended Parameters
Base Length: 55
Fast Length: 21
Slow Length: 144
How to Use
Green Moving Average: Bullish trend
Red Moving Average: Bearish trend
BUY Signal: The adaptive moving average turns upward
SELL Signal: The adaptive moving average turns downward
Crypto Adaptive Trend MA is designed to provide a clean and reliable trend-following solution for cryptocurrency traders. While it performs effectively as a standalone indicator, combining it with market structure analysis, support and resistance, or volume confirmation can further improve trading accuracy and confidence. Gösterge
BTC ETH 4H SMC Score SystemBTC & ETH 4H SMC Score System
BTCとETHの4時間足専用に設計された、スマートマネーコンセプト(SMC)をベースとした高精度トレンドフォローインジケーターです。
一般的なSMCインジケーターは多くのシグナルを表示しますが、本インジケーターはノイズを減らし、実際のトレードで使いやすいシグナルだけを表示するよう最適化しています。
市場構造(BOS・CHoCH)を中心に、Order Block、Fair Value Gap(FVG)、EMA50・EMA200、ATR、出来高、RSIを組み合わせ、複数の条件をスコア化します。
条件が一定以上揃った場合のみBUY・SELLシグナルを表示するため、無駄なエントリーを減らし、高確率なトレード機会に集中できます。
主な機能
4時間足専用に最適化
BTC・ETH専用ロジック
BOS(Break of Structure)
CHoCH(Change of Character)
Smart Order Block
Fair Value Gap(FVG)
EMA50・EMA200によるトレンド判定
ATRによるボラティリティフィルター
出来高フィルター
RSIフィルター
BUY / SELLスコアリングシステム(100点満点)
アラート対応
スコアシステム
以下の条件を総合評価し、100点満点でスコアリングします。
トレンド方向
市場構造
ボラティリティ
出来高
RSI
FVG
スコアが設定値以上になった場合のみシグナルを表示します。
推奨設定
Timeframe:4H
Asset:BTCUSD・ETHUSD
Minimum Score:70〜80
このインジケーターは裁量トレードをサポートすることを目的としており、単独での売買ではなく、市場構造・サポートレジスタンス・リスク管理と組み合わせて使用することを推奨します。
BTC & ETH 4H SMC Score System
The BTC & ETH 4H SMC Score System is a professional Smart Money Concepts (SMC) indicator specifically optimized for Bitcoin and Ethereum on the 4-hour timeframe.
Unlike traditional SMC indicators that generate excessive signals, this version focuses on filtering market noise and highlighting only high-probability trading opportunities.
It combines Market Structure (BOS & CHoCH), Smart Order Blocks, Fair Value Gaps (FVG), EMA 50/200, ATR, Volume, and RSI into a comprehensive scoring model.
Instead of generating signals from a single condition, every setup is evaluated using multiple confirmations. Buy and Sell signals are displayed only when the overall score reaches the predefined threshold.
Features
Optimized exclusively for the 4H timeframe
Designed specifically for Bitcoin and Ethereum
Break of Structure (BOS)
Change of Character (CHoCH)
Smart Order Blocks
Fair Value Gaps (FVG)
EMA 50 & EMA 200 trend confirmation
ATR volatility filter
Volume confirmation
RSI momentum filter
100-point Buy/Sell scoring system
TradingView alert support
Scoring System
Each trading opportunity is evaluated using multiple factors:
Trend direction
Market Structure
Volatility
Volume
RSI momentum
Fair Value Gaps
Signals are generated only when the total score exceeds the user-defined minimum score, helping traders avoid low-quality setups and focus on stronger opportunities.
Recommended Settings
Timeframe: 4 Hours
Assets: BTCUSD / ETHUSD
Minimum Score: 70–80
This indicator is designed as a decision-support tool rather than a fully automated trading system. For the best results, combine it with proper risk management, higher-timeframe analysis, and key support/resistance levels. Gösterge

Adaptive S/R Box Zones with Dynamic Stop Loss & EMA FilterTitle: Adaptive S/R Box Zones with Dynamic Stop Loss & EMA Filter
Description:
This indicator is an advanced tool designed to automatically identify key Support and Resistance (S/R) levels by blending momentum, volatility, and structural pivot points. The core objective of the script is to visualize asymmetric risk zones (Stop Loss zones) and filter out false breakouts using an integrated EMA momentum filter.
How it works:
S/R Detection Logic: Levels are not derived from simple highs and lows. The script utilizes a sophisticated algorithm that dynamically combines the RSI (Relative Strength Index) to spot extreme overbought/oversold conditions, a HMA-based CMO (Chande Momentum Oscillator) for momentum confirmation, and historical Close Pivots.
Asymmetric SL Zones (Boxes): Instead of standard symmetric lines that often distort spatial risk, the indicator renders dynamic box shapes. The height of these zones automatically adapts to the market's current volatility using the ATR (Average True Range).
The Resistance Zone expands asymmetrically upward from the level, offering a clear visual map for placing Stop Losses on Short setups.
The Support Zone expands asymmetrically downward from the level, defining the logical Stop Loss area for Long setups.
EMA Momentum Filter & Trigger: The script features an optional EMA crossover filter. When enabled, the detection of a new S/R zone acts as a dynamic "setup alert", while the actual BUY or SELL signal triggers only when the price breaks through the EMA line, confirming directional momentum.
Key Features & Inputs:
Zone Height (ATR Multiplier): Controls the thickness of the risk zones based on market volatility.
S/R Timeframe: Multi-timeframe (MTF) functionality to plot higher time frame levels onto your current chart.
Signal Trigger Mode: Toggle between On Candle Close and After Candle Close (waits for the candle to seal to prevent repainting).
EMA Filter Toggle: Can be fully deactivated if you prefer to receive raw signals immediately upon the formation of S/R levels. Gösterge

Gösterge

VIP Currency Strength MatrixVIP Currency Strength Matrix — Round-Robin Strong-Count (SMA/EMA)
OVERVIEW
This indicator scores the 8 major currencies (EUR, GBP, AUD, NZD, USD, CAD, CHF, JPY) using a round-robin "strong-count" method, then builds a pair-difference matrix so you can see, at a glance, which pairs have the wind at their back and which are fighting it. It is a bias and confluence tool, not an entry signal.
HOW IT WORKS
The 8 currencies form 28 unique pairings. For each pair, the indicator checks whether price is above or below a reference moving average (200 SMA by default):
- Price ABOVE the MA -> the BASE currency earns +1 strong-count.
- Price BELOW the MA -> the QUOTE currency earns +1 strong-count.
Each currency is compared against the other seven, so every currency ends with a strong-count from 0 (weakest) to 7 (strongest).
For any pair, the score shown is:
strong-count(base) - strong-count(quote), ranging from -7 to +7.
- Positive = base is stronger (buy-side confluence).
- Negative = quote is stronger (sell-side confluence).
Cells at or beyond the highlight threshold (default 4) are color-coded green (buy) or red (sell).
WHAT YOU SEE
- Currency Strength table: all 8 currencies ranked 0-7, strongest at the top.
- Pair Matrix: all 28 pairs with their difference score, sorted so the strongest buy-side reads sit at the top and the strongest sell-side reads at the bottom.
HOW TO USE IT
1. Use it to establish directional bias first: favor longs on currencies ranked high, shorts on currencies ranked low.
2. A pair scoring +6 or +7 is strongly one-sided, but "strong" is not the same as "a good entry." Wait for price to reach your own level/structure before acting.
3. Look for agreement, not extremes. Alignment across your timeframes is the read you want.
MULTI-TIMEFRAME
Each copy of the indicator computes ONE timeframe (28 data requests). TradingView caps unique data requests at 40 (non-pro) / 64 (pro), so 28 pairs across several timeframes cannot fit in a single script. To watch multiple timeframes at once, add the indicator to your chart several times, set each copy to a different timeframe, and give each its own table position.
IMPORTANT SETUP NOTES
- Run it on a chart timeframe equal to or lower than the timeframe you request. Requesting a lower timeframe than the chart (e.g. asking for 15m while on a 4H chart) forces a heavy data pull across all 28 pairs and can trigger "Memory limits exceeded." If you see that error, lower "History bars per pair" and/or drop to a lower chart timeframe.
- "Data-feed prefix" must be a feed that carries all 28 pairs, including the crosses (OANDA works well).
INPUTS
- Reference MA type and length (default SMA 200)
- History bars per pair (memory control)
- Data-feed prefix
- Timeframe (one per copy)
- Panel tag, table positions, text size
- Buy/Sell highlight threshold (default 4)
HONEST LIMITATIONS
- A round-robin does not mathematically guarantee 8 unique ranks. Cyclical conditions (A>B, B>C, C>A) can produce a tie, showing a 0 or a repeated rank. Treat a 0 as "no clear edge / choppy," not as a defect.
- Strength above/below a long MA is a slow, trend-following read. It tells you direction and context; it does not time entries.
This script is provided for educational and analytical purposes only. It is not financial advice and makes no representation about future results. Always do your own analysis and manage risk. Gösterge

KRT Kalman Regime Tricolor# 📊 KRT — Kalman Regime · Tricolor
**Designed and statistically validated for 🥇 GOLD and Ξ ETHEREUM.** A regime compass, not a buy signal: KRT reads the market on three layers — background regime, trend, your candle — and shows you which way the wind blows at every moment: 🟢 long · 🔴 short · 🔵 wait.
**⚡ ZERO lookahead, ZERO repaint.** Every signal appears in real time using only the information available at that moment, and whatever is printed at a bar close never changes afterwards. Many indicators look perfect because they quietly redraw the past — KRT is built for the opposite: what you see in replay is exactly what you would have seen live.
## ⚡ Quick start (30 seconds)
The colored BACKGROUND = the underlying regime.
Green 🟢 = bull regime installed → longs carry. Red 🔴 = bear regime installed → shorts carry. No color = no regime → caution.
The CURVE trails price like a stop line: below the candles in an uptrend, above them in a downtrend. Price crossing the curve = the reversal.
The curve's intensity = the strength of the authorization.
BRIGHT = trend aligned with the regime. Pale = secondary bias only. Blue = wait.
THE MARKERS — one single rule:
SOLID green or red marker (big triangle OR diamond) = GO. Blue = wait. Small = provisional.
🟢▲ / 🔴▼ BIG triangle — GO: reversal confirmed AND regime aligned.
🟢◆ / 🔴◆ Diamond — Deferred GO: the regime installs while the trend already points that way (often follows a big blue triangle). Same strength as a big colored triangle.
🔵▲ / 🔵▼ BIG blue triangle — reversal confirmed but no regime behind it → wait (a diamond will tell you if it becomes a GO).
▵▿ Small triangles (any color) — early alerts on your chart, ahead of confirmation. Provisional.
No thinking required: solid + colored = apply your strategy · blue = patience · small = not yet.
Drop it on gold or Ethereum, chart timeframe 5m–15m. Run YOUR strategy on top: KRT gives the direction, you handle entries, stops and exits.
## ⚠️ Before you use it
This is an indicator, NOT a strategy: it provides no entry or exit points.
Validated with permutation tests on gold and Ethereum. On Bitcoin the detection displays but the statistical edge is not demonstrated; on major forex pairs it is absent. Test it yourself before using it elsewhere.
The background regime changes slowly (weeks): that is by design — it filters, it does not scalp.
## 🔍 Understanding the display (going deeper)
THE THREE LAYERS
Regime (background, default 8H) — a slow Kalman trend filter with hysteresis: the background only colors once the regime is installed (default 3 days, adjustable). Locked at its own bar close: it does not flicker and does not repaint.
Trend (curve, default 1H) — the exact price level that would flip the trend filter, computed in advance: the distance between price and curve measures the strength of the trend.
Your candle (the chart) — the curve is monitored at your chart's granularity: you see the flip before the 1H close (small triangles), the close confirms it (big triangles).
HOW TO READ IT
Green background + bright green curve + GO = every layer agrees: the most favorable long context. Mirror in red for shorts.
Pale green curve = uptrend without an installed regime — weak bias.
Pale red curve = intraday "breather" (recurring windows of weakness inside an uptrend) — a short-lived bias, not an invitation to swing short.
Blue = no statistical edge. The best trade is often no trade.
After a bullish GO, price often retests the curve before continuing: aim for the retest rather than the impulse.
TIMEFRAMES & SETTINGS
Chart from 1m to 1H (5m–15m recommended).
Trend TF / Regime TF: the only settings an advanced user may change (swing trading: 4H/D).
Regime installation age (default 72h): higher = rarer, more reliable background; lower = more reactive, more false regimes.
Everything else (q values, thresholds, windows): the calibrated and validated core of the model — keep the defaults.
---
KRT is a decision-support tool based on historical data. Past performance does not guarantee future results. Manage your risk. Gösterge

Gösterge

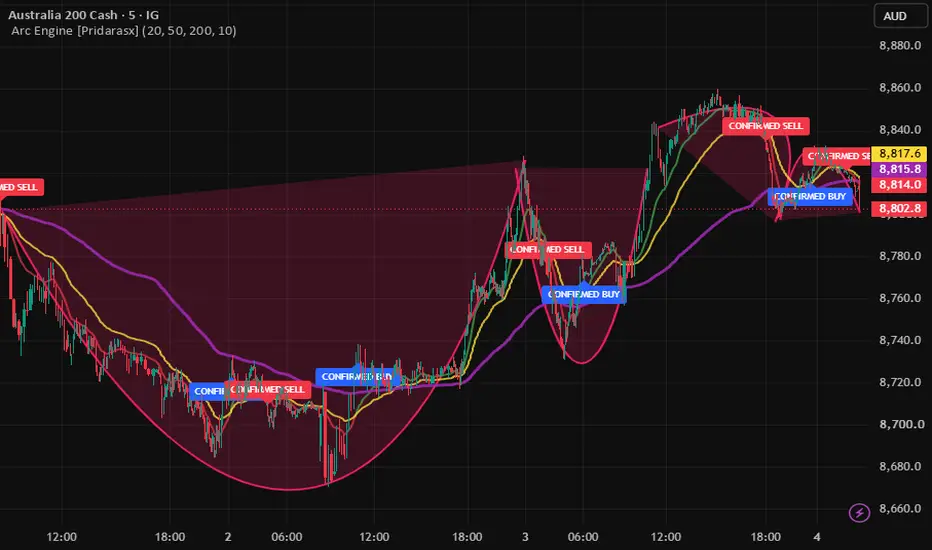
Arc Engine
Executive Summary
Arc Engine - is a high-performance, non-repainting quantitative trading script engineered specifically for intraday market structures. The engine is architected to exploit the fractal geometry of financial markets by tracking systematic cycles of expansion and contraction (represented visually as macro structural "arcs").
By mapping the footprints of high-frequency trading (HFT) models and institutional order execution routing, the engine isolates structural exhaustion zones, filters out toxic market noise, and targets explosive breakouts with mechanical precision.
Core System Architecture & Multi-Layer Logic-
The engine structures market data into a clean, hierarchical multi-layered framework designed to eliminate emotional bias and lag:
LAYER 1: THE MACRO BASELINE ANCHOR (200 EMA) |
| Defines the structural environment (Dominant Cycle Slope) |
+------------------------------------------------------------+
│
▼
+------------------------------------------------------------+
| LAYER 2: INSTITUTIONAL RIBBON MATRIX (20 EMA / 50 EMA) |
| Maps short-to-medium term value capture & contraction zones|
+------------------------------------------------------------+
│
▼
+------------------------------------------------------------+
| LAYER 3: CLEAN BREAKOUT FILTER (Execution Trigger) |
| Enforces strict structural clearance rules (No Fake Wicks) |
+------------------------------------------------------------
1. The Macro Baseline Anchor (Layer One)
At the core of the engine sits the 200-period Exponential Moving Average (EMA). Serving as the system's "gravitational center," this line distinguishes between macro expansion and structural mean reversion. In a heavy downward cycle or macro arc formation, this boundary represents the institutional ceiling where short-sellers repeatedly defend liquidity.
2. The Institutional Ribbon Matrix (Layer Two)
The intermediate structural behavior is governed by a smoothed ribbon matrix comprising the 20 EMA (Fast Line) and 50 EMA (Slow Line).
The Squeeze Zone: When these lines compress, flatten, and twist, the engine identifies a low-volatility compression zone (e.g., Wave 2 or Wave B structures).
The Expansion Phase: When the ribbon fans out with a steep slope, it confirms true algorithmic momentum (e.g., Wave 3 or Wave C expansions).
3. The Clean Breakout Filter (Layer Three)
To mitigate the risk of algorithmic "liquidity hunts" (where market makers intentionally trigger retail stops via volatile wicks before reversing price), the engine abandons standard line crossovers.
Execution requires a Clean Candle Breakout:
Long Trigger: The entire body (both the open and the close) of the execution candle must clear completely above the highest boundary of the Ribbon Matrix.
Short Trigger: The entire body of the candle must close completely below the lowest boundary of the Ribbon Matrix.
Algorithmic State Control & Execution Mechanics
Signal Pruning & Noise Reduction
To avoid the mathematical trap of "signal stacking" during high-volatility expansions, the script utilizes a strict persistent state variable architecture (last Signal Direction).
Execution Framework-
The engine is highly optimized for lower timeframes (such as the 1-minute, 2-minute, or 5-minute charts) to capture micro-turns with minimal drawdown.
By implementing the bar state is confirmed runtime condition, the engine evaluates execution rules exclusively at the exact millisecond a bar closes. This mathematically eliminates historical repainting, ensuring back testing performance matches live execution identically.
Gösterge

Gösterge

Gösterge

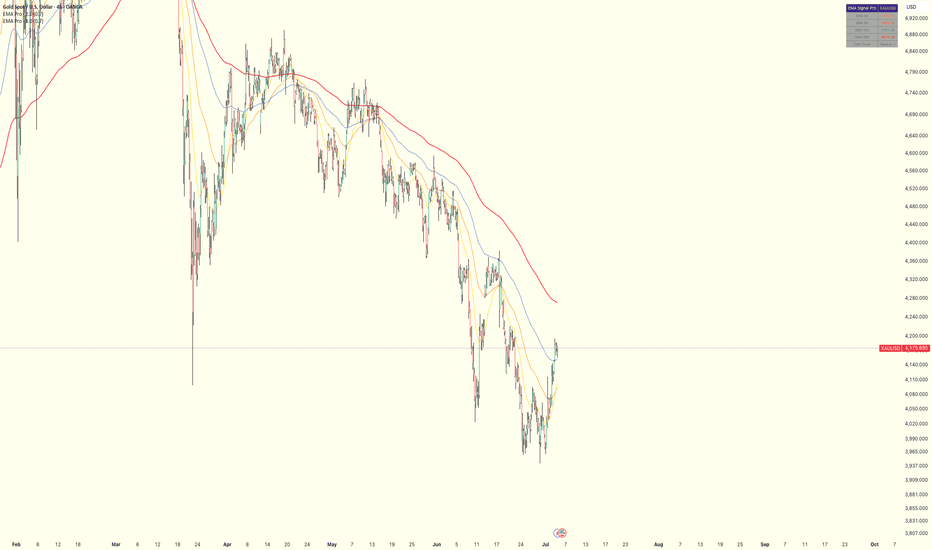
EMA ProEMA Pro
- Overview
EMA Signal Pro is a professional trend-following signal indicator built around the combination of EMA 200 breakout detection and EMA alignment confirmation.
Instead of generating signals from every price movement, the indicator waits for multiple conditions to align before issuing a trade signal. This approach helps filter out many low-probability setups and focuses on stronger trend continuation opportunities.
The indicator works independently on all TradingView timeframes, making it suitable for scalping, intraday trading, swing trading, and long-term investing.
- Signal Logic
LONG
A LONG (Buy) is generated only when all three conditions below are met simultaneously.
1️⃣ EMA 200 Bullish Breakout
The current candle must break above the EMA 200.
This means:
The previous candle closed below EMA 200.
The current candle closes above EMA 200.
This confirms that price has crossed the primary long-term trend line.
2️⃣ Bullish Candle Structure
The breakout candle must have:
Lower wick larger than the upper wick
This indicates rejection of lower prices and strong buying pressure during the breakout.
3️⃣ Bullish EMA Alignment
The exponential moving averages must be aligned as follows:
EMA 20 (Highest)
EMA 50
EMA 100
EMA 200 (Lowest)
This alignment confirms that short-, medium-, and long-term trends are all pointing in the same bullish direction.
SHORT
A SHORT (Sell) is generated only when all three conditions below are met simultaneously.
1️⃣ EMA 200 Bearish Breakout
The current candle must break below the EMA 200.
This means:
The previous candle closed above EMA 200.
The current candle closes below EMA 200.
2️⃣ Bearish Candle Structure
The breakout candle must have:
Upper wick larger than the lower wick
This indicates rejection of higher prices and strong selling pressure.
3️⃣ Bearish EMA Alignment
The EMAs must be aligned as follows:
EMA 200 (Highest)
EMA 100
EMA 50
EMA 20 (Lowest)
This confirms a strong bearish trend across multiple market horizons.
Only when all three conditions occur together will a SHORT signal be generated.
Moving Averages Used
EMA Period Purpose
EMA 20 20 Short-term trend
EMA 50 50 Medium-term trend
EMA 100 100 Medium-to-long-term trend
EMA 200 200 Primary long-term trend and breakout reference
-Customization
Display Options
Show or hide EMAs
Customize the color of each EMA individually
-Best Practices
Compatible with all TradingView timeframes, from 1-minute to Monthly charts.
Signals are generated only after candle close, preventing repainting during candle formation.
For optimal performance, combine this indicator with proper risk management and stop-loss placement.
The best results are typically achieved on higher timeframes, such as 1H, 4H, and Daily charts.
Designed primarily for trending markets. During sideways or ranging conditions, fewer signals are produced, helping reduce unnecessary trades.
© EMA Pro — All Rights Reserved
Gösterge
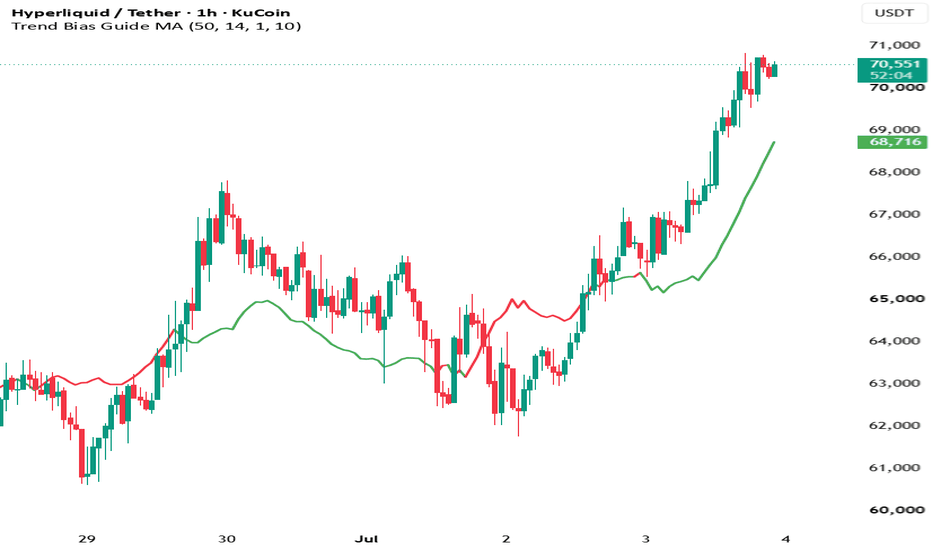
Trend Bias Guide MATrend Bias Guide MA
OVERVIEW
Trend Bias Guide MA is a smoothed reference line that shows which side (bullish or bearish) has been dominating recent price action, and helps spot early signs of trend exhaustion through divergence between price and candle-body pressure.
Unlike a standard moving average, this line is not derived from price itself. It is derived from the net directional pressure of individual candles over a lookback window, then projected onto the chart at a visual offset from price using ATR, so it never overlaps the candles.
WHAT IT IS BUILT FROM
For every candle in the lookback window (default: 50 candles), the script measures (close − open). This value is positive for a bullish candle and negative for a bearish candle, and its magnitude reflects the size of that candle's body.
These values are summed across the whole lookback window into a single number, referred to here as the net bias:
net bias = Σ (close − open) over the last N candles
This sum captures two distinct effects at once:
1. Count imbalance: whether there were more bullish or more bearish candles in the window.
2. Size imbalance: whether the bullish or bearish candles had larger bodies on average.
Both effects move price in the same underlying way, and summing (close − open) candle by candle combines them automatically, without needing to calculate them separately. If the net bias is positive, bullish pressure has dominated the window; if negative, bearish pressure has dominated.
HOW THE LINE IS DRAWN
- If the net bias is negative (bearish), the line is plotted above price, at a distance of (ATR × multiplier) above the current high.
- If the net bias is positive (bullish), the line is plotted below price, at a distance of (ATR × multiplier) below the current low.
- ATR length and multiplier are both adjustable inputs (defaults: ATR length 14, multiplier 1.0), and control how far the line sits from price.
- The raw level is then smoothed with a simple moving average (default length: 10) to reduce short-term noise and produce a cleaner, more continuous line instead of a jagged one.
- The line changes color to match its current bias: green when below price (bullish), red when above price (bearish).
INPUTS
- Lookback Length (default 50): number of candles used to calculate the net bias.
- ATR Length (default 14): period used for the ATR calculation that sets the offset distance.
- ATR Multiplier (default 1.0): scales the offset distance from price.
- Smoothing Length (default 10): period of the moving average applied to the final line.
HOW TO INTERPRET IT
- Green line below price: bullish pressure has dominated over the lookback window.
- Red line above price: bearish pressure has dominated over the lookback window.
- This is a trailing, lookback-based measure. Like any indicator built on a moving window, it reacts with a delay relative to the current candle — it will not flip instantly at the exact start of a new trend, and generally needs enough new candles in the new direction to outweigh the older ones still inside the window.
HOW TO USE IT
This indicator is designed as a contextual reference, not as a standalone entry or exit signal. Two practical uses:
1. Trend context: at a glance, see whether recent price action has been dominated by bullish or bearish candles, without needing to eyeball candle sizes manually.
2. Divergence / exhaustion warning: watch for cases where price is trading above a rising average (e.g., an EMA, not included in this script) while this line is still red (or below a falling average while the line is still green). This mismatch between price direction and underlying candle pressure can flag weakening trend conviction. In backtesting on XAUUSD (17 years of hourly data), this type of divergence was associated with a meaningfully higher chance of the trend reversing within the following 24–72 hours compared to the general baseline, with the effect strongest in the 24-hour window and gradually fading over longer horizons.
LIMITATIONS
- This is a descriptive/contextual tool, not a predictive trading signal on its own. It shows what has already happened over the lookback window, and any forward-looking use (such as the divergence behavior described above) carries no guarantee of repeating in the same way in the future or on other symbols/timeframes.
- Being lookback-based, the line inherently lags price, in the same way any moving average or rolling calculation does.
- It does not include stop-loss, take-profit, or position-sizing logic of any kind. It is a visual reference only.
- Backtested divergence statistics referenced above were derived from historical XAUUSD data and should not be assumed to hold with the same magnitude across all instruments, timeframes, or market regimes. Users should validate behavior on their own instrument and timeframe before relying on it. Gösterge
CTZ Cycle Trader v1.6 CTZ Cycle Trader
A complete multi-asset cycle timing system that automatically detects Daily, Weekly, Yearly and Long Cycle lows, projects when the next lows are due, and tells you exactly where you are in every cycle at a glance.
WHAT IS CYCLE THEORY
Markets don't move randomly — they breathe in rhythmic cycles of accumulation and decline, each measured from one low to the next. Cycle analysis tracks these rhythms across nested timeframes: short daily cycles sit inside larger weekly cycles, which sit inside yearly and multi-year cycles. When several cycle lows fall due in the same zone, the biggest turning points form. This indicator automates the entire process that cycle traders have historically done by hand.
THE FOUR CYCLE TIERS
Daily Cycle Lows (DCL) — the short-term rhythm, your timing tool for swing entries. Each confirmed low prints with the day count of the completed cycle so you can track rhythm and symmetry at a glance.
Weekly Cycle Lows (WCL) — the medium-term structure. Marked with the week count between lows, these are the reversals that define swing and position trades.
Yearly Cycle Lows (YCL) — the macro turning points that anchor longer-term positioning.
Long Cycle Lows — the generational lows. Four years on Bitcoin and equities, eight years on gold, configurable for any asset.
MULTI-ASSET BY DESIGN
Every market has its own heartbeat, and the indicator maps to each one. Three modes in settings:
Auto-Detect — recognises the chart symbol and loads the right cycle lengths automatically. Bitcoin and Ethereum run 54–66 day daily cycles and 24–34 week weekly cycles with the 4-year long cycle. Stock indices (SPX, NDX, DJI) run 36–44 days and 22–31 weeks. Gold and silver run 22–28 days, 20–26 weeks and the 8-year long cycle.
Asset Class — pick Stocks, Metals, Bitcoin/Crypto, Forex or Energy from a dropdown and the full profile applies to any chart.
Manual — set every range yourself for fine-tuning or unusual assets.
SMART CONFIRMATION LOGIC
Lows aren't guessed — they're confirmed. A potential low becomes confirmed only when price recovers above the confirmation average. If price later breaks below a confirmed low, it's cancelled, and the marker relocates to the true low when it forms. Lower lows within a cycle window always supersede, so markers end up on the real bottom, not the first bounce.
FUTURE CYCLE LOW WINDOWS
The core edge: the indicator projects forward timing windows showing where the next DCL, WCL and Long Cycle low are statistically due — as chart zones and as actual date ranges on the dashboard, e.g. "Next WCL due: 24 Jul – 02 Oct". You know in advance when to be patient and when to be paying close attention.
LIVE DASHBOARD
Always-on panel showing your position in every cycle simultaneously: days since the last DCL, weeks since the last WCL, YCL and long cycle low, pending unconfirmed lows, whether price is currently inside a timing window, and the projected due dates for the next weekly and long cycle lows.
HOW TO USE IT
Apply to the daily timeframe. Check the dashboard to orient yourself — early in a cycle favours holding with the trend; late in a cycle, tighten risk and watch for the window. When price enters a timing window, watch for a swing low to form and confirm — that's the highest-probability turning zone. The real power is confluence: when a daily window opens inside a weekly window, and the weekly sits inside a long cycle window, the nested structure is pointing at a major low. Alerts cover confirmed and cancelled lows and window entries, so the indicator watches the clock while you live your life.
Best on daily charts. Works on crypto, indices, metals, forex and commodities.
DISCLAIMER
Cycle windows are probability zones based on historical rhythm, not guarantees. This indicator is for educational and research purposes and is not financial advice. Always do your own research and manage risk.
Gösterge

Bryy's Context PanelBryy’s Context Panel is a compact multi-symbol market context panel built to help traders monitor broader market and sector alignment without leaving their main execution chart.
The indicator checks selected symbols against configurable moving averages and adaptive VWAP, then displays a simple visual status for each metric:
✓ = price is above the selected metric
✕ = price is below the selected metric
- = data is unavailable or the metric is not applicable
The default use case is staying on a futures execution chart while monitoring external ETF context such as SOXX, QQQ, and SPY. This can help traders quickly see whether semiconductor, Nasdaq, and broad-market context are aligned or conflicting.
Main Features:
• Monitor up to 5 custom symbols
• Default focus on SOXX / QQQ / SPY market context
• Configurable SMA or EMA
• Three customizable moving average slots
• Optional custom timeframe per moving average
• Adaptive VWAP logic:
- Intraday charts: RTH Daily VWAP
- Daily charts: Week-Open VWAP
- Weekly charts: Month-Open VWAP
- Monthly+ charts: VWAP hidden in Auto mode
• Horizontal or vertical panel layout
• Adjustable panel size and placement
• Dark, light, and custom color themes
• Designed to be lightweight, clean, and fast
Intended Use:
This indicator is designed as a context scanner, not a buy/sell signal system.
It is meant to help answer questions like:
• Is SOXX supporting or fighting the trade idea?
• Is QQQ aligned with the current futures move?
• Is SPY confirming broader market direction?
• Are key context symbols above or below their short-term, medium-term, and longer-term reference levels?
The goal is to provide quick external market context while keeping the main chart clean.
Important Notes:
For US ETF symbols, the scanner is designed around regular-session context. When used outside regular market hours, values may reflect the most recent regular-session data depending on TradingView’s symbol/session handling.
VWAP depends on volume, so ETF symbols are generally better suited than non-volume index symbols for this tool.
This script does not predict price movement, generate entries, or provide financial advice. It is intended to support discretionary analysis by showing clear market context in a compact panel. Gösterge