Long
Long
 Long
Long
Long 
S&P 500 at Potential Reversal Zone—Is a Bigger Correction Next?The S&P 500 ( FOREXCOM:SPX500 ) reacted strongly to the recent support zone($7,463-$7,430) and Support Lines, which led to another bullish move. However, the index is currently trading near the key trading level of $7,500 and the Potential Reversal Zone (PRZ) .
From an Elliott Wave perspective, Wave C appears to have been completed through an Ending Diagonal pattern. The lower trendline of this pattern has already been broken, and the S&P 500 is currently pulling back to retest it.
I expect the S&P 500 to break below the support zone($7,463-$7,430) and support lines in the coming sessions and decline at least toward the $7,413 level.
Target: $7,413
Stop Loss(SL): $7,548
Note: Since tensions in the Middle East continue to escalate, any related news could have an immediate impact on the S&P 500. Therefore, be sure to monitor geopolitical developments closely and manage your risk carefully.
Note: If the S&P 500 begins to decline with strong bearish momentum, it could have a rapid and direct impact on the cryptocurrency market, especially Bitcoin ( BINANCE:BTCUSDT ).
What’s your view on the S&P 500? Do you think it can print new all-time highs again, or should we expect a deeper correction?
💡 Please respect each other's opinions and express agreement or disagreement politely.
📌 S&P 500 Index Analyze (SPX500USD), 4-hour time frame.
🛑 Always set a Stop Loss(SL) for every position you open.
✅ This is just my idea; I’d love to see your thoughts too!
🔥 If you find it helpful, please BOOST this post and share it with your friends.  Short
Short
Market Summer Volatility Leads to OpportunityThe market recently pushed to new highs in June and is now undergoing what I would describe as a correction in time, with price consolidating in a choppy, sideways range rather than experiencing a meaningful decline. This type of price action often serves to reset sentiment and momentum while allowing moving averages and other technical indicators to catch up with price.
I've seen many traders calling this a local top, while others believe the current structure resembles a diamond or triangle pattern that is setting up for a significant breakout—or breakdown. While those scenarios are certainly possible, I believe it's important to consider the broader market context rather than focusing solely on the pattern itself.
From a seasonal perspective, July has historically been one of the stronger months for equities. Looking at long-term market statistics, the Nasdaq has typically delivered positive returns during July, with an average gain of approximately 2%. Although seasonality should never be used in isolation, it can provide a valuable tailwind when combined with a favorable technical setup.
The scenario I currently favour is a brief fake-out that traps both buyers and sellers on the wrong side of the market before the primary trend resumes. A pullback toward the Anchored VWAP from the March low would represent a healthy retracement within the broader uptrend while providing an area where institutional buying interest could emerge. This level also aligns closely with the Nasdaq's most recent swing low established in early June, creating a compelling area of technical confluence.
From an Elliott Wave perspective, the current consolidation also has the characteristics of a combination correction. Rather than correcting primarily through price, the market appears to be correcting through both time and structure, frustrating participants with prolonged sideways movement before potentially continuing the larger impulsive trend. This type of correction often creates uncertainty, which is precisely why false breakouts and breakdowns become increasingly common as the pattern matures.
Overall, I believe this pullback could present an attractive opportunity to establish a long position in the Nasdaq if the scenario unfolds as expected. For traders using TQQQ, a stop-loss of approximately 10%—roughly equivalent to a 3% move in the Nasdaq offers a reasonable level of risk. If the correction completes and the market rotates back toward its all-time highs during the summer months, the setup could offer a favorable risk-to-reward profile, with upside potential in the range of 20–30% on TQQQ.
 Long
Long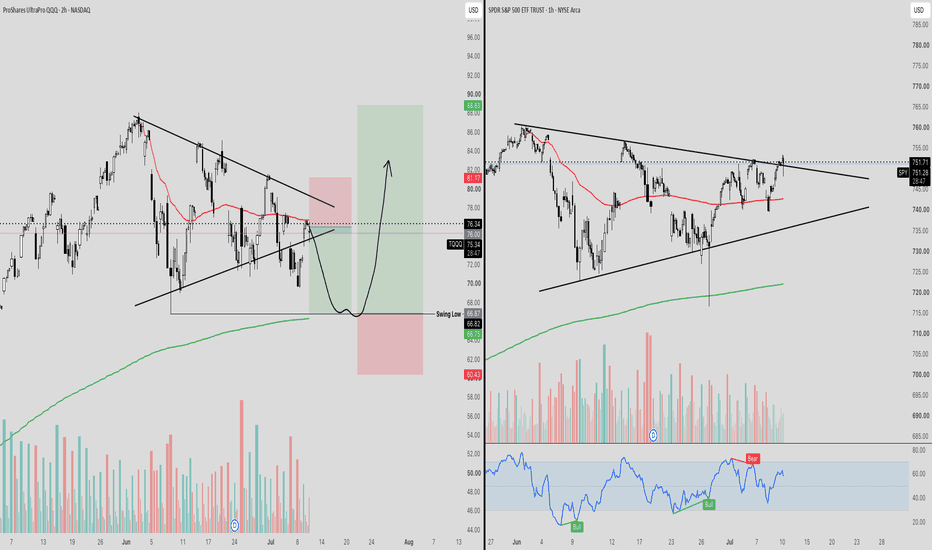
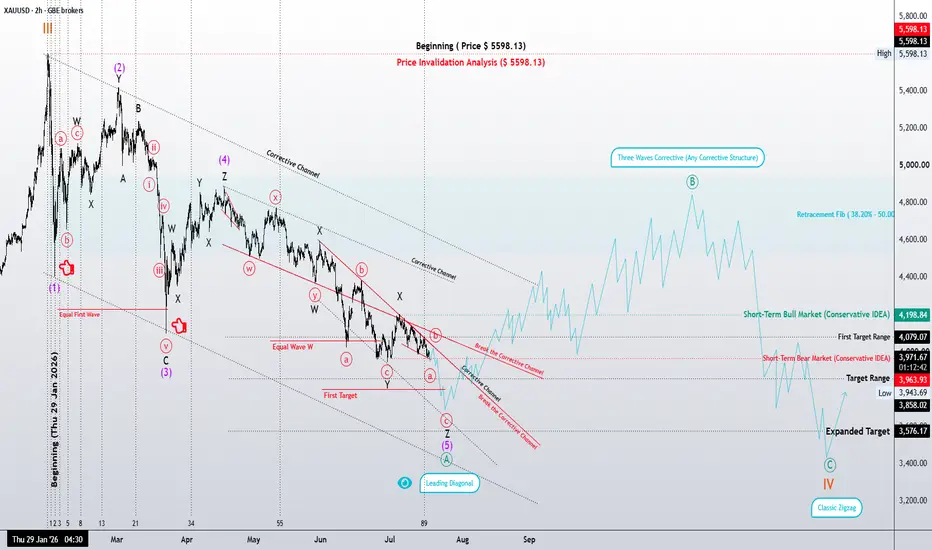
Gold | One More Wave… or Has Wave B Already Begun?XAUUSD | 2H Elliott Wave Update
According to the higher-degree Weekly and Daily wave counts, Gold continues to develop Wave IV. This analysis is based on the Elliott Wave Principle, following both its core rules and structural guidelines while focusing on market structure rather than price prediction.
The primary focus of this update is a Leading Diagonal, currently identified as part of Wave A. Price has now reached a region where this structure may be complete. However, until the market provides structural confirmation, the Leading Diagonal cannot be considered finished with certainty.
According to the Elliott Wave Principle, Waves 2 and 4 within a Leading Diagonal must unfold as Zigzag corrections, whether single, double, or triple. Likewise, Waves 1, 3, and 5 may develop either as Impulses or as Zigzags, with those Zigzags also appearing in single or multiple forms.
At the current stage, Wave 5 of the Leading Diagonal is displaying signs of structural complexity. Therefore, two scenarios remain equally valid. The first suggests that the Leading Diagonal has already been completed and the market is ready to begin Wave B. The second assumes that one final minor decline—or a brief capitulation move—is still required before the diagonal can be considered complete.
From a structural perspective, a confirmed breakout above the descending corrective channel would provide the first meaningful evidence that Wave B has begun. Until then, additional downside movement within the current structure remains a valid possibility.
Once the Leading Diagonal is confirmed complete, the preferred scenario is for Wave B to unfold, followed by Wave C, ultimately completing Wave IV as a classic A–B–C Zigzag. Fibonacci retracement levels may help identify potential reversal zones, but in this analysis, market structure always takes precedence over price ratios.
Research Notes
One observation that has repeatedly caught my attention is the visual similarity between some Leading Diagonals and Triple Zigzags. In several markets, I have seen price confined within converging trendlines, initially appearing to be a textbook Leading Diagonal. However, as the structure matured, it became evident that the market was actually developing a Triple Zigzag.
This occurs because multiple Zigzags can sometimes produce a wedge-like appearance. For that reason, visual pattern recognition alone is never sufficient. The internal wave relationships and the structural rules of the Elliott Wave Principle remain the decisive factors.
Another key element is the relationship between Gold and the U.S. Dollar Index (DXY). Although these markets generally maintain an inverse correlation, historical observations suggest that this relationship is not always constant. There have been periods in which Gold continued building a bullish structure despite a rising Dollar Index. In such situations, one market appears to be correcting through time, while the other progresses toward a price objective.
For this reason, I place greater emphasis on wave structure and price behavior than on traditional intermarket correlations alone.
Unless the market proves otherwise, my preferred expectation remains unchanged: once the Leading Diagonal is complete, Wave B should develop first, followed by Wave C, ultimately completing Wave IV as a classic Zigzag correction.
Price is the outcome; Structure is the cause.
Patterns whisper. I listen.
— Mr.Nobody
Gold Spot / U.S. Dollar
7 days ago
Gold | One More Wave… or Has Wave B Already Begun?
Gold Spot / U.S. Dollar
May 17
Gold 4H: Leading Diagonal or Just the Beginning?
 Long
Long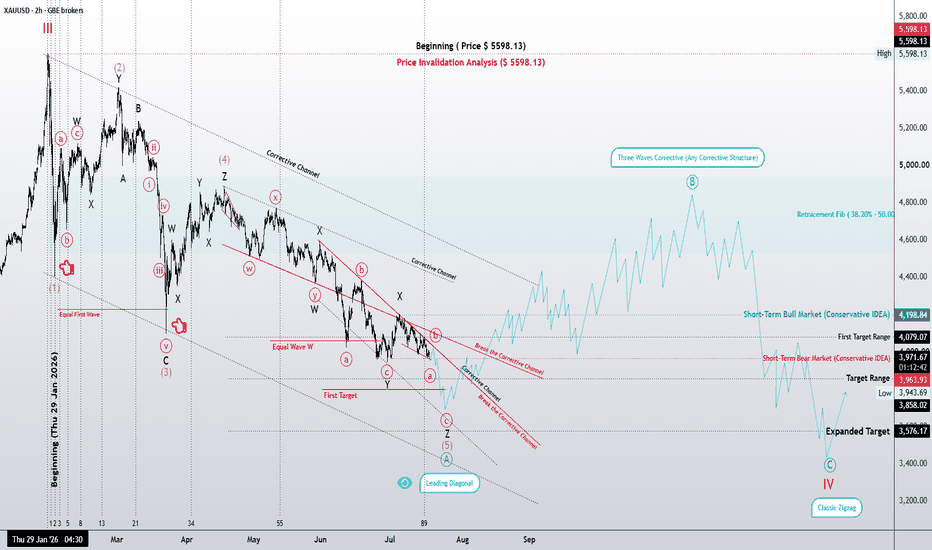
S&P 500 at All-Time High — Is a Major Correction Next?The S&P 500 ( CAPITALCOM:SPX500 ) is currently trading near its All-Time High(ATH=$7,625) and continues to move within a resistance zone($7,625-$7,524).
From a classical technical analysis perspective, the S&P 500 appears to be forming a Rising Wedge pattern, which is generally considered a potential reversal pattern.
From an Elliott Wave perspective, it also appears that the S&P 500 has completed Wave C, resulting in a Zigzag corrective(ABC/5-3-5).
Also, we can see negative Regular Divergence(RD-) between consecutive peaks.
Additionally, on the 4-hour timeframe, with about one hour remaining before the candle closes, a Shooting Star pattern appears to be forming, which could be another signal of a potential reversal in the S&P 500 Index.
I expect the S&P 500 to decline, with an initial target of around $7,515. If this key support level is broken, we could see a much deeper correction in the index.
First Target: $7,515
Second Target: $7,476
Stop Loss(SL): $7,626
Note: If the S&P 500 begins to decline with strong bearish momentum, it could have a rapid and direct impact on the cryptocurrency market, especially Bitcoin ( BINANCE:BTCUSDT ).
What do you think? Is the S&P 500 likely to make new all-time highs, or should we expect a broader correction in the U.S. stock market, particularly in the S&P 500?
💡 Please respect each other's opinions and express agreement or disagreement politely.
📌 S&P 500 Index Analyze (SPX500USD), 4-hour time frame.
🛑 Always set a Stop Loss(SL) for every position you open.
✅ This is just my idea; I’d love to see your thoughts too!
🔥 If you find it helpful, please BOOST this post and share it with your friends.
Short 
EURGBP Update: Remains Under Bearish Pressure Within An ImpulseEURGBP is moving nicely lower as anticipated back in May and June, continuing the expected decline after completing the previous corrective structure. The pair is now developing the final wave E, which can take some time to complete, as wave E is expected to unfold in a three-wave (A)(B)(C) structure.
Following the completion of the wave (B) bearish triangle pattern, EURGBP has started a strong decline within the projected wave (C) of E. The current downside structure suggests there is still room for further weakness, with the 0.8400–0.8300 area becoming an important potential target zone. This move could unfold through a lower-degree five-wave bearish impulse, completing the final stages of the larger corrective pattern.
On the 4H chart, EURGBP continues to extend lower as expected on July 1st, but currently it can be making a higher degree abc correction in wave 4, which could retrace the price back toward the ideal 38,2% Fibonacci retracement and 0.8545 resistance area before the next leg lower begins within wave 5.
As long as the broader bearish structure remains intact, any recovery should be viewed as corrective rather than a trend reversal.
XAUUSD: Wave 5 Downside Still Has Room to ExtendGold is still trading under bearish pressure after breaking below the short-term structure. From Kelly’s view, the current recovery looks more like a corrective bounce inside a bearish Elliott sequence, not a confirmed reversal yet.
The key idea is simple: gold may retest resistance first, but as long as price stays below the sell zone, the wave 5 downside scenario remains active.
⟡ Market structure
The chart shows gold broke down from the previous support area and pushed into the lower Fibonacci extension zone. Price has reacted from the 3,975 buy scalping area, but the rebound remains limited while gold trades below the 4,027 sell zone.
The current price is around 3,997, showing a small recovery after the breakdown. However, this recovery is still under resistance. If sellers defend the 4,020–4,027 area, gold may continue lower towards the 3,943 support zone, where the chart marks the possible end of wave 5.
The higher OB sell zone around 4,062 remains the key area where the bearish structure would be seriously tested.
➤ Key levels
◌ 3,975: buy scalping reaction zone
◌ 3,997: current price reaction area
◌ 4,020–4,027: sell zone and wave 4 resistance
◌ 4,062: OB sell zone and major resistance
◌ 3,943: support / Fibonacci 1.618 / possible wave 5 end
◌ Above 4,062: area where the bearish setup weakens
⌁ Elliott Wave view
From an Elliott Wave perspective, gold appears to be forming a bearish 5-wave structure after the breakdown.
Wave 1 started the first bearish move from the upper area.
Wave 2 corrected back into resistance but failed to continue higher.
Wave 3 pushed price sharply lower through support.
Wave 4 may now be forming as a short corrective rebound.
If the 4,020–4,027 sell zone holds, wave 5 may continue towards 3,943.
This is why Kelly would not chase buy too early. The current bounce is still below resistance, and the larger short-term structure remains bearish.
▸ Trading scenario
Preferred scenario: wait for price to retest the 4,020–4,027 sell zone and show bearish confirmation.
Sell zone: 4,020–4,027 if rejection appears
Stop loss: above the confirmed rejection high or above 4,062
Take profit 1: 3,975
Take profit 2: 3,960
Take profit 3: 3,943
Alternative scenario: if gold breaks above 4,027 and continues above 4,062 with strong acceptance, the bearish wave 5 setup weakens. In that case, the market may move into a larger corrective recovery before the next structure becomes clear.
⌁ Kelly’s view
For Kelly, this is still a bearish intraday setup. Gold has reacted from the lower zone, but price has not reclaimed the sell zone yet.
The cleaner plan is to wait for the retest. If sellers defend resistance, wave 5 may continue towards the Fibonacci support below.
Gold is trying to bounce.
But below 4,020–4,027, the downside structure still has priority.
Share your view below. Short 
Don't Short Crude Oil Yet. One More Rally Could Come First. The next move in crude oil could catch many traders on the wrong side of the market. Instead of breaking down immediately, the chart suggests there may be one last bullish push before sellers regain control.
Previous Outlook Played Out as Expected
Before discussing the current setup, let's briefly revisit the previous outlook.
On the 4-hour timeframe, crude oil was expected to complete a larger corrective structure that would eventually drive price toward the $68–70 support region. The analysis was based on an Elliott Wave count that anticipated the completion of Wave (C), with additional confluence coming from an unfilled gap located within the same area.
As price continued to decline throughout June, the market respected the projected wave structure and eventually reached the highlighted support zone. The gap was successfully filled, and buying pressure quickly emerged, marking what appears to be the completion of the corrective cycle.
With that larger bearish objective now achieved, the market structure has shifted from looking for downside continuation to identifying the next impulsive advance.
--
With the previous bearish target completed, the focus now shifts to the current price structure on the 1-hour timeframe, where crude oil appears to be developing another Elliott Wave sequence.
--
Current Outlook: One More Rally Before a Larger Correction?
Following the strong rebound from the early July lows, crude oil appears to have completed Wave (3) and is currently consolidating in what may be a Wave (4) triangle. Rather than signaling immediate weakness, this consolidation could simply represent a pause before one final push higher.
If the current wave count remains valid, price may rally toward the $84–85 zone, where Fibonacci projections and an unfilled gap converge. This area could become an attractive region for Wave (5) to terminate before a larger corrective decline unfolds.
Alternative Scenario
While the primary outlook continues to favor the completion of a Wave (4) consolidation before one final rally, traders should also remain aware of an alternative scenario. If crude oil fails to hold the current support region and breaks below the Wave (4) invalidation level, the market could instead complete a deeper ABC correction first. Such a pullback would likely target the 38.2%–50.0% Fibonacci retracement zone before buyers attempt another impulsive advance toward the projected Wave (5) objective.
 Long
Long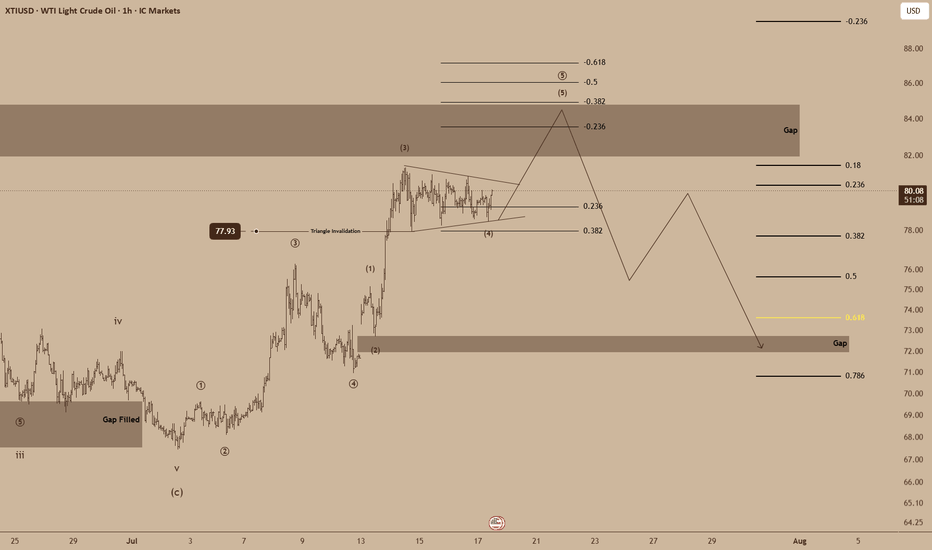
 Long
Long
GOLD - The hunt for liquidity before the fall to 3900...FX:XAUUSD has completely unwound the bullish momentum generated by the recent news and has printed fresh local lows. The market remains in both a local and broader bearish trend, driven by persistent fundamental and geopolitical uncertainty
Gold continues to trade under pressure, with sellers firmly in control. The next key catalysts will be the U.S. Consumer Sentiment and Inflation Expectations reports. The technical outlook remains bearish, with price making new local lows while still holding above the key 3960 support area. Before the broader decline resumes, the market may enter a liquidity sweep phase, with downside potential extending toward 3940–3900.
Bearish drivers: Escalation of geopolitical tensions, Rising oil prices and a stronger U.S. dollar, Hawkish Federal Reserve rhetoric, Strong U.S. economic data
Bullish drivers: Geopolitical de-escalation, Weaker-than-expected consumer sentiment data, End-of-week profit-taking
Resistance levels: 4028, 4043, 4065
Support levels: 3960, 3943
The U.S. dollar remains in a strong bullish trend, reinforcing the bearish outlook for gold. Technically, the market is developing a breakout structure around the 3960–3940 support zone. A sustained break and close below this area could trigger another leg lower.
However, before the next sell-off, a short squeeze toward the 4028–4065 resistance zone remains possible. A false breakout of this area could attract fresh selling pressure and accelerate the broader downtrend
Best regards,
R. Linda Short 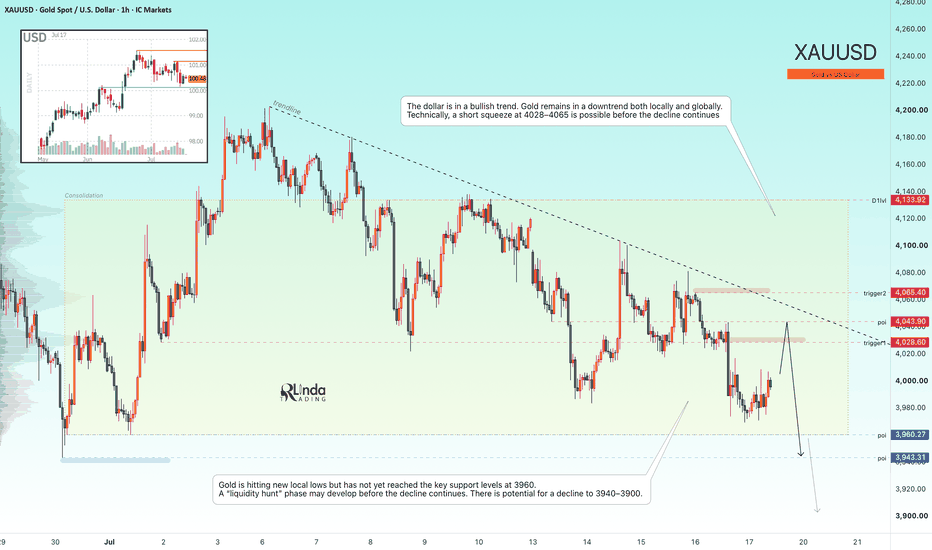
SPACE EXPLORATION TECHNOLOGIES [$SPCX] ELLIOTT WAVE ANALYSISSpace Exploration Technologies appears to be approaching the final stages of a corrective ABC decline. Following the impulsive Wave A from the all-time high, price completed a three-wave Wave B rally before rolling over into Wave C. The current decline is unfolding as an ending diagonal—a terminal Elliott Wave pattern that typically reflects trend exhaustion rather than the start of a fresh impulsive decline.
Unlike established securities, however, SPCX has virtually no historical price data. The absence of higher-timeframe structure significantly reduces analytical confidence, as Elliott Wave analysis relies heavily on historical context to validate wave degrees and identify long-term market cycles. With only a limited trading history available, all wave counts should therefore be treated with greater caution than would normally be the case.
Even so, price is now testing an important confluence of support around the IPO level near $135, while the lower boundary of the ending diagonal converges with long-term trendline support. One final marginal low remains possible to complete Wave C, but the risk of downside continuation appears increasingly balanced by the potential for a meaningful reversal.
Ending diagonals often conclude with a brief capitulation before reversing sharply, with the entire pattern frequently retraced in relatively short order. A decisive breakout above the diagonal’s upper boundary would provide the first technical confirmation that the correction has ended and that a larger recovery phase is underway. Until then, the preferred outlook remains that the market is completing, rather than initiating, a bearish sequence.
Not financial advice. Like and follow for more Elliott Wave and macro crypto analysis.
 Long
Long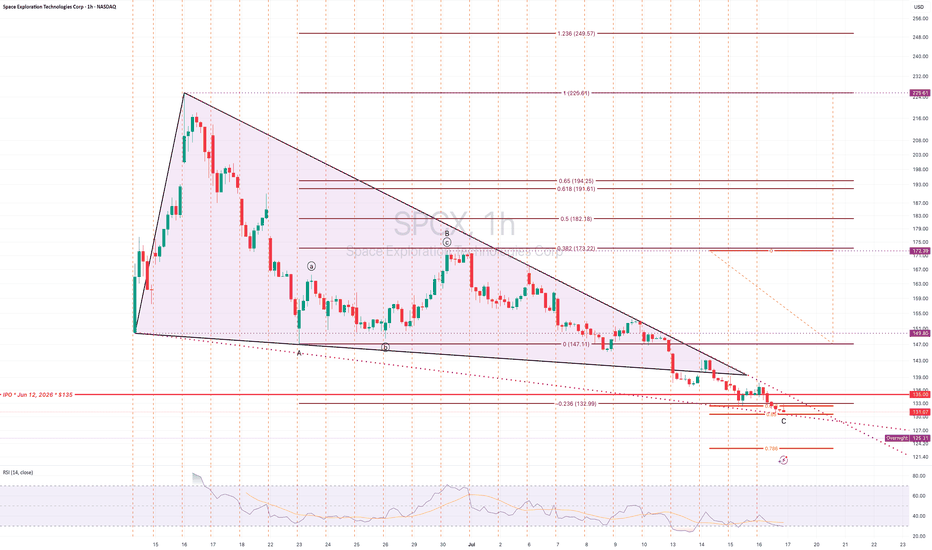
 Long
Long
BITCOIN - A false breakout of resistance in a bear market BINANCE:BTCUSDT.P is forming a retest of the key 64,500 resistance level as part of a countertrend correction, trapping late buyers while the market remains in a liquidity sweep phase
The broader trend remains bearish. Unstable ETF flows, the lack of meaningful fundamental support, and ongoing geopolitical uncertainty continue to weigh on the market.
Within the broader bear market, the market maker has swept liquidity above 64,500 before pushing price back into the trading range. Bitcoin remains in a 62,000–65,000 consolidation zone, while the higher-timeframe trend continues to point lower. A short squeeze into the resistance area could trigger another sell-off toward the 60K–50K region
Resistance levels: 64,450, 64,700, 65,600
Support levels: 62,750, 61,300
A retest of the liquidity pool above 64,450 may attract renewed selling pressure. If bears successfully defend this key resistance zone, it would further confirm the prevailing bearish market structure and increase the probability of a decline toward 62,750 and 61,300
Best regards,
R. Linda  Short
Short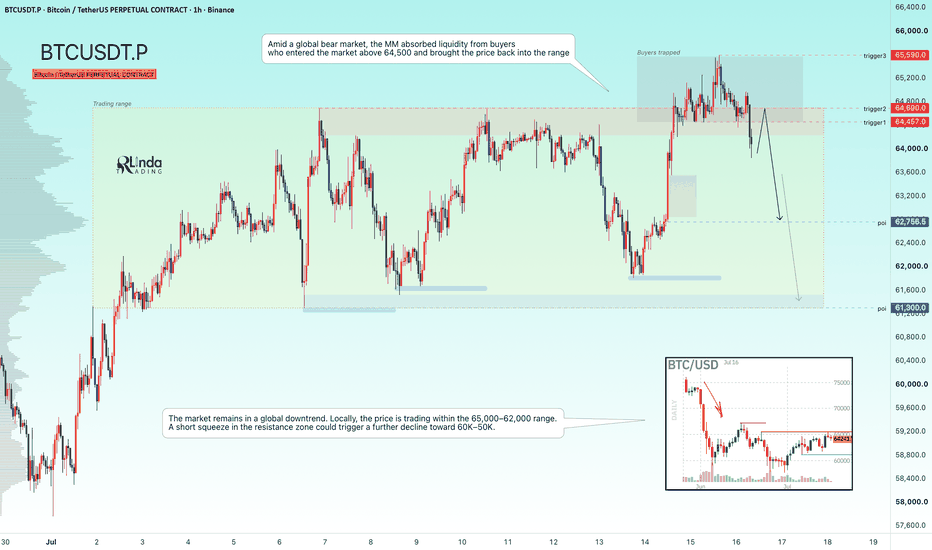
GOLD - Anticipating a short squeeze before the decline continuesICMARKETS:XAUUSD experienced a short squeeze around the key liquidity zone following Tuesday's CPI release. However, the market quickly regained its bearish momentum and resumed selling in line with the prevailing trend
The U.S. dollar remains in consolidation, as does the broader market, but the Dollar Index (DXY) continues to maintain its broader bullish trend, keeping pressure on gold. The lack of fundamental support, combined with ongoing geopolitical tensions, continues to favor the bears. The escalation of the U.S.–Iran conflict in the Strait of Hormuz remains a key source of uncertainty
Gold is still under pressure, with sellers maintaining control and using every rebound as an opportunity to initiate new short positions. The next major catalysts will be the U.S. Producer Price Index (PPI) and speeches from Federal Reserve officials, including Warsh. The daily technical structure remains bearish.
Bearish drivers : Escalation of the geopolitical conflict, Higher oil prices, Hawkish Fed rhetoric, Technical sell-on-rallies
Bullish drivers : Geopolitical de-escalation, Weaker-than-expected inflation data (including PPI), Dovish Fed commentary
Resistance levels: 4062, 4103
Support levels: 4021, 3986, 3960
Technically, gold is testing the 4021 intermediate support level. A local false breakdown could trigger a countertrend rebound toward the 4062 resistance zone to sweep liquidity before the broader downtrend resumes toward 3986–3960
Best regards,
R. Linda Short 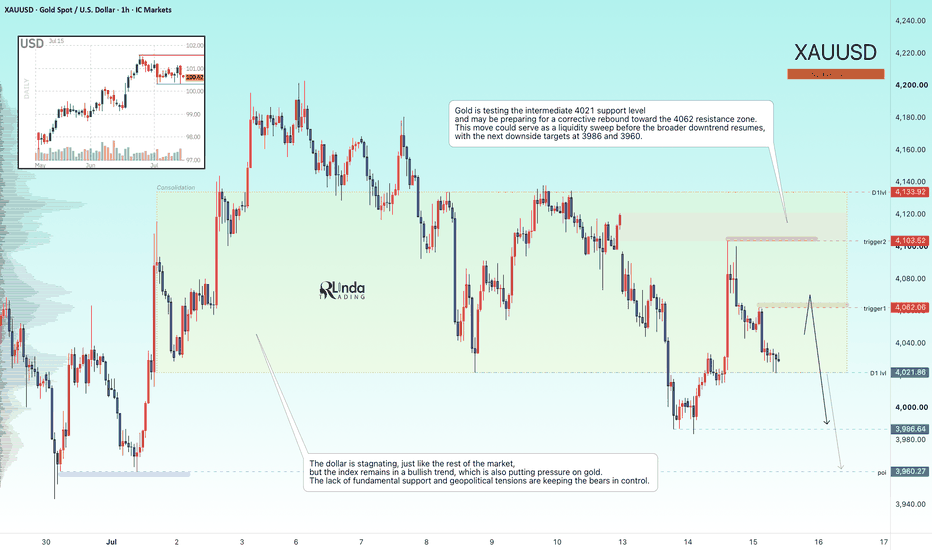
 Long
Long
4H Roadmap: The Structure That Will Decide the Weekly Scenario# **DXY | 4H Roadmap: The Structure That Will Decide the Weekly Scenario 🌀**
Greetings, fellow wave practitioners.
In the previous weekly analysis, I presented two valid long-term scenarios for the U.S. Dollar Index (DXY): an **Aggressive Scenario** and a **Conservative Scenario**. The purpose of this 4-hour update is to determine which of those higher-degree paths the market is currently constructing.
From the most recent major high, the initial decline is unfolding as a **three-wave structure**. This is a crucial observation because those three waves form the foundation for interpreting the higher-degree count. The real question is not where price is going next—it is **what structure these three waves actually represent.**
At this stage, the current rally may simply be a corrective move. If this correction completes within the highlighted reaction zone, the preferred interpretation is that the market is developing **Wave (4) of a Leading Diagonal**. Under this scenario, one final decline would be expected to complete **Wave (5)** of the diagonal, thereby finishing the entire higher-degree **Wave (A)**.
However, markets rarely choose the simplest path. Should the current correction extend beyond the expected characteristics of a typical fourth wave, more complex corrective structures must also be considered. What appears today as a simple correction could evolve into a **Double Zigzag (W-X-Y)** or even a **Triple Zigzag (W-X-Y-X-Z)**, requiring additional time before the correction is fully completed.
For this reason, the focus should not be placed solely on price targets. The highlighted reaction zones, corrective channels, and—most importantly—price behavior around those areas will provide the strongest evidence for identifying the market's true structure. Until that structure becomes clear, every wave count that remains consistent with the rules and guidelines of the Elliott Wave Principle deserves consideration.
Ultimately, the interpretation of this 4-hour structure will determine which of the two weekly scenarios gains confirmation.
If the market completes the current correction and then produces one final decline to finish the Leading Diagonal, the **Aggressive Scenario** will gain significant credibility. In that case, the recent decline would represent only **Wave (A)** of a much larger corrective sequence, to be followed by a higher-degree **Wave (B)** and eventually **Wave (C)**.
On the other hand, if price decisively breaks above the key structural levels and no longer behaves consistently with the expected diagonal or corrective pattern, the **Aggressive Scenario** would gradually lose validity. That outcome would strengthen the **Conservative Scenario**, suggesting that the larger correction has already ended and that the U.S. Dollar Index may be entering a new long-term bullish phase.
At this point, the answer will not come from prediction—it will come from **price behavior**.
As Elliott Wave analysts, our objective is not to forecast the future with certainty. Our objective is to identify the structure the market is building in real time. Once that structure reveals itself, the higher-degree roadmap becomes considerably clearer.
**Patterns whisper. I listen.**
**— Mr. Nobody** 📊🌀
Dollar Index Future
2 days ago
DXY | Corrective Structure Under the Microscope
 Long
Long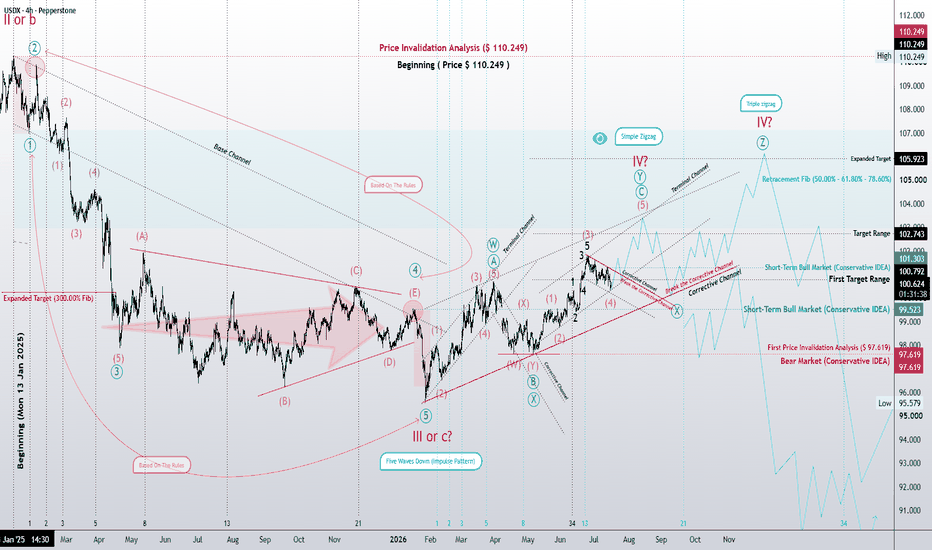
Gold After CPI & PPI: Is the Next Move Below $4,000?After yesterday's CPI release, Gold ( OANDA:XAUUSD ) initially moved higher. However, as it approached a resistance zone($4,138-$4,091) and resistance lines—where multiple technical resistance factors converged—it faced strong selling pressure and started to decline again.
Today, following the release of the PPI data, Gold once again attempted to move higher. However, its bullish reaction was much weaker than after the CPI report, which was largely expected since a significant portion of the market had already priced in the inflation data after yesterday's CPI release.
I expect Gold to resume its decline and fall at least toward the $4,026 level. If bearish momentum accelerates, we could even see Gold break below $4,026.
First Target: $4,026
Second Target: $3,997
Stop Loss(SL): $4,103(Worst)
What do you think? Could Gold drop below $4,000 again, or will buyers step in and defend this level?
💡 Please respect each other's opinions and express agreement or disagreement politely.
📌 Gold Analyze (XAUUSD), 1-hour time frame.
🛑 Always set a Stop Loss(SL) for every position you open.
✅ This is just my idea; I’d love to see your thoughts too!
🔥 If you find it helpful, please BOOST this post and share it with your friends. Short 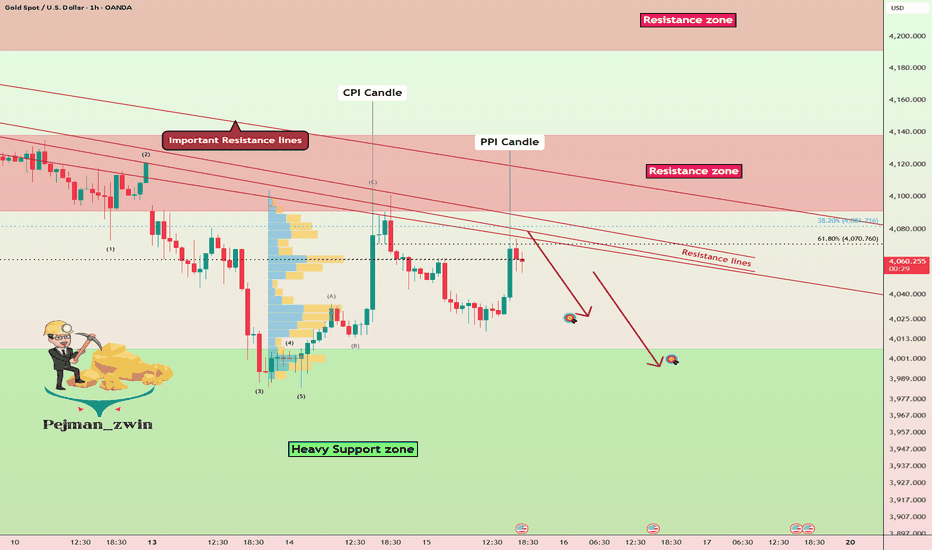
ETH/BTC Is Hinting at a Short-Term Altseason While Bitcoin continues to dominate headlines, the ETH/BTC pair may be quietly approaching one of the most important technical inflection points in years.
Historically, sustained strength in ETH/BTC has often coincided with periods where capital rotates from Bitcoin into the broader altcoin market. Although no single chart can confirm an altseason, the current technical structure suggests that Ethereum may soon begin outperforming Bitcoin once again.
Monthly Timeframe
The monthly chart suggests that ETH/BTC remains within a multi-year W-X-Y corrective structure that has been developing since the 2017 peak.
Rather than approaching the completion of Wave X itself, the current price action appears to be unfolding within a contracting triangle that forms Wave X. Based on this interpretation, ETH/BTC is now nearing the completion of Wave D, leaving one final Wave E before the larger corrective phase concludes.
This distinction is important because triangle patterns typically represent continuation structures. Instead of signaling the end of the correction immediately, they often indicate that the market is preparing for one final swing before the dominant trend resumes.
The current Wave D advance is expected to test the long-term descending trendline and the upper boundary of the triangle, where resistance may emerge. Should that scenario play out, a corrective Wave E would likely follow, potentially completing the entire Wave X structure.
Once Wave X is complete, the larger Wave Y could begin, marking the next major leg higher in ETH/BTC and potentially setting the stage for a period of Ethereum outperformance relative to Bitcoin.
Daily Timeframe
The daily timeframe provides a closer look at the development of the monthly Wave D.
Following the apparent completion of Wave C near the 0.618 Fibonacci support, ETH/BTC has begun advancing toward the upper boundary of the larger contracting triangle identified on the monthly chart.
Rather than viewing this advance as the beginning of a new long-term impulsive trend, I currently interpret it as Wave D of the higher-timeframe triangle.
From here, the path of least resistance remains higher as long as the current structure remains intact. The primary objective is the confluence formed by the 0.272 Fibonacci retracement, the descending trendline, and previous resistance around 0.054 BTC.
Should price reach this region, it would satisfy the expected termination zone for Wave D and potentially set the stage for the final Wave E, completing the larger Wave X triangle before the next major phase develops.
Why a Short Term Altseason?
At this point, some may wonder why I'm referring to this setup as a short term altseason if the larger Wave X correction has not yet completed.
The answer lies in Glenn Neely's time based analysis.
Based on Neely's guideline for corrective structures, Wave C within Wave D is projected to require approximately 163 days from the recent bottom before reaching completion. This suggests that the current advance is not merely a brief rally lasting a few weeks, but rather a move that could unfold over several months.
If this time projection proves accurate, ETH/BTC would have sufficient time to outperform Bitcoin on a relative basis, creating an environment in which many altcoins may also begin to outperform. While I do not expect this to represent the beginning of the next major multi year altcoin cycle, it does support the possibility of a meaningful short term rotation into altcoins before the larger Wave E correction develops.
In other words, my expectation is not that the entire higher timeframe correction has ended. Instead, I believe the market may first experience a sustained Wave D advance that could last approximately 163 days before the final Wave E completes the larger Wave X triangle.
Markets rarely reward the crowd at obvious turning points. Instead, they tend to reveal subtle shifts in structure long before the broader narrative changes. If the current Elliott Wave count and time based analysis continue to unfold as expected, ETH/BTC may be signaling the beginning of a meaningful period of relative strength for Ethereum, laying the foundation for a short term rotation into the broader altcoin market.  Long
Long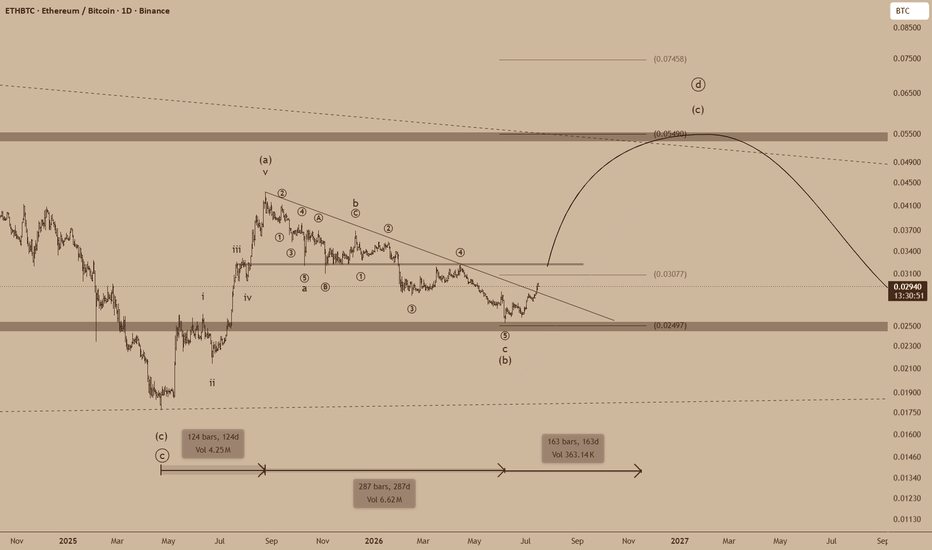
DOGECOIN [$DOGE] ELLIOTT WAVE CRYPTO ANALYSIS WEEKLY TFDOGE appears to be approaching the final stages of a multi-year correction, with price now testing a major confluence of long-term support.
From an Elliott Wave perspective, the explosive five-wave advance into the 2021 peak was followed by a complex A-B-C correction that has gradually retraced much of the previous bull market. The current decline is now approaching the macro Golden Zone Long at 3¢, where multiple technical support levels converge.
While bearish momentum remains intact in the short term, the broader structure suggests the correction may be entering its final phase. A successful defence of the current support region would complete the higher-degree Wave (4) and set the stage for the next impulsive advance.
If buyers regain control, the focus shifts back toward the previous cycle high before opening the door to substantially higher prices as Wave (5) unfolds. Until then, patience remains key, as the market still needs to confirm that a durable bottom has formed.
As long as the macro support zone at 3¢ holds, the larger bullish outlook remains intact. A decisive break below it, however, would force a reassessment of the current wave count.
Not financial advice. Like and follow for more Elliott Wave and macro crypto analysis.  Long
Long