More upside for BitcoinHi traders,
Last week Bitcoin made a small correction down and went up again (grey wave 3). After that it started a bigger correction down.
So after it finishes this bigger correction, we could see more upside and a continuation of wave 3.
Let's see what the market does and react.
Trade idea: Wait for the correction down to finish. After a bullish change in orderflow on a lower timeframe you could trade longs.
This shared post is only my point of view on what could be the next move in this
Elliott Wave
Down for goldHi traders,
Last week gold slowly went lower. It could be that wave B has formed a Triangle and price is now in wave C.
So next week we could see more downside into the bullish Daily FVG.
After it reaches there, we will see what price action does and react.
Trade idea: Wait for a bearish change in orderflow on a lower timeframe, to trade (short term) shorts.
This shared post is only my point of view on what could be the next move in this pair based on my technical analysis.
But I react and
Start of wave 5 on S&P500?Hi traders,
Last week S&P500 broke and retested the bearish Daily FVG.
This could be the start of an ending diagonal (wave 5).
So next week we could see more upside.
Let's see what the market does and react.
Trade idea: Wait for a correction down and a bullish change in orderflow on a lower timeframe, to trade longs.
This shared post is only my point of view on what could be the next move in this pair based on my technical analysis.
But I react and trade on what I see in the chart, not what
More downside for EUHi traders,
Last week EU dropped and broke through the Daily FVG, making a bearish Daily BPR. After that it made a correction up into the Daily BPR and rejected from there to the downside.
So next week we could see downside for this pair.
Let's see what the market does and react.
Trade idea: Wait for a bearish change in orderflow on a lower timeframe, to trade (short term) shorts.
This shared post is only my point of view on what could be the next move in this pair based on my technical ana
ONDO | Weekly Structure | Wave 3 Breakout From 0.618 SupportThesis:
ONDO has one of the cleaner weekly structures I am following right now.
The larger correction appears to have completed earlier this year. From there we saw a clear impulsive Wave 1, followed by a Wave 2 pullback that found support around the classic 0.618 Fibonacci retracement.
After several months of consolidation, this week we finally have a breakout with volume.
For me, this is the first meaningful confirmation that Wave 3 may now be developing.
Context
The breakout also comes
XAUUSD Update Sideways 4230 - 4400For nearly two weeks, the price of gold has been consolidating within the 4400–4230 range.
This is quite interesting, as the price has yet to make a significant move to establish a clear direction.
We need to exercise caution, as a breakout from this range will likely trigger a significant price movement.
Remain patient in the coming week, as key US economic data is set to be released.
Best wishes & God Bless !
Zcash/USD 4H timeframe-bullish continuationIt seems Zcash has just completed a wave 4 pink on the 4H timeframe triangle pattern ABCDE at 1516 and is moving higher to complete wave 5 green, red and blue.
It should be the last wave up (wave 5) on both lower and higher timeframe 4H, 8H, and 1D before a major correction could happen.
Invalidation: 1516
Price must stay above this point to keep the plan valid.
Confirmation: 1621
Target: around 2210.
BROS — Bullish Gartley Harmonic PatternBROS is approaching a major Potential Reversal Zone (PRZ) where the Bullish Gartley pattern is completing.
The chart currently looks ugly. Price has been falling hard, and at first glance this can look like a falling knife. But this is exactly the type of setup I like to watch when a harmonic pattern is completing at a major PRZ.
Trade Setup
Entry: $34–$36
Stop Loss: $26.00
TP1: $56.00
TP2: $70.00
TP3: $88.00
The $34–$36 area is the key PRZ. This is where the Gartley is expected to complete
NIFTY 50 – Elliott Wave Bearish StructureNIFTY 50 appears to have completed a larger corrective ABC structure:
A → B → C
The C wave appears to have completed near the 24,700–24,800 zone, followed by the start of a new 5-wave impulsive decline.
Current structure:
(1) → (2) → (3) → (4) → (5)
Wave (1) and wave (2) appear to be completed, and the market is currently developing wave (3) on the downside.
Projected structure:
Wave (3) → around 22,200
Wave (4) → possible retracement toward 22,600
Wave (5) → projected toward 21,100–21,00
Gold – Long-Term Elliott Wave Structure | Potential B → C ImpulsGold appears to be developing a long-term corrective ABC structure following the completion of the larger 5-wave advance.
The current structure is showing a potential:
A → B → C
The A → B leg itself appears to be developing as a smaller A-B-C structure, with the internal price movement showing an impulsive character. The current price action suggests that the B leg is approaching completion.
Once the B leg is confirmed complete, the next phase could be the B → C leg.
The important character
MNT to the Clouds? A 5-Wave Decline May Have Just Ended
Something interesting is happening on the MNT weekly chart .
After a prolonged decline from the previous highs, price has started recovering — but the recovery itself isn’t the most important development.
What matters more is that MNT has broken above the descending trendline that defined much of the previous bearish structure.
When we combine that breakout with a possible Elliott Wave count, an interesting scenario begins to emerge:
Could the 5-wave decline be complete, with MNT now ente
NEAR/USD 1W timeframe-bullish continuation of wave 3 redIt looks like NEAR has completed a wave 2 at 0.84 double zigzag pattern and has been moving higher with wave 3 pink.
Currently, it seems to be running a wave 3 red at the lower timeframe within the wave 3 pink, target 1 at the last ATH at 9, target 2 at Fibonacci 161.8% of wave 1, at 12.57 once target 1 is reached.
Invalidation point: 1.53
The scenario is invalid if price moves lower than this point.
Confirmation point: 3.34
It adds significant confidence to the scenario if price prints above
Crypto will not rise above 5.72% of stablecoins dominanceIf the stablecoin dominance forms an extended flat pattern on a minor degree, the chart cannot fall below the bottom of Wave 2 at 5.72%.
From current level, this still implies significant growth in cryptocurrency prices.In that the case, the price will bounce off levels above 5.72% and begin moving toward the 9.97% area.
There is a more bullish case, but it is not my base scenario.
We’ll discuss it if the 5.72% level fails to hold.
The targets for Doge remain the same; you can see the lev
ON: gambling with fibo numbersSince COVID shock it followed a massive growth to then ATH in Jul'23. Since ATH in Jul'23 it pulled back by 0.786 (look at 52 wk low on liberation day). Then it charged up by 1.272 to a historic ATH in May'26. Now on the heels of synaptics buyout it has retreated to as low as 70 i.e. by fibo 0.618 (last week there was a bad leak of confidential slides, it caused some intraday noise to 66 which is exactly 200 wk ema support where buying algos jumped in). If I extend to next year, it will shrug of
Gold | Has the Triangle Completed and Is the Next Bearish Wave B⏱️ Reading Time: ~2 minutes
In our previous analysis, we considered both bullish and bearish scenarios.
However, based on the current structure, the bullish scenario is temporarily off the table.
🔻 Bearish Scenario
If the Triangle shown on the chart has indeed completed, the current move may mark the beginning of a new bearish structure.
In this case, we would expect the decline to develop through at least a three-wave structure. The important point is that a deeper decline could retrace a s
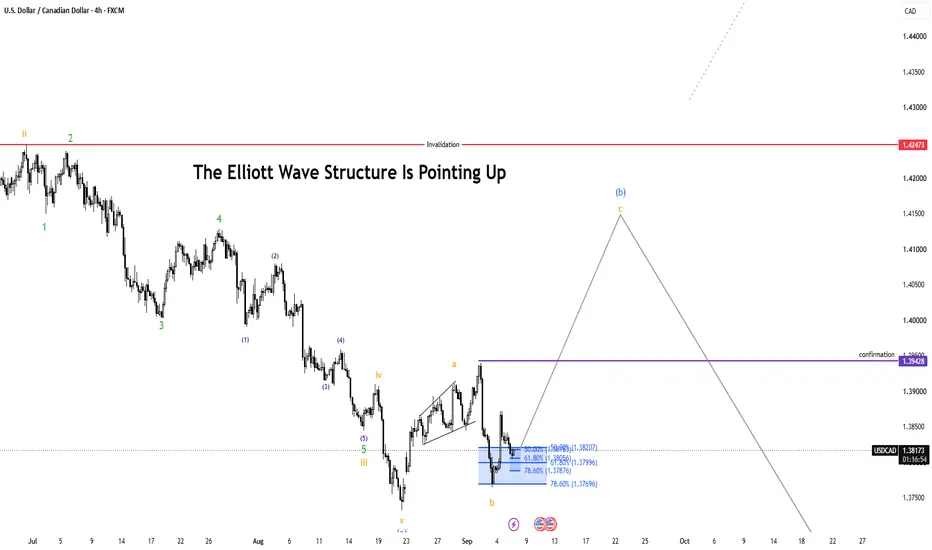
USDCAD – Potential Wave B / Wave 3 Upside SetupOn the higher timeframe (Daily) , the primary expectation is that USDCAD is developing a larger WXY correction to the downside.
Wave W and Wave X appear to be completed, with the market now developing Wave Y to the downside.
The structure also leaves room for an alternative count, where the WXY-pattern may have already been completed earlier. In this scenario, the current decline could represent a Wave 2, with a potential Wave 3 to the upside still ahead.
Interestingly, both scenarios curren
USDCHF – Potential Move UpOn the higher timeframe (3D) , the larger structure of USDCHF shows a completed ABC correction.
Wave A was completed in July 2023 and developed as a Leading Diagonal. This was followed by a large Triangle pattern forming Wave B , which was completed in January 2025.
From there, USDCHF developed a strong five-wave impulse to the downside, forming Wave C . This is an important confirmation of the larger structure, as Wave C needs to unfold with an impuslive character.
The fifth wave of Wav
Nifty Elliott Wave Analysis | 15 Sep – 30 Sep 2026Wrap-up:-
As discussed in my previous Mid-Term NIFTY Analysis (Weekly Chart published on 11 July 2026 ), the market continues to trade within Wave Y of Wave X of the larger Major Wave 4 corrective structure .
Within Wave Y, Wave A concluded at 24,601, while Wave B is currently unfolding.
Based on the latest price structure, Wave B appears to be developing as an WXY Irregular Correction.
The internal structure is currently interpreted as follows:
Internal Wave W of Wave B
Bitcoin 15M | Structure Must Confirm the Path⏱️ Reading Time: ~2 minutes
Hey everyone,
In this short-term Bitcoin update, I’m looking at two main paths. At the moment, however, the bearish scenario has the stronger structural position.
🟢 Bullish Scenario
For the bullish scenario to become more convincing, the market needs to prove itself through a clear motive structure.
Simply breaking above a resistance level or making a sharp move higher is not enough for me. The new advance should develop a recognizable impulsive structure, follow
Copper Ending Diagonal Suggests Upside May Be LimitedCopper has recently reached new highs, but one of the wave counts we are tracking suggests that the upside could become limited. We are observing a potential ending diagonal, which is a pattern that typically shows that bulls are still in control, but are gradually losing strength. This is also reflected by the increasing number of overlaps since the beginning of this year.
You can clearly see the difference between the strong and steep advance from the August 2025 lows into the January 2026 hi
US10Y Enters a Major PRZ: Is a Treasury Yield Correction Next?The U.S. 10-Year Treasury Yield ( TVC:US10Y ) is one of the most important benchmarks for global interest rates and financial conditions.
When US10Y rises sharply, it can tighten financial conditions and pressure stocks, gold, Bitcoin, and other risk assets. A decline in yields can have the opposite effect and support these markets.
US10Y has now entered an important technical area. Can the bullish trend continue, or is a correction about to begin?
Technical Analysis
US10Y has developed a s
Brent Crude Oil | Is a Nested Structure Developing?⏱️ Reading time: About 2 minutes
In this latest 4H update of Brent crude oil, the main focus remains on the bullish structure. However, this scenario can only become stronger if the market continues to maintain a sequence of nested structures across multiple degrees.
At the moment, after the initial wave, we are watching the development of 1&2 structures across different degrees. The recent decline does not invalidate this scenario by itself, as it could still be part of a lower-degree correct
EURCHF – The Next Scena🇪🇺🇨🇭 EURCHF – 6H | Elliott Wave Analysis | The Next Scenario
In this analysis, we are tracking the movement of EURCHF on the 6-hour timeframe , with a focus on the Elliott Wave structure, the main price channel, and the key levels that may guide the next phase of the market.
📐 1. The Bigger Picture
The current price structure appears to be part of a larger bullish wave sequence, which can be interpreted as:
(1) → (2) → (3) → (4) → (5)
Wave (1) was completed around the 0.9250 are