Gold Tests 61.8% Fibonacci — Is the Correction Almost Over?Gold ( OANDA:XAUUSD ) has been in a bearish trend over the past 6–7 days, but the decline has developed with relatively weak momentum.
Interestingly, the bullish move completed in less than two days has still not been fully retraced after nearly a week of declining prices, suggesting that buyers continue to show relative strength.
Can gold defend the Heavy Support Zone and begin another bullish move, or is a deeper correction approaching?
Macro Outlook
The U.S. 10-Year Treasury Yield(US10Y)
Elliott Wave
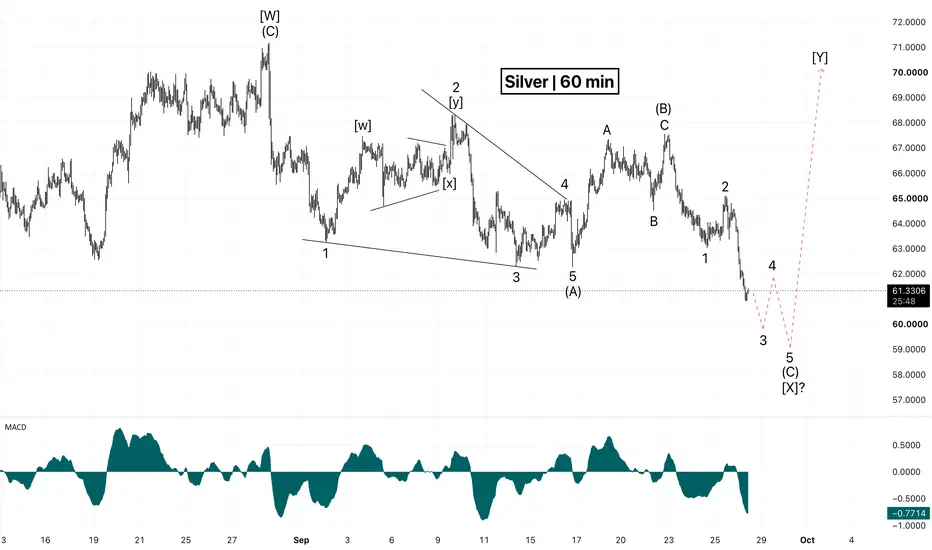
One More Drop Before the Next Rally?Silver remains under pressure in the short term, and the current Elliott Wave structure suggests that the decline may not be complete yet.
On the 60-minute chart, the move from the September 23 high appears to be developing as a five-wave bearish impulse.
We are currently approaching the final stages of this structure. My primary scenario suggests a small wave 4 correction followed by one more decline in wave 5.
🎯 Target zone: $58–59
This move could complete wave (C) and potentially the la
XAUUSD — Strong Bearish Start Inside Channel
Gold is opening the new week with strong bearish pressure after failing to recover above the descending channel structure. From Kelly’s view, the chart suggests that XAUUSD is still trading inside a clear downtrend, and the current movement may continue lower to complete the next bearish Elliott Wave sequence.
The key idea is simple: gold remains below the Sell zone wave 5, and as long as buyers cannot reclaim this area, the bearish channel may continue pushing price toward the lower Fibonacci
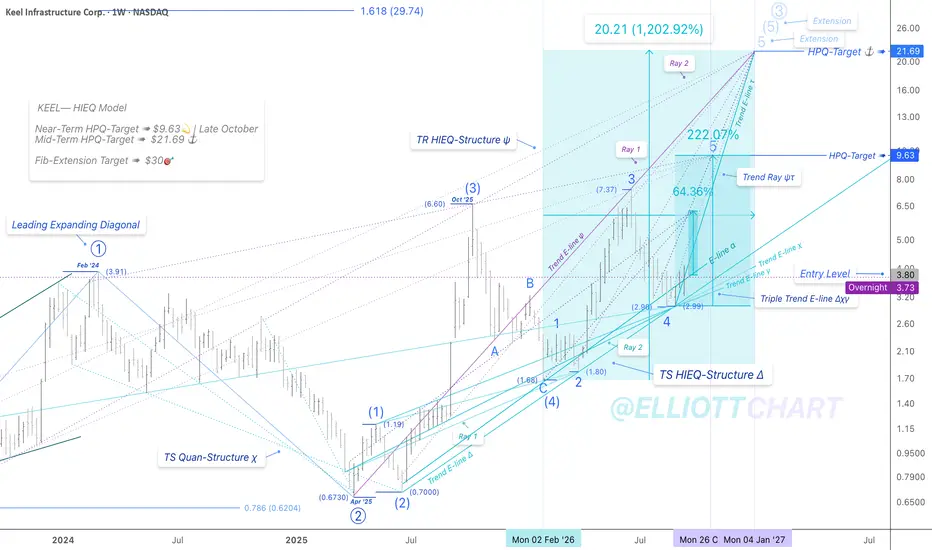
KEEL | WeeklyNASDAQ:KEEL — HIEQ Model
Just Observation | Projecting Impulsive Advance 📈
No specific change to my KEEL analysis—no shift is required. Price bars remain quite stable on the Support Trend E-line α, while steadily tracking along Trend E-line τ, with 64%📈 potential upside projected across the upcoming weekly rallies.
The current zone may still be respected as a potential entry region.
The HPQ Target ➤ $9.63 🎯 remains intact for late October.
The Primary Trend Ray Advance ψτ was first anchored
Foseco India – Assessing the Current CorrectionFoseco India has seen a strong impulsive advance, with the recent peak marking a possible completion of green circle Wave 3.
The subsequent decline appears to be developing as green Wave 4, which is probably still in progress. The lower-degree blue count also suggests corrective price action within this larger Wave 4.
Volume expanded sharply during the preceding Wave 3 advance, while activity has reduced during the current pullback. I’ll be watching how this correction develops before looking
BTC | DailyCRYPTOCAP:BTC — HIEQ Model
Quan Analysis | How Do HP Trend Rays Function?!
Forming the peak across the Trend Ray climax zone after reaching the defined HPQ Target ➤ $87K 🎯✨
As noted earlier, the Primary Trend Ray Advance Ⓐ was first anchored by the HIEQ-Structure ψ confluence ➤ $87,777.77 ⚓️ ݁˖
In my methodology, an anchoring level represents a significant structural confluence—like a magnet. It has already functioned energetically, vibrating the trendflow, aligning with the Trend Ray's con
The Market’s Phase TransitionThe Market’s Phase Transition
In physics, matter can exist in different states. Water can be ice, liquid, or vapor, and each state behaves differently even though it is made from the same basic substance. A change in temperature or pressure can cause one state to transform into another. Financial markets can behave in a similar way. The same market can spend weeks trending, move into a range, become increasingly quiet, and then suddenly expand into a powerful move. The market has not changed co
IREN | WeeklyNASDAQ:IREN — HIEQ Model
Quan Analysis | How High Could We Climax on This TS Map? 📈
Continuing to project the upcoming weekly rallies within the defined trend potential of Trend Ray Advance Δχ.
The HIEQ-Structure Δ ➠ three parallel Sup Rays continue to generate impulsive energy for the projected trend extension of Intermediate Wave (3)—preserving the defined extreme lows at the trend origins as Intermediate Wave (2) and Minor Wave 2, while tracking steadily along the newly shifted Trend E-lin
ADA Elliott wave analysis From an Elliott Wave perspective, this is how I currently see the larger ADA structure. My primary view is that ADA is still working through a macro Wave 4 correction, with a larger Wave 5 potentially still ahead. The main issue is that I am not fully convinced the Wave 4 correction has completed yet, because there is still meaningful room for price to move lower. That does not mean ADA has to reach the lower green target zone, but historically we have seen many corrections complete around the 1
Bitcoin 1H | Understanding Structure, Not Predicting Price⏱️ Reading Time: ~2 minutes
The Daily chart gives us the bigger picture.
The 1H chart helps us understand what Bitcoin may do next as that structure develops.
Right now, Bitcoin is still forming a corrective structure, so both paths remain on the table.
🟦 Bullish Scenario
If the current structure breaks higher and develops into a clear five-wave move, the bullish scenario gains strength.
The first key confirmation level is around 84,601.
Above that, the next important levels are:
85,662 →
Mr. Nobody | Bitcoin Daily — Structure Before Prediction⏱️ Reading Time: ~4 minutes
I want to begin this analysis with one simple rule:
We are not here to prove the bullish scenario or the bearish scenario. First, we read the structure and let price show us which path is developing.
On the Daily timeframe, Bitcoin’s larger structure still allows for more than one interpretation. The recent decline can be viewed as a five-wave impulse at a higher degree, while the sideways structure that followed may be part of a more complex correction.
But this
KHC — Bullish Bat Harmonic PatternKraft Heinz is approaching a very interesting Bullish Bat harmonic pattern, with the pattern completing near the Potential Reversal Zone (PRZ).
After years of weakness, KHC is reaching an area where this Bat pattern could potentially produce a larger reversal.
Trade Setup
Entry: $23.00–$23.30
Stop Loss: $20.50
TP1: $31.00
TP2: $36.50
TP3: $43.50
TP4: $55.00
The $23.00–$23.30 area is the key zone I'm watching. This is where the Bullish Bat is expected to complete, making it the area where I
SP500, monthly cash data, bearish move expectedIn November 2024, I published my previous analysis of the S&P 500, with a target of around 8,000 for late 2026.
We are now getting very close to that target, although we may not necessarily touch 8,000.
In my new analysis, I believe a sharp decline lies ahead, potentially starting in late autumn 2026 and hitting hardest toward the end of winter 2027.
More upside for BitcoinHi traders,
Last week Bitcoin made a small correction down and went up again (grey wave 3). After that it started a bigger correction down.
So after it finishes this bigger correction, we could see more upside and a continuation of wave 3.
Let's see what the market does and react.
Trade idea: Wait for the correction down to finish. After a bullish change in orderflow on a lower timeframe you could trade longs.
This shared post is only my point of view on what could be the next move in this
Down for goldHi traders,
Last week gold slowly went lower. It could be that wave B has formed a Triangle and price is now in wave C.
So next week we could see more downside into the bullish Daily FVG.
After it reaches there, we will see what price action does and react.
Trade idea: Wait for a bearish change in orderflow on a lower timeframe, to trade (short term) shorts.
This shared post is only my point of view on what could be the next move in this pair based on my technical analysis.
But I react and
Start of wave 5 on S&P500?Hi traders,
Last week S&P500 broke and retested the bearish Daily FVG.
This could be the start of an ending diagonal (wave 5).
So next week we could see more upside.
Let's see what the market does and react.
Trade idea: Wait for a correction down and a bullish change in orderflow on a lower timeframe, to trade longs.
This shared post is only my point of view on what could be the next move in this pair based on my technical analysis.
But I react and trade on what I see in the chart, not what
More downside for EUHi traders,
Last week EU dropped and broke through the Daily FVG, making a bearish Daily BPR. After that it made a correction up into the Daily BPR and rejected from there to the downside.
So next week we could see downside for this pair.
Let's see what the market does and react.
Trade idea: Wait for a bearish change in orderflow on a lower timeframe, to trade (short term) shorts.
This shared post is only my point of view on what could be the next move in this pair based on my technical ana
ONDO | Weekly Structure | Wave 3 Breakout From 0.618 SupportThesis:
ONDO has one of the cleaner weekly structures I am following right now.
The larger correction appears to have completed earlier this year. From there we saw a clear impulsive Wave 1, followed by a Wave 2 pullback that found support around the classic 0.618 Fibonacci retracement.
After several months of consolidation, this week we finally have a breakout with volume.
For me, this is the first meaningful confirmation that Wave 3 may now be developing.
Context
The breakout also comes
XAUUSD Update Sideways 4230 - 4400For nearly two weeks, the price of gold has been consolidating within the 4400–4230 range.
This is quite interesting, as the price has yet to make a significant move to establish a clear direction.
We need to exercise caution, as a breakout from this range will likely trigger a significant price movement.
Remain patient in the coming week, as key US economic data is set to be released.
Best wishes & God Bless !
Zcash/USD 4H timeframe-bullish continuationIt seems Zcash has just completed a wave 4 pink on the 4H timeframe triangle pattern ABCDE at 1516 and is moving higher to complete wave 5 green, red and blue.
It should be the last wave up (wave 5) on both lower and higher timeframe 4H, 8H, and 1D before a major correction could happen.
Invalidation: 1516
Price must stay above this point to keep the plan valid.
Confirmation: 1621
Target: around 2210.
BROS — Bullish Gartley Harmonic PatternBROS is approaching a major Potential Reversal Zone (PRZ) where the Bullish Gartley pattern is completing.
The chart currently looks ugly. Price has been falling hard, and at first glance this can look like a falling knife. But this is exactly the type of setup I like to watch when a harmonic pattern is completing at a major PRZ.
Trade Setup
Entry: $34–$36
Stop Loss: $26.00
TP1: $56.00
TP2: $70.00
TP3: $88.00
The $34–$36 area is the key PRZ. This is where the Gartley is expected to complete
NIFTY 50 – Elliott Wave Bearish StructureNIFTY 50 appears to have completed a larger corrective ABC structure:
A → B → C
The C wave appears to have completed near the 24,700–24,800 zone, followed by the start of a new 5-wave impulsive decline.
Current structure:
(1) → (2) → (3) → (4) → (5)
Wave (1) and wave (2) appear to be completed, and the market is currently developing wave (3) on the downside.
Projected structure:
Wave (3) → around 22,200
Wave (4) → possible retracement toward 22,600
Wave (5) → projected toward 21,100–21,00
Gold – Long-Term Elliott Wave Structure | Potential B → C ImpulsGold appears to be developing a long-term corrective ABC structure following the completion of the larger 5-wave advance.
The current structure is showing a potential:
A → B → C
The A → B leg itself appears to be developing as a smaller A-B-C structure, with the internal price movement showing an impulsive character. The current price action suggests that the B leg is approaching completion.
Once the B leg is confirmed complete, the next phase could be the B → C leg.
The important character