Tesla ($TSLA) Daily: Bearish Momentum Accelerates – Mapping FiboTesla ( NASDAQ:TSLA ) Daily: Bearish Momentum Accelerates – Mapping Fibonacci Demand Zones down to $361
### ⚡ Tesla, Inc. ( NASDAQ:TSLA ) Daily Technical Matrix (Ref: TSLA_2026-06-18_08-39-33.png)
We are releasing a structural update on Tesla, Inc. ( NASDAQ:TSLA - NASDAQ) on the Daily (1D) timeframe, as short-term bearish pressure begins to dominate the immediate price action.
The stock concluded its latest session printing a decisive negative candle of **-2.05%, trading at 396.38**. This breakdown confirms an immediate acceleration of localized selling momentum.
---
### 🔍 Technical Breakdown & Trend Invalidation
1. **Dynamic Moving Average Break:** The price action has broken cleanly below its near-term momentum filter, the **17-period EMA (red line at 407.80)**, and is currently slicing through the institutional **72-period EMA (blue line at 405.39)**. This twin-line break shifts the tactical path of least resistance firmly to the downside (plotted by our green directional vector).
2. **Overhead Resistance:** The dominant descending trendline (purple diagonal line) continues to act as a major macro ceiling, capping the broader distribution phase.
---
### 🎯 Fibonacci Retracement & Institutional Support Targets
As the bearish wave unfolds, we are shifting our focus away from chasing shorts and moving toward identifying high-confluence areas where deep institutional buyers are likely to defend the stock:
* **Zone 1 – The Golden Pocket (0.618 Retracement at 382.53):**
The **$382** region marks our first major quantitative target. Reversals at the 61.8% golden ratio often signal a healthy structural correction before long-term accumulation resumes.
* **Zone 2 – The Macro Structural Floor (1.00 Expansion at 361.54):**
Should selling pressure extend past the golden pocket, the ultimate defensive zone rests between **361.54** and the heavy horizontal historical support baseline at **364.58** (red horizontal line). This narrow price cluster forms an exceptional confluence of structural chart support and mathematical target fulfillment, creating a high-probability zone for trend exhaustion.
### Tactical Outlook:
The index is short-term heavy. Patience is required as we let price action rotate down into these key mathematical clusters. We will monitor the daily candle footprints at the **$382** and **$361** areas for any signs of volume absorption and bullish reversal triggers.
---
📊 **ChartPro Data** | By Rogerio Zaglia
*Automotive Sector Architecture, Fibonacci Expansion Matrices & Quantitative Support Zoning.*
⚠️ **Disclaimer:** For educational and informational purposes only. This technical study represents a personal trading framework and does not constitute financial or investment advice.  Short
Short
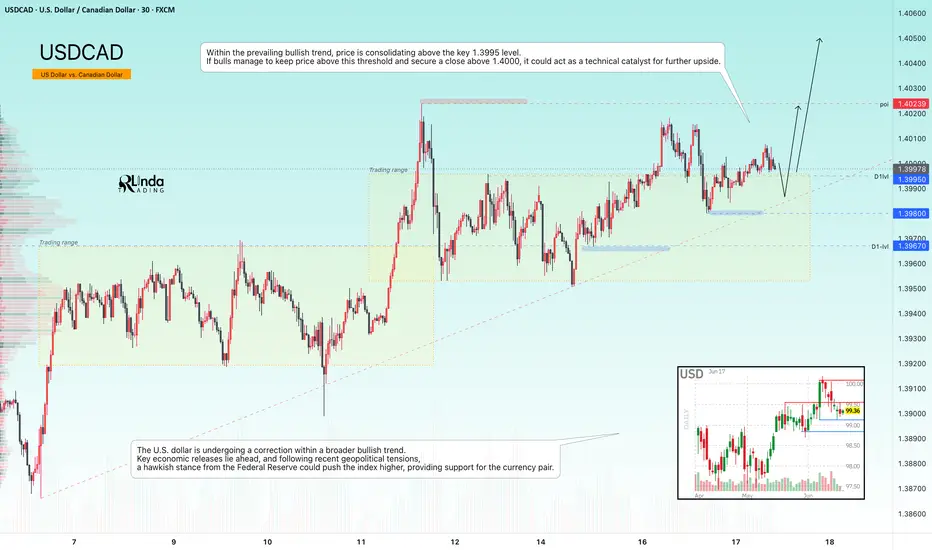
USDCAD - Retest of 1.40. Markets are awaiting the Fed's decisionFX:USDCAD maintains a strong bullish trend and is testing the 1.4000 resistance level while attempting to hold above this key threshold. The Federal Reserve meeting is now in focus
USDCAD has entered a consolidation phase ahead of major news events, with the primary focus on the Fed's interest rate decision and comments from the new Fed Chair
The U.S. dollar is currently correcting within a broader bullish trend. With key economic releases approaching and geopolitical tensions still in the background, a hawkish stance from the Federal Reserve could push the Dollar Index higher, providing additional support for the currency pair.
Resistance levels: 1.4000, 1.4024, 1.4100
Support levels: 1.3995, 1.3980, 1.3967
Within the prevailing bullish trend, price is consolidating above the key 1.3995 level. If bulls manage to defend this area and secure a close above 1.4000, it could become a technical catalyst for further upside
Best regards,
R. Linda EURUSD — Is This Recovery Real or Just a Retest?EURUSD dropped sharply, then recovered into a key reaction area — and now the market needs to prove whether buyers are really back, or price is only retesting before another move lower.
THE SIMPLE READ
EURUSD is trying to recover after a strong sell-off.
Price bounced from the lower liquidity area near 1.14778 and is now trading around the middle reaction zone. This looks like a recovery, but it is not a confirmed bullish reversal yet.
For beginners, this is an important moment.
After a sharp drop, price often pulls back to test key levels before choosing the next direction. That pullback can become a real recovery — or it can become a better area for sellers to return.
WHAT I SEE
The first area I’m watching is 1.15387.
This zone matters because it is the Fibonacci reaction area after the sharp drop. If EURUSD reaches this level and slows down, sellers may try to react again.
The higher resistance is 1.15738.
This is the breakdown support zone from before. When support breaks, it can often become resistance on the retest. That is why this level is important if price continues higher.
Below the market, 1.14966 is the first Order Buy zone.
This area matters because buyers may try to defend it if the recovery loses momentum. If price holds above this zone, EURUSD may attempt another bounce.
The deeper liquidity support is 1.14778.
If 1.14966 fails, price may return to this lower area to collect liquidity before the next reaction.
THE PLAN
📈 IF EURUSD holds above 1.14966 and breaks above 1.15387 with a clear bullish reaction:
→ Buyers may try to continue the recovery
→ Price could move toward the higher retest zone
→ Possible entry idea: after confirmation above 1.15387
→ Invalidation: below 1.14966
→ Target 1: 1.15738
→ Target 2: 1.1600
📉 IF EURUSD rejects from 1.15387 or 1.15738:
→ Sellers may return after the recovery move
→ Price could pull back toward 1.14966 first
→ If 1.14966 fails, the next downside area is 1.14778
→ Possible entry idea: after bearish confirmation from the reaction zone
→ Invalidation: above the rejection zone
→ Target 1: 1.14966
→ Target 2: 1.14778
⏳ No confirmation = no trade.
💡 Tiara’s Tip:
A recovery after a sharp drop is not always a reversal.
Sometimes price only comes back to retest the broken level before sellers step in again.
For beginners, the key is to watch how price reacts at resistance.
If EURUSD breaks resistance and holds above it, buyers are gaining strength.
If price rejects and falls back below support, the recovery may only be a correction.
YOUR TURN
💬 What’s your view on EURUSD — will buyers reclaim 1.15387, or will sellers reject the recovery first?
Drop a 🟢 for bullish recovery or 🔴 for bearish rejection below 👇  Long
Long
GBPUSD — Sell From EMA Value Zone & Fibonacci Levels
Fundamental Analysis
GBPUSD remains under short-term pressure as traders continue to watch USD strength, U.K. data, and upcoming macro events.
For now, the recovery has not confirmed a bullish reversal. Price is still trading below the key EMA resistance area, so pullbacks into value may continue to offer sell opportunities.
Technical Analysis
On the 2H chart, GBPUSD is trading around 1.3323 after a sharp bearish move from the upper range. Price is currently reacting near the strong support area, but the broader structure still favours sellers while the EMA 34, EMA 89, and EMA 200 remain above price.
The key zone to watch is the EMA value zone around 1.3380 - 1.3395. This area also aligns with the Fibonacci 0.382 retracement and previous broken support. If price pulls back into this zone and rejects, sellers may regain control.
There is also a short-term Fibonacci reaction level around 1.3355 - 1.3363, which can create a scalping sell reaction if price fails to recover strongly.
As long as GBPUSD remains below the EMA value zone, the main bias stays bearish. A rejection from the Fibonacci retracement levels may send price back toward 1.3320, then deeper to 1.3260.
Important Key Levels
Current price area: 1.3323
Strong support area: 1.3315 - 1.3330
Sell scalping zone: 1.3355 - 1.3363
Main EMA value sell zone: 1.3380 - 1.3395
Fibonacci 0.382 value zone: 1.3380 - 1.3395
Upper invalidation area: above 1.3415
First downside target: 1.3315
Main downside target: 1.3260
Trading Scenario
Main Sell Scenario
Entry: 1.3380 - 1.3395
Stop Loss: 1.3415
Take Profit 1: 1.3330
Take Profit 2: 1.3315
Take Profit 3: 1.3260
Sell Condition
The preferred setup is to wait for GBPUSD to pull back into the 1.3380 - 1.3395 EMA value zone. This area is important because it combines EMA resistance, Fibonacci retracement, and previous broken structure.
A sell setup becomes more valid if price forms bearish rejection from this zone, such as a long upper wick, bearish engulfing candle, failed breakout, or lower high formation below the EMA structure.
If price rejects from the value zone and breaks back below 1.3330, bearish pressure may continue toward 1.3315 and 1.3260.
Entry Conditions
Wait for price to retest 1.3380 - 1.3395.
Look for bearish rejection before entering sell.
Do not sell directly at strong support without a pullback.
If price breaks and holds above 1.3415, the sell setup is invalid.
Overall, the main view remains bearish while GBPUSD trades below the EMA value zone. The preferred plan is to wait for a corrective pullback into 1.3380 - 1.3395, then look for sell confirmation toward 1.3330, 1.3315, and 1.3260.
Do you share the same bearish view on GBPUSD, or are you waiting for a cleaner rejection from the EMA value zone?
EURUSD — EMA Bearish Trend, Sell From Value Zone
Fundamental Analysis
EURUSD remains under pressure as the market continues to watch USD momentum, Fed expectations, and upcoming U.S. macro data. If the dollar stays supported, recovery attempts on EURUSD may remain limited.
For next week, the main focus is whether price can retest the value zone above before continuing lower in line with the EMA trend.
Technical Analysis
On the 4H chart, EURUSD is still trading inside a descending channel. EMA 34, EMA 89, and EMA 200 remain above price, showing that the main structure is still bearish.
Price is currently around 1.1565 after reacting from the lower support area. However, this recovery is moving toward the Fibonacci value zone and EMA resistance area near 1.1615.
The main sell zone is around 1.1612 - 1.1627. This area aligns with the 0.382 - 0.5 Fibonacci retracement, EMA resistance, previous broken structure, and liquidity above price.
The key bearish confirmation level is around 1.1500 - 1.1510. If price rejects from the value zone and breaks back below this support, the bearish continuation scenario becomes stronger.
The weekly downside target is the Fibonacci 1.618 extension around 1.1387.
Important Key Levels
Current price area: 1.1565
Main sell zone: 1.1612 - 1.1627
Value zone / Fibonacci area: 1.1612 - 1.1627
Liquidity above: 1.1644 - 1.1646
EMA resistance area: 1.1592 - 1.1646
Key support zone: 1.1500 - 1.1510
Weekly Fibonacci target: 1.1387
Invalidation area: above 1.1646
Trading Scenario
Main Sell Scenario
Entry: 1.1612 - 1.1627
Stop Loss: 1.1646
Take Profit 1: 1.1510
Take Profit 2: 1.1450
Take Profit 3: 1.1387
Sell Condition
The preferred setup is to wait for EURUSD to pull back into the 1.1612 - 1.1627 sell zone. This area is the main value zone on the chart and also aligns with EMA resistance, Fibonacci retracement, and previous broken structure.
A sell setup becomes more valid if price forms bearish rejection from this zone, such as a long upper wick, bearish engulfing candle, failed breakout, or lower high below the EMA structure.
If price rejects from the sell zone and breaks below 1.1500 - 1.1510, the bearish continuation view becomes stronger. The next downside focus would be 1.1450, followed by the weekly Fibonacci target around 1.1387.
Entry Conditions
Wait for price to retest 1.1612 - 1.1627.
Look for bearish rejection before entering sell.
A break below 1.1500 - 1.1510 confirms stronger downside pressure.
If price breaks and holds above 1.1646, the sell setup is invalid.
Overall, the main view for next week remains bearish while EURUSD trades below the EMA structure and inside the descending channel. The preferred plan is to wait for a pullback into the Fibonacci value zone, then look for sell confirmation toward 1.1510, 1.1450, and the weekly Fibonacci target at 1.1387.
Do you share the same bearish view on EURUSD, or are you waiting for a cleaner rejection from the 1.1615 value zone first?
 Long
Long
Long 
 Long
Long
 Long
Long
EURCAD – Daily Double-Top Setup (Jun 15, 2026)My view is simple: we're back at the wall.
That red line at 1.6240–1.6250 is the same ceiling from mid-April. We tapped it, sold off hard to 1.5610 in March, rallied back, and now we're knocking on it again in June.
Two touches, same level, no daily close above = classic double-top resistance.
The structure underneath is still lower-highs after the March flush — April high 1.6250, May failed at 1.6120, June pushing back up but stalling just under the line.
Forecast idea (not advice):
I'm watching for rejection at 1.6240–1.6250. If we get a daily rejection wick + close back below 1.6180, the next magnet is the mid-range around 1.5950–1.5900 (where the pink arrow points). That's the May swing low area and the 50% of the March–June bounce.
Invalidation is clean: a daily close above 1.6270 breaks the double top and opens 1.6350–1.6400 (February highs).
Right now it's a "sell the resistance, not the breakout" setup — patience at the line.
Trade at your own risk.  Short
Short
US30: High-Probability SMT DivergenceAnalysis Explanation:
The correlation matrices between major indices reveal a phenomenal institutional accumulation footprint, setting up an explosive bullish continuation cycle.
Intermarket SMT Divergence Matrix: A massive Smart Money Technique (SMT) divergence has locked in between NASDAQ and US30. While NASDAQ forcefully swept through its historical cyclical lows, creating a deeper structural purge, US30 significantly failed to take out its corresponding lows. This critical divergence highlights that NASDAQ acted as the weak pair, while US30 emerged as the stronger asset, aggressively defended by institutional buying programs.
The Stop Hunt Validation:** Following the accumulation phase, US30 delivered a textbook intra-day STOP HUNT below key swing support levels. This highly engineered purge successfully swept retail sell-stops and trapped breakout sellers, providing institutional players with the necessary liquidity to fill massive long positions.
Order Flow Acceleration & Targets:** With the liquidity hunt successfully concluded, the market shifted heavily bullish. On the discount matrix, NASDAQ left behind a major Fair Value Gap (FVG), while US30 is holding firmly above a prominent Volume Imbalance array near 51,200. This structural defense points toward a massive expansion phase, tracking directly into premium buy-side liquidity pools resting at historical highs.
Configuration Details:
Asset: US30 (Dow Jones Industrial Average Index)
Timeframe: 4H (240M)
Direction: Buy / Long
Entry Limit: Re-test of the Volume Imbalance Mitigation Area (Near 51,250 - 51,400)
Invalidation Level: Below the recent institutional Stop Hunt low (50,000)
Main Target Range: 52,200+ (Premium Expansion Targets)
Note: Trading is risky. So always follow your own trading plan.  Long
Long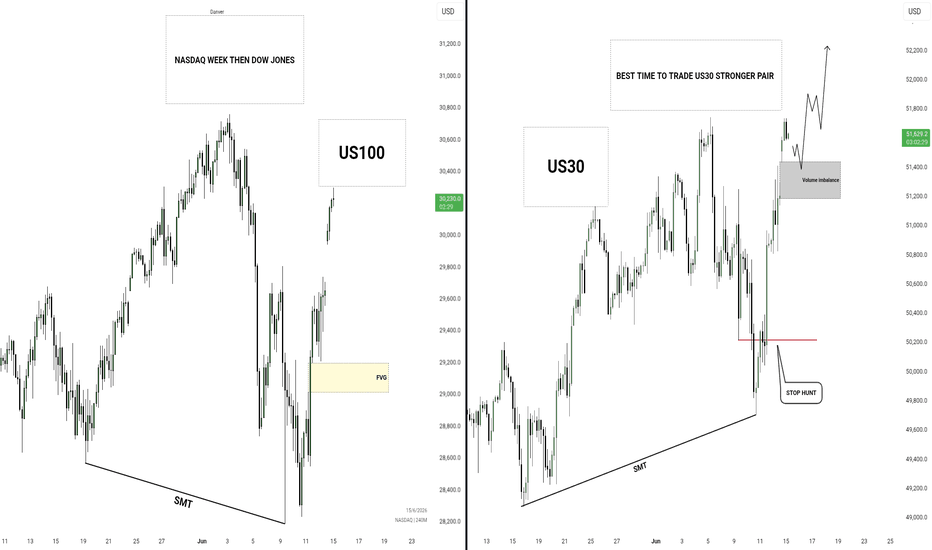
 Short
Short

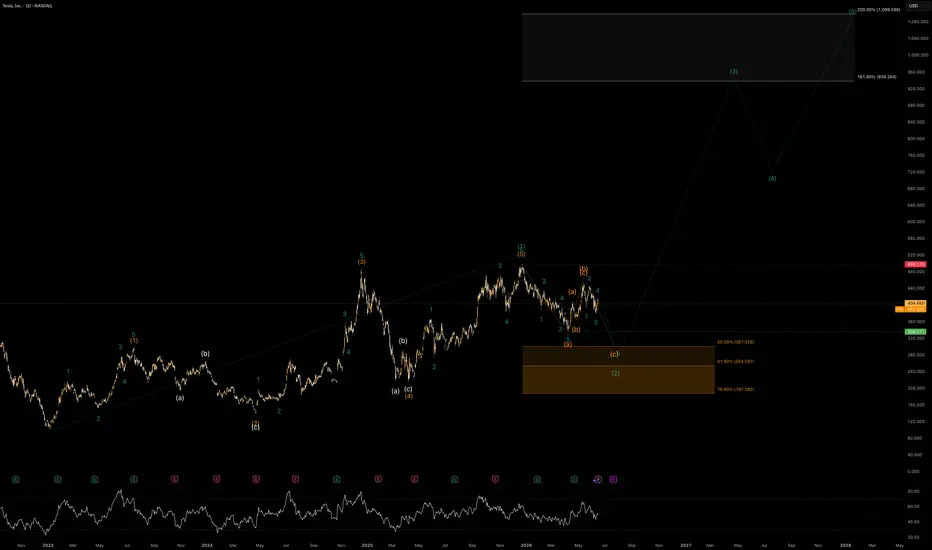
TSLA – Elliott Wave AnalysisTesla continues to display a very interesting long-term Elliott Wave structure. Based on the chart, the larger picture suggests that TSLA is developing within a major bullish impulsive sequence, while the current weakness is best interpreted as a corrective phase rather than the start of a new bear market.
Higher Time Frame Structure
From the broader low, Tesla appears to have completed a large impulsive advance into the early-2025 peak. That advance can be interpreted as a completed higher-degree wave b , followed by a sharp corrective decline into the spring 2025 low, which likely completed wave b .
From that spring 2025 low, price started another impulsive recovery. This rally unfolded in a clear five-wave structure and topped near the January 2026 high around the 498 region. That move is best counted as wave b of a new larger bullish cycle, or alternatively as the final subdivision of a larger impulsive leg. In either case, the structure from the low into the 2026 high looks impulsive and supports the view that the long-term trend remains constructive.
Current Market Phase – Corrective Wave (2)
Since the January 2026 high, TSLA appears to be in a corrective wave b . The decline is not yet showing the same clean impulsive strength as the previous rally, which supports the interpretation that this move is corrective in nature.
The current correction seems to be unfolding as an A-B-C structure :
Wave (a) started the initial decline from the high.
Wave (b) produced a temporary recovery.
Wave (c) now appears to be the active leg, with potential to complete the entire wave b correction.
Internally, the structure also shows smaller impulsive subdivisions within the decline, which is typical for a C-wave. This means the market may still need one more downward leg before the correction is fully mature.
Key Support / Fibonacci Reversal Zone
The chart highlights an important retracement area for the potential end of wave b . This zone lies roughly between:
50.0% retracement: 301
61.8% retracement: 254
78.6% retracement: 187
From an Elliott Wave perspective, the 301–254 area is the most attractive zone for a medium-term wave b termination. It would represent a typical corrective retracement after a completed wave b . A deeper extension toward 187 is still possible, but that would be a more aggressive correction and would likely require broader market weakness.
As long as TSLA remains above the origin of the larger impulsive advance, the bullish higher-time-frame structure remains valid.
Bullish Outlook After the Correction
If TSLA completes wave b inside the marked support zone, the next expected phase would be wave b . In Elliott Wave theory, third waves are usually the strongest and most dynamic part of the trend.
The projected upside path on the chart suggests the following roadmap:
Wave (3) could extend toward the 938 region
After that, a corrective wave (4) could follow
A final wave (5) could later push toward the 1,099 region
This projection is based on the typical extension behavior of third waves and the long-term bullish structure shown on the chart.
Confirmation Levels
For the bullish scenario to gain confirmation, TSLA should show:
a clear basing structure inside the Fibonacci support zone
a bullish impulsive rebound from that area
and eventually a break back above the recent corrective highs
A recovery back above the 498 area would strongly confirm that wave b has likely ended and that wave b is underway.
Risk / Alternative Scenario
The main risk to the bullish count is that the correction becomes deeper and more complex than expected. If price slices through the 50% and 61.8% retracement levels without a convincing reaction, then the market may be heading toward the deeper 78.6% retracement near 187 .
That would not automatically destroy the long-term bullish count, but it would delay the expected bullish continuation and weaken short-term sentiment significantly.
Conclusion
TSLA appears to be in a larger bullish Elliott Wave structure , with the current decline best viewed as a wave (2) correction following a completed impulsive wave b into the January 2026 high.
The most important area to watch is the 301–254 support zone , where wave b could complete. If buyers step in there and price begins to recover impulsively, Tesla could be setting up for a powerful wave (3) advance with long-term upside potential toward 938 and possibly 1,099 .
For now, the larger bullish scenario remains favored, but in the short term, patience is required until the current corrective structure is fully completed. Long 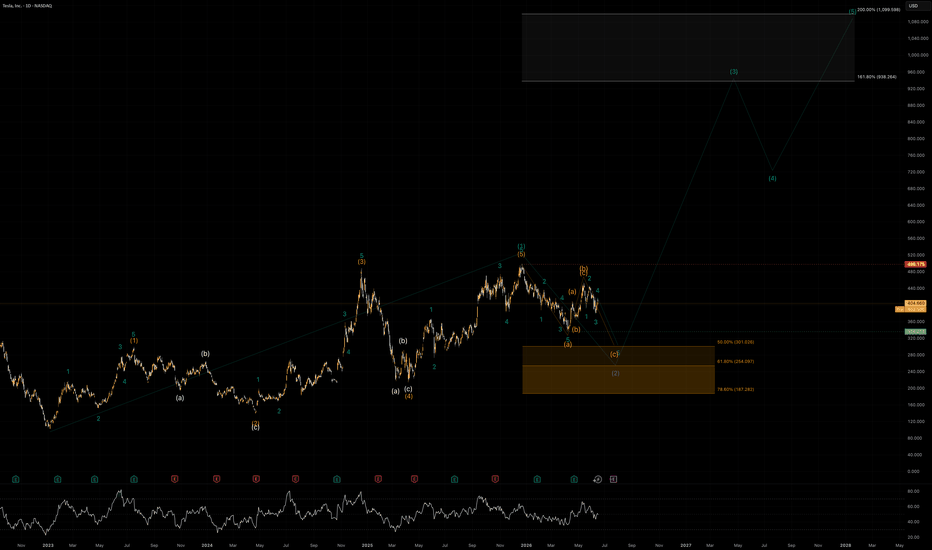
XAUUSD: BC2 + OTE Supply Before C?OANDA:XAUUSD is still trading inside an active bearish sequence.
The main idea is simple: as long as the bearish sequence remains valid, the larger draw remains the C target below. Price does not need to give a clean pullback first — it can continue lower and move directly toward C from here.
But if price does retrace, the key area I’m watching is the confluence above:
BC2 + OTE + Breaker Block
That zone is important because it combines structure, premium pricing, and a potential bearish reaction area. If price reaches that region with hesitation, weak momentum, or corrective movement, then selling pressure from that zone becomes very interesting.
I am not interested in blindly shorting just because price touches the box. The cleaner setup would be price approaching the zone slowly, showing weakness, then sellers stepping in with displacement or a clear lower-timeframe shift. That would give a much stronger short idea back toward the bearish C target.
There are three scenarios from here:
Price can continue lower directly toward C without reaching the selling zone.
Price can retrace into BC2 / OTE / Breaker Block, react bearish, and then continue toward C.
Price can invalidate the bearish sequence by breaking above the key high, which would open the door for continuation toward new all-time highs.
For now, based on current structure, the bearish sequence is still the active map. The best short opportunity, in my opinion, would come only if price pulls into the premium selling zone and sellers prove themselves.
SmellyTaz — decoding chaos.  Short
Short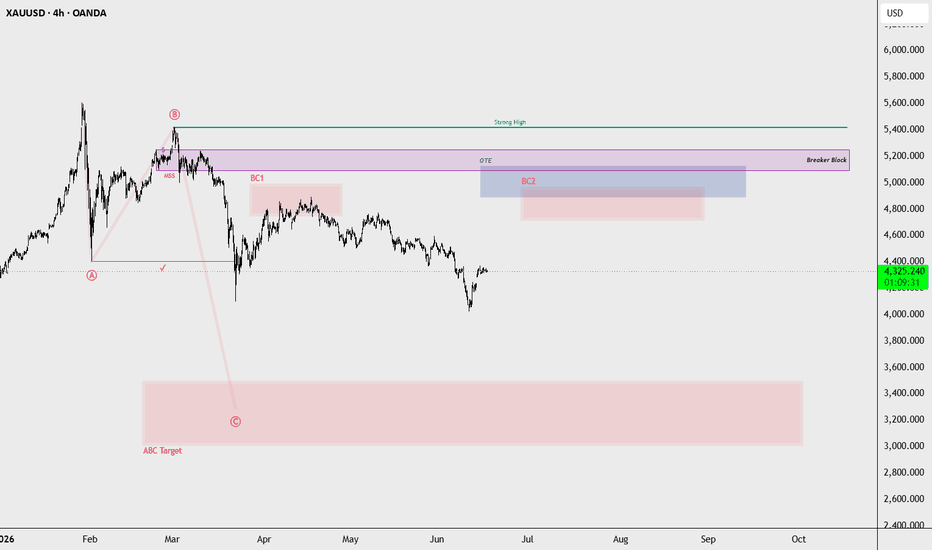
 Long
Long
 Long
Long