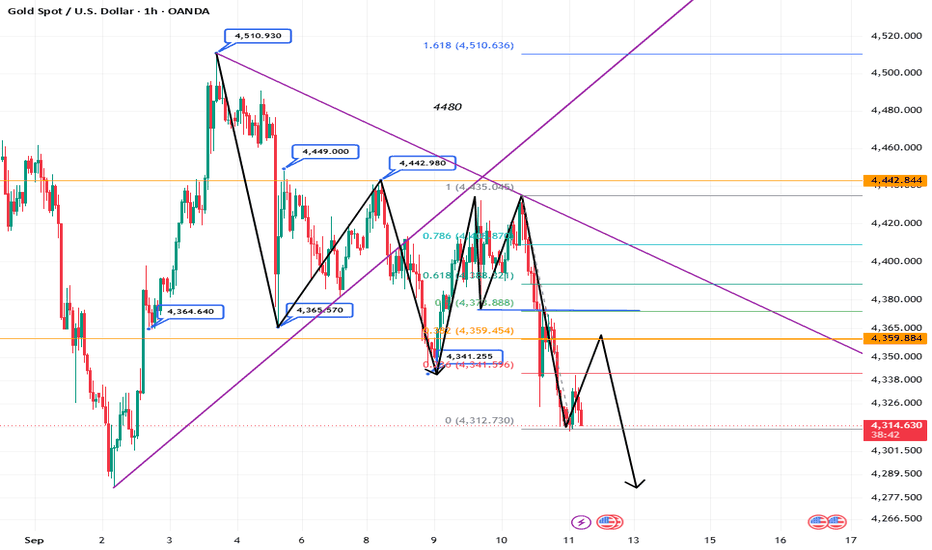
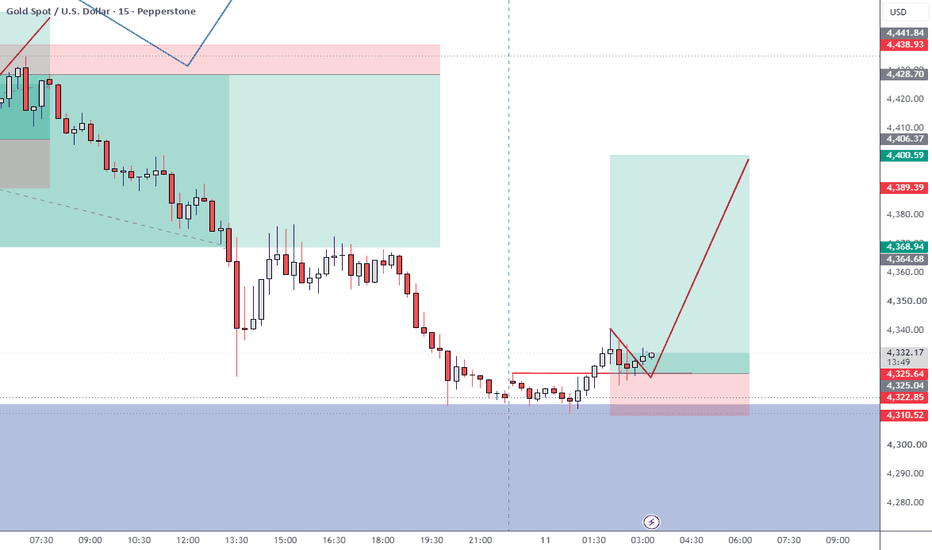
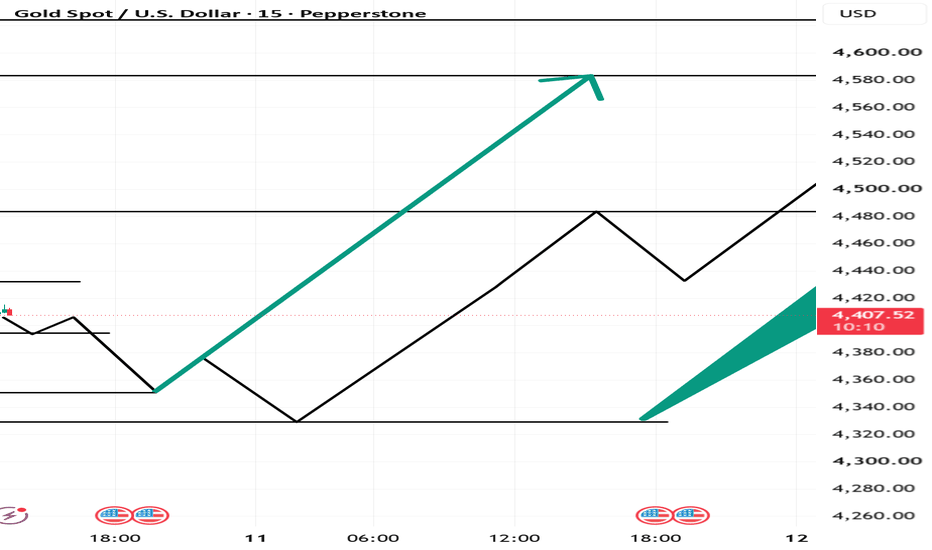
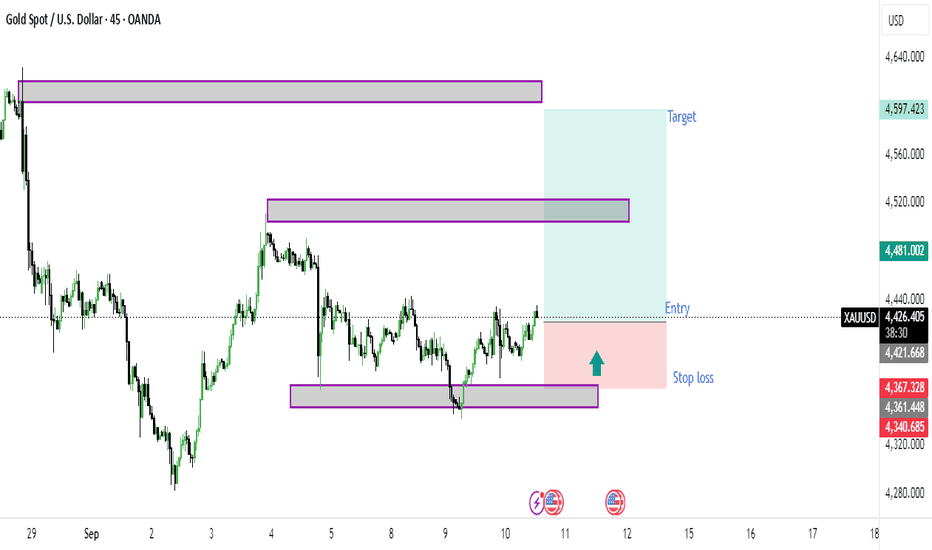
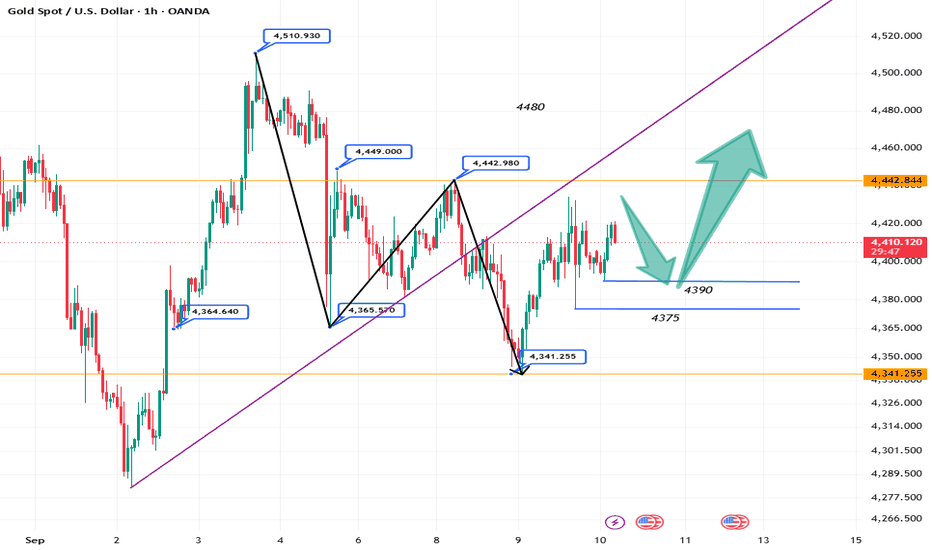
Gold Spot / U.S. Dollar — 1H Bullish Pullback Idea | July 06, 20Gold Spot / U.S. Dollar — 1H Bullish Pullback Idea | July 06, 2026
Symbol: XAUUSD / Gold Spot
Timeframe: 1H
Chart Date: July 06, 2026
Gold is currently trading in a bullish structure after a strong upside move. Price has already pushed close to the previous week high area, but I am not interested in chasing the move from here.
My main expectation is that price may first give a deeper pullback before continuing higher. The chart is showing possible downside liquidity around the previous day low and previous week equilibrium area. If price moves down into that zone, sweeps liquidity, and then forms a clean bullish reaction, that can create a better long opportunity.
The idea is simple:
Gold may pull back first to rebalance the move, collect liquidity, and then continue toward the marked higher-timeframe target.
For confirmation, I want to see:
Price pulls back toward the marked liquidity area
Sell-side liquidity sweep
Bullish reaction from the discount zone
Bullish dealing range / FVG formation
Continuation toward the upside target
I do not want to buy in the middle of the range. The better trade can come after patience, liquidity sweep, and confirmation.
Patience pays. Let Gold come to the right area first, then look for the clean setup.
Gann
XRP PERPETUAL TRADE SELL SETUP Short from $1.0640XRP PERPETUAL TRADE
SELL SETUP
Short from $1.0640
Currently $1.0640
Targeting $1.04 or Down
(Trading plan IF XRP go up to $1.10
will add more shorts)
Follow the notes for updates
In the event of an early exit,
this analysis will be updated.
Its not a Financial advice
GOLD DAILY The priceaction on daily is a bullish price action despite what anyone will think,the daily double bottom has its neckline at 4067 based on the daily line chart close zone,
Demadfloor 4067-4080 is valid until the daily candle closes below the structure.
Switch to 30min chart and 1HR chart to catch further divergence.
Am bullish on GOLD.my stance is based on the daily structure,except the structure is invalidation on daily ,then I will recalibrate and look for sell,as long as the double bottom is valid your bias should be bullish.
Disclaimer;this chart is just for educational purposes only.
Keep bullish bias only.
JULY 7 Bitcoin chart analysisHello
It's a Bitcoin Guide.
My analysis is optimized for TradingView.
If you press the Replay button, you can check real-time movements.
This is the Bitcoin 30-minute chart.
In the bottom left, the purple finger indicates the entry point for the long position entered on July 6th, which is currently being maintained.
*Regarding the movement path of the light blue finger, it is a two-way neutral strategy switching from Long to Short to Long.
1) $62,861.4 Long position entry point / Stop loss if broken below the green support line
2) $66,042.6 Short position switching / Stop loss if broken below the turquoise resistance line
3) $64,185 Long position switching / Stop loss if broken below the green support line
(Same stop loss for those maintaining a long position at 61.8K)
- As the MACD Dead Cross on the 6-hour chart is still in progress, please pay attention to the new candle that forms at 9 o'clock shortly. Please be cautious, as a break below the green support line today could lead to a bottom zone.
Please use my analysis merely as a reference and for practical purposes.
I hope you trade safely by adhering to trading principles and strictly using stop-loss orders.
Thank you.
| USDCAD | SHORT | + 3% USING DXY CONFLUENCE 📈| Q3 | W28 | D6 | Y26 |
📊| USDCAD | SHORT | + 3% USING DXY CONFLUENCE
💡| FRGNT DAILY CHART ANALYSIS |
This forecast is built using an advanced adaptation of Smart Money Concepts, with a structured and disciplined approach:
• Marking Key Points of Interest (POIs) on Higher Time Frames (HTFs) 🕰️
• Defining a clear, controlled trading range from those zones 📐
• Refining entries on Lower Time Frames (LTFs) 🔎
• Waiting for confirmed Break of Structure (BoS) before execution ✅
This process ensures precision, removes emotional decision-making, and keeps me aligned with the overall market narrative.
💡 Core Philosophy
“Capital management, discipline, and consistency create longevity.”
A strong risk-to-reward model, paired with high-probability execution, is the foundation of sustainable trading 📈🔐
⚠️ Understanding Losses
"Losses are part of the game" — a mathematical certainty 🎲
They don’t define performance. Nor do they define you as a Trader.
They are managed, reviewed, and used as evidence for growth 📊
🙏 Final Note
Appreciate you taking the time to review today’s forecast.
Stay disciplined 🎯
Protect your capital 🔐
— FRGNT 🚀📈
📌 Disclaimer
This content is provided for educational purposes only and does not constitute financial advice.
It reflects my personal approach to the markets — a tested framework that has supported my own journey toward consistent profitability in currency trading.
Please understand that any forecasts shared are not financial advice. I will be looking for confirmation in line with my setup model and specific entry criteria from the key areas identified on the chart.
All analysis, whether presented via image or video, is shared strictly for educational insight and is not intended to breach any TradingView House Rules.
FX:USDCAD
US30 1H: Trapping the Channel Buyers (Bearish Breakdown Setup)1. Market Context
On the 1H chart, US30 is trading within a well-defined ascending parallel channel. After a sharp rejection from the channel's upper boundary around 53,279.9, the price collapsed rapidly and is currently consolidating right above the critical ascending trendline support and local horizontal level at 52,793.7.
2. Sentiment & Price Trap Analysis
• The Retail Buyer Trap: Retail traders are aggressively opening long positions at the touch of the ascending trendline support (marked "Buyer"), expecting a typical bullish bounce back toward the upper channel limit. This heavy retail buying behavior has clustered a massive pool of sell-stop liquidity (stop losses) directly beneath the 52,793.7 support floor.
• The Breakdown Trigger: Institutional algorithms are likely keeping the price suspended temporarily to induce more retail buyers into the trap. Once the accumulation of long positions is complete, a decisive break below the 52,793.7 support will trigger a domino effect of stop-loss market orders (selling pressure).
• The Downward Expansion: The forced liquidation of trapped buyers will rapidly accelerate the downward momentum, driving the market straight into the deeper liquidity pools and structural support zones at 52,307.5 and 51,821.3.
3. Trade Setup
We target a high-probability short entry on the confirmed breakdown of the trendline support to capitalize on the trapped buyers' liquidation momentum.
• Entry: 52,793.7 (Selling the confirmed breakdown of the trendline and local support)
• Stop Loss (SL): 53,279.9 (Placed safely above the recent swing high/consolidation top)
• Take Profit 1 (TP1): 52,307.5 (First major horizontal support zone)
• Take Profit 2 (TP2): 51,821.3 (Ultimate target / lower structural expansion level)
• Risk-to-Reward Ratio (R:R): Approx 2:1 (Calculated based on TP2)
NIFTY SENTIMENT ANALYSIS FOR 08/07/2026# NIFTY | Gap Down, But Is It Really Bearish? | Time + Price Analysis | 08 Jul 2026
Today's session began with a noticeable gap-down opening, and naturally, the first reaction from most traders was to turn bearish.
My model disagrees.
A gap is only the opening price.
The real question is whether the market accepts lower prices or rejects them.
Yesterday's analysis gave me more confidence in this framework. The market respected the projected behaviour, decision zones, and sector leadership with remarkable precision. The objective isn't to predict every candle—it's to identify where probabilities shift.
## Market Sentiment
🟢 Primary Bias: Strong Bullish
⚠️ Hidden Character: Bullish + Trap / Conflict
This combination suggests that while the broader trend remains constructive, intraday volatility and liquidity sweeps are still possible. Instead of chasing the first move, I'm watching how the market responds after absorbing the opening weakness.
## Key Levels
🟣 Opening Anchor: 24,243.50
🔴 Resistance 1: 24,304.50
🔴 Resistance 2: 24,360.50
🟢 Support 1: 24,192.50
🟢 Support 2: 24,170.90
🟢 Major Support: 24,136.50
## Time Anchor
⏰ 12:40 PM IST
This is the decision window I'll be monitoring closely.
If buyers reclaim and sustain above the Opening Anchor after this time, today's gap-down could simply become a liquidity event before continuation.
Failure to do so would indicate that sellers are still in control.
## Sector Leadership
🥇 Banking
The Banking sector remains my preferred area to monitor for leadership. If the bullish thesis is correct, financials should participate before the broader market follows.
## Trading Plan
✔ Don't trade the gap.
✔ Trade the market's reaction to the gap.
✔ Respect the Opening Anchor.
✔ Let price confirm before committing.
## Final View
The market opened weak.
That doesn't necessarily mean the day will finish weak.
Sometimes the opening creates fear.
Sometimes fear creates opportunity.
Today isn't about predicting direction.
It's about identifying when the market changes character.
---
💬 What do you think?
Will NIFTY reclaim 24,243.50 and turn today's gap-down into a bullish recovery...
or is this the beginning of a deeper correction?
Share your analysis below. I enjoy reading different market perspectives.
If you found this analysis valuable, don't forget to Boost 🚀 and Follow for daily Time + Price market intelligence.
Educational purpose only. Not investment advice.
Nifty Futures hourly trend analysis till July 10As per the cycles analysis, I foresee the Nifty Futures to close below 24140 by July 10th or 13th, 2026.
Though it's not a recommendation to buy or sell, traders must follow their own technical confirmation while trading. There is a substantial risk trading in derivatives.
MU 4H: Micron Reversal Setup After Sharp PullbackNASDAQ:MU
📌 Structure: Micron pulled back sharply on the 4H chart after an extended rally, a healthy retracement within a broader uptrend rather than a technical breakdown.
📌 Support Zone: Price is holding above the recent basing structure, keeping the bullish reversal setup intact as long as this support level holds.
📌 Sentiment: Micron stays central to the AI and data center memory demand story, keeping broader sentiment constructive on dips like this one.
📌 Catalyst: Watch for continued memory chip pricing strength and AI infrastructure spending headlines, a breakout above resistance would confirm the next leg higher.
📍 Entry: 938.48
🎯 Target: 1059.00 : aligns with the next resistance zone in this technical analysis and price prediction, a clean breakout here would open room toward new highs
Not financial advice, just reading the chart as it develops.
EURGBP 4H: Reversal Setup Forms at Key SupportOANDA:EURGBP
📌 Structure: Price has sold off sharply from the 0.8620 area over the past two weeks, and the 4H chart now shows compression and basing just above 0.8540, a pattern that often precedes a reversal or relief bounce.
📌 Support Zone: 0.8495 to 0.8540 has held on repeated retests this week, a sign sellers are losing momentum into current levels.
📌 Sentiment: EUR and GBP continue to diverge on central bank rate expectations, keeping this pair sensitive to any shift in the ECB vs BoE outlook.
📌 Catalyst: Eurozone and UK data prints later this week could confirm the base or invalidate it, watch for a breakout above resistance to trigger the next leg.
📍 Entry: 0.8545
🎯 Target: 0.8599 : aligns with the measured move off the recent basing structure, a key resistance/reversal level to watch for confirmation
Not financial advice, just reading the chart as it develops.
XAUUSD: Liquidity Grab Before Expansion? Bulls Watching Key DemaXAUUSD: Liquidity Grab Before Expansion? Bulls Watching Key Demand Zones
Gold remains under short-term pressure after rejecting the weekly resistance around 4220, but the broader structure still favors bullish continuation as long as the highlighted demand zones hold.
Price is currently approaching a key reaction area between 4040 - 4075, where previous liquidity and institutional buying interest are located. A deeper sweep into 3940 - 3960 cannot be ruled out and would likely serve as a final liquidity grab before a larger move higher.
Key Levels:
Resistance: 4120 → 4220 → 4340
Support: 4040 → 3960 → 3940
Bullish Scenario:
A successful defense of the demand zones could trigger a recovery toward the weekly resistance at 4220, followed by an extension toward 4340+ in the coming sessions.
The market appears to be building liquidity beneath current prices while maintaining a higher timeframe bullish outlook.
Bias: Bullish after liquidity sweep into demand zones.
Patience remains the edge — let price come to the levels, not the other way around.
Alphabet - The next textbook swingtrade!👑Alphabet ( NASDAQ:GOOG ) is preparing a major move:
🔎Analysis summary:
Over the course of the past couple of days, Alphabet already corrected about -15%. And with this short term correction, Alphabet is also creating a decent break and retest. Either at this or the next support, Alphabet will create a reversal and then new all time highs.
📝Levels to watch:
$350 and $ 280
Keep your #LONGTERMVISION🙏
— Phil (@TheTraderPhil)
Early market close today; continue buying on the pullback.Today is Friday, and market sentiment is not high, so price fluctuations are not expected to be significant. A real surge in bullish volume is likely to occur next week. Therefore, we can treat today's market as a short-term trend. The short-term resistance is around 4200. It would be safer to enter a long position when the price falls back to the 4120 range. After forming multiple bottoming patterns on the 1-hour chart, gold prices surged rapidly upwards, indicating strong short-term bullish momentum. Gold has a key short-term support level around 4100. In the short term, as long as gold stays above 4100, it's a good time to buy on dips. Because the US market closed early today, the market movement may be limited. It's best not to chase the rally too aggressively for now and patiently wait for a pullback.
Currently, it is advisable to buy around the 4130 point level.Chuck suggests a small long position around 4130, which is just touching the strong support level of the hourly MA60. Any pullback in the short term is an opportunity to buy with a small position. The key level to watch is 4080. As time goes by and the price shifts upwards, the target price is adjusted to 4100. Short-term declines are just pullbacks and should not be seen as reversals. Currently, the price is around 4140 (be careful with your position size). Consider adding to your long positions in the 4120-100 area, with a stop-loss order below 4100.
JULY 6 Bitcoin chart analysisHello
It's a Bitcoin Guide.
My analysis is optimized for TradingView.
If you press the Replay button, you can check real-time movements.
This is the Bitcoin 30-minute chart.
Since a MACD Dead Cross is currently in progress on the 6-hour chart,
consolidation is highly likely.
*Long Position Strategy: Before and after the touch of the purple finger at Zone 1 at the top
1) After confirming the touch of the purple finger at Zone 1 (Short at your discretion)
The red finger at the bottom marks the entry point for the long position at $62,568.8 / Stop loss price if the purple support line is broken
2) $63,644.2 is the first target for the long position -> Target prices in the order of Top, Good
*If the price drops immediately without touching the purple finger
Wait for the final long position at Zone 2 at the bottom
Stop loss price if the green support line is broken
Please be careful, as the price could fall as low as the Bottom if the green support line is broken.
Please use my analysis post only as a reference and for practical use.
I hope you operate safely by strictly adhering to trading principles and using stop loss prices as a necessity.
Thank you.