NIFTY SENTIMENT ANALYSIS FOR 11/09/2026NIFTY SENTIMENT ANALYSIS
11 SEPTEMBER 2026
TODAYS MARKET THESIS
BULLISH
STRONG BULLISH
EXPLOSIVE BEHAVIOUR
CE DOMINANT
The interesting part is the conflict.
The Hybrid Engine is strongly bullish.
The Tantra Unified Engine is showing Mild Bearish force.
So today's session is not about blindly choosing a side.
It is about watching which force gets confirmed by price.
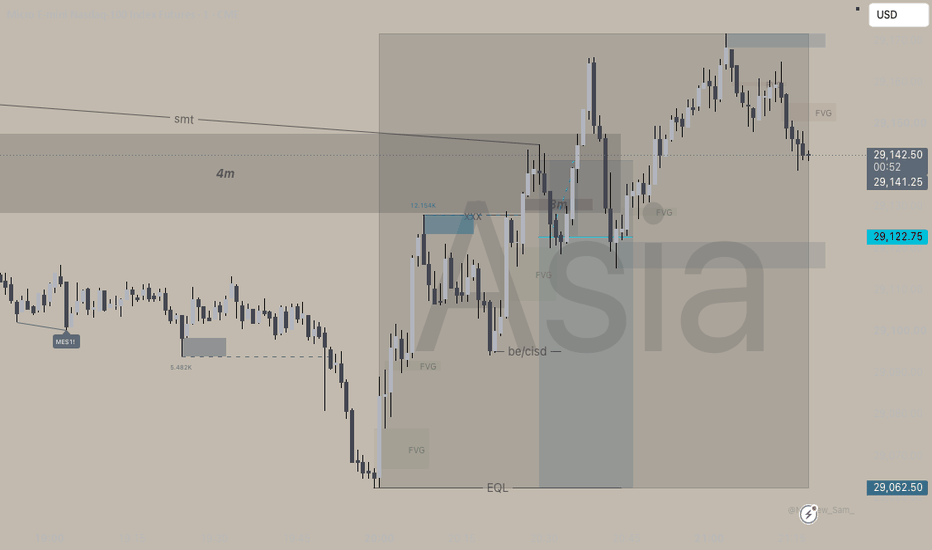
PRICE MAP
23,335 Major Resistance
23,277.30 Opening Price
23,225 Key Support
23,165 Major Support
ANCHOR TIME
11:45 AM
Gann
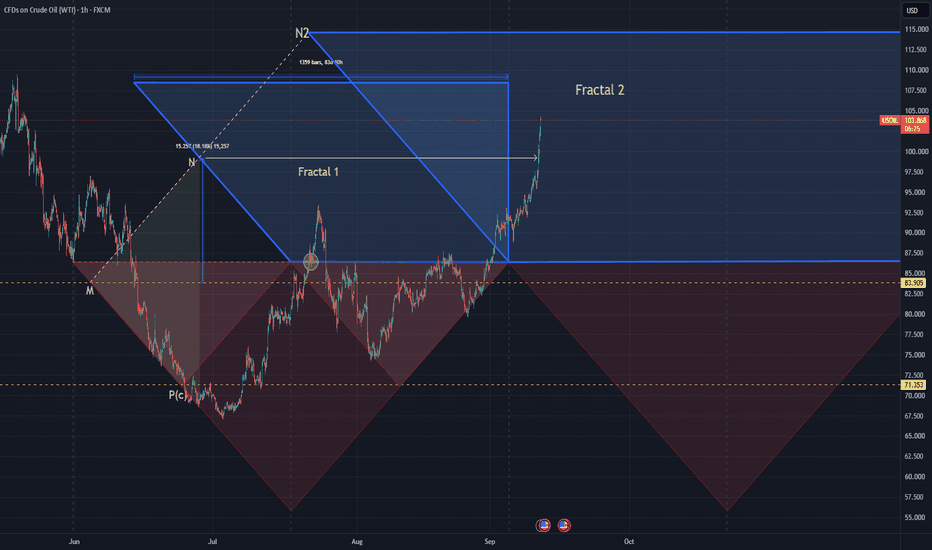
Market DNA Oil Cycle 4 phase 3 of 4Will the next phase be Phase 4? We are navigating the market to see what happens next
Phase: 1
Primary Entry M: 83.905$
Secondary Entry P(c): 71.353 $
Mean Entry: (83.905+71.353)/2=77.629$
Trapezoid Time Duration: 80 Days
3th Triangle domain (%): 2 * 18.18% = 36.36%
Risk coefficient:1
Risk domain (%): (3th Triangle domain) *(Risk coefficient) = 36.36%*1=36.36 %
Hypothetical Capital: 100,000$
Contract Size: 1000 Barrel
Expected Max Drawdown (%): 5%
Expected Max Drawdown $: 100,000 * 5% = 5,000
E
Too Much Risk in the Indices
The system I made launches median lines at the breakout and then waits for the pullback to trade. Very simple and to the point.
In this case I drew a dashed horizontal line, which would be the line that had to break to calculate the set.
The important thing is that it's actually on the upper parallel after a whole lot of bullish movement, and from what I can see, it's reverting to the center.
I don't suggest buying at this position, mainly because the profit margin is limited before facing
VIX - Last Action-Reaction Set and a Long ConsolidationSince I objectified my methods I don't draw a single line even by chance, everything comes from the systems' automatic calculations, including the trading. That being said, this is the last and only median line detected in VIX, which by the way, generated the typical "buying at a discount" trade:
The issue now is that since this trading range was created, prices could never overcome a new high or low, but rather began to contract within the range.
Low intact:
High intact:
So ultimately
|EURUSD SHORT | FRGNT DAILY CHART ANALYSIS | OVERNIGHT HOLD |📈 | Q3 | W37 | D10 | Y26
📊 |EURUSD SHORT | FRGNT DAILY CHART ANALYSIS | OVERNIGHT HOLD |
💡 | PATIENCE
This forecast is built using FRGNT X SMC — my advanced adaptation of Smart Money Concepts — applying a structured, disciplined approach to market analysis.
The process consists of:
🕰️ Identifying High Time Frame (HTF) Points of Interest (POIs)
📐 Defining a clear and controlled trading range
🔎 Refining opportunities on Lower Time Frames (LTFs)
✅ Waiting for confirmed Break of Structure (BoS)
JPN225 – D1 | Bearish BiasJPN225 – D1 | Bearish Bias
JPN225 continues to trade inside a broad consolidation after being rejected from the 69K–70K supply zone. The daily structure remains bearish, with lower highs and price currently testing the 64K support area.
As long as price remains below 66K–66.8K, the preferred scenario is sell on rallies.
🔴 Key resistance: 65K / 66K–66.8K / 69K–70K
🟢 Key support: 64K / 60K–61K
A confirmed daily close below 64K could open the way toward 61K–60K.
On the other hand, a daily recl
NZDUSD Bearish Continuation SetupNZDUSD is trading below a clear descending trendline, maintaining a bearish structure. The chart shows a potential rejection from the trendline, followed by downside continuation. A break below the recent support could strengthen the bearish move.
**Target:** **0.5800–0.5805** support zone.
SEPTEMBER 9 Bitcoin chart analysis.Hello
It's a Bitcoin Guide.
My analysis is optimized for TradingView.
If you press the Replay button, you can check real-time movements.
This is the Bitcoin 30-minute chart.
Since the overall medium-term pattern has broken down,
we may see significant volatility in both directions.
*A neutral strategy (trading both directions)
applied around the "Purple Finger #1" zone at the top:
1) After confirming a touch of the Purple Finger #1 zone at $79,791 (consider a short position),
look to ent
CHFJPY Pressing Against 0.786 Support ArcCHFJPY Price Outlook: Swiss Franc / Japanese Yen Pressing
Against 0.786 Support Arc | Potential Breakdown Toward
189.10
Swiss Franc / Japanese Yen (CHFJPY): Arc Cycle Analysis
Overview: Based on Arc Cycle Analysis applied to the 4h chart, Swiss Franc / Japanese Yen is
interacting with the 0.786 Support Arc within the current Arc Cycle. Price is testing this Support
Arc, suggesting the potential for a bearish breakdown toward the next Support Arc.
Market Outlook
Price is testing the 0.7
XAUUSD – "THE 4,583 SHOWDOWN"Leo | 10/09/2026 (Thursday)
🌍 REALTIME MACRO
Folks, today there are 2 important USD events Leo is watching – that's why gold's "silent and waiting":
08:30 ET – PPI for August (Orange – High Impact) ⭐: Producer Price Index – if PPI comes in hotter than forecast → USD firm → gold drops deeper. If PPI cools → USD weak → gold has reason to bounce hard.
08:30 ET – Initial Jobless Claims (Yellow – Medium Impact): First-time unemployment claims – if > 230K = weak labor market = USD weak = gold ha
| Q3 | W37 | D10 | Y26 |AUDUSD | FRGNT DAILY CHART ANALYSIS | S📈 | Q3 | W37 | D10 | Y26
📊 |AUDUSD | FRGNT DAILY CHART ANALYSIS | SHORT FORECAST |
💡 | No longs personally due short daily order block | confirmation for shorts required.
This forecast is built using FRGNT X SMC — my advanced adaptation of Smart Money Concepts — applying a structured, disciplined approach to market analysis.
The process consists of:
🕰️ Identifying High Time Frame (HTF) Points of Interest (POIs)
📐 Defining a clear and controlled trading range
🔎 Refining opportunities on Lower
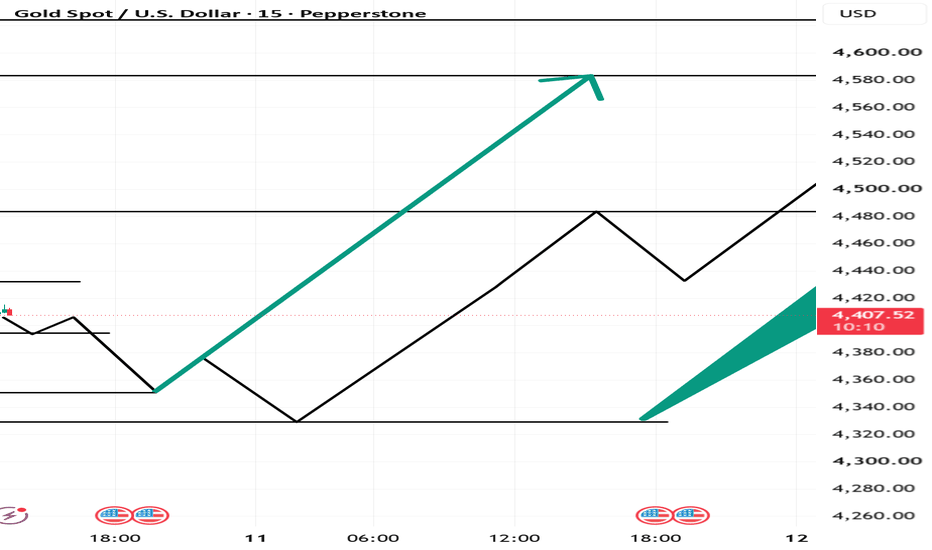
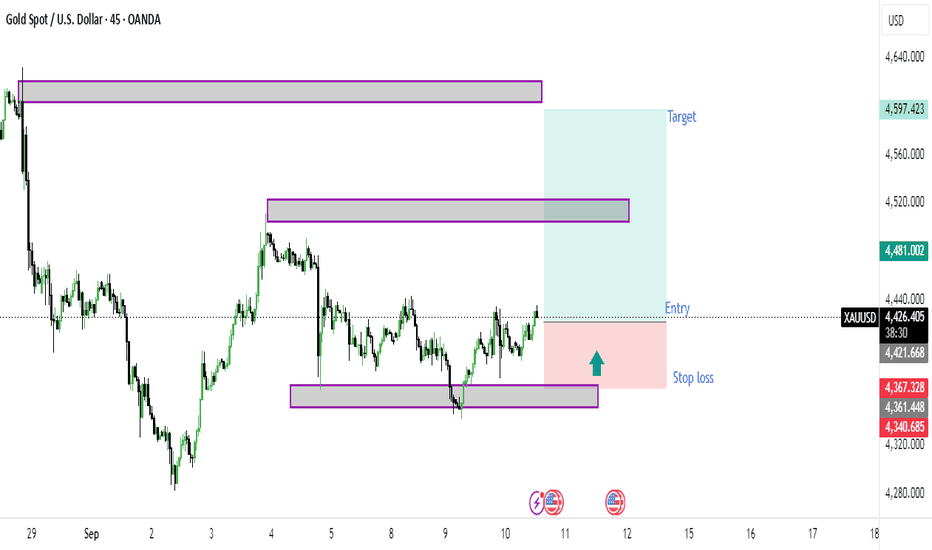
Range Support Holding With Upside Levels in FocusGold (XAUUSD) on the 45-minute chart is showing a recovery from the 4,360–4,375 support zone after a period of consolidation.
Price is currently around 4,430, with the recent structure showing higher lows from the lower support area. The chart highlights 4,420–4,430 as the current decision area.
If price maintains strength above this region, the next important zone to watch is around 4,510–4,525, followed by the upper resistance area near 4,590–4,610.
Key levels from the chart:
Current area:
NIFTY SENTIMENT ANALYSIS FOR 10/09/2026NIFTY SENTIMENT ANALYSIS
10 SEPTEMBER 2026
TODAYS THESIS
MILD BEARISH
EXPLOSIVE BEHAVIOUR
CE DOMINANT
PRICE MAP
23,561 Resistance
23,505 Key Level
23,449.60 Opening Price
23,393 Support
23,337 Major Support
ANCHOR TIME
9:55 AM
The anchor time is still ahead.
The model has already published the hypothesis, the price levels and the timing window.
Now we wait for price to confirm or reject the thesis.
There is an interesting conflict in today's engines.
The Hybrid Engine gives Bullis
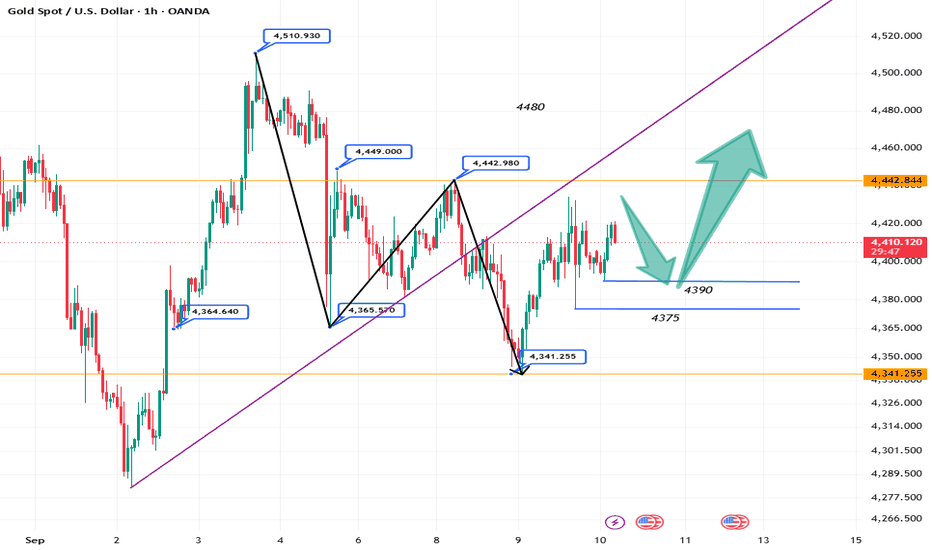
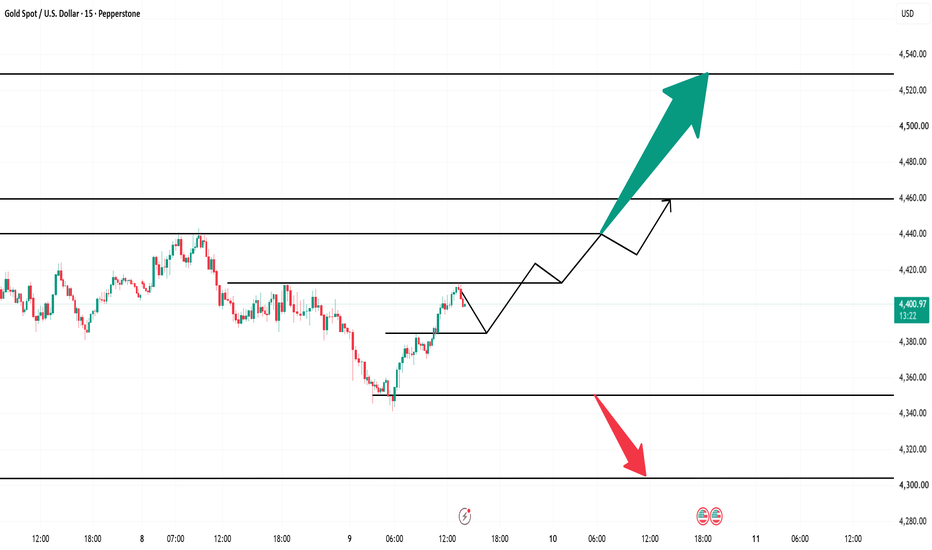
XAU/USD: Buy strategy for September 10After opening yesterday, gold dropped to a low of $4,341.3 before rebounding. It surged significantly during the European and US trading sessions, peaking at $4,434 before pulling back to close at $4,400. On the daily chart, the KDJ indicator formed a "golden cross" after being in oversold territory, the trend indicator turned upward, and the MACD bearish momentum bars contracted; the overall daily trend leans bullish, with potential to break above this week's high of $4,443 today.
On the hourl
Fake Break Rejection & Contingency Short Plan (Bull Trap)XAUUSD 1H:
1. Market Context & Plan Update
Yesterday's bullish breakout attempt at 4,409.541 failed to generate follow-through momentum, resulting in a sharp "Fake Break" rejection near 4,425.00. Price has now reversed violently and broken below the blue ascending support trendline at 4,350.113 ("Break Signal"), invalidating the long setup and activating our Contingency Short Plan.
2. Sentiment & House Trap Analysis
• Where Traders Place Orders: Retail traders who bought yesterday's trendline
XAUUSD – "THE 4,459 BATTLE": GOLD SIDEWAYS, WAITS FOR THE BREAK! 🌍 REALTIME MACRO BACKDROP
Folks, today there is **no "bomb" news** on the US economic calendar – no CPI, no NFP, no FOMC – the market is in a **"holding breath waiting for breakout"** state. 📌 *However, the real-world macro is still hot:*
- **Gold price:** Spot **4,395 – 4,431 USD/oz**, currently **4,407.24** (testing the range floor).
- **USD (DXY):** **98.78 – 98.92** – USD bouncing slightly but still sideway at multi-month lows, **no clear breakdown signal yet** – that's why gold hasn't
EUR/GBP (EURGBP) – Bearish Setup | Target: 0.8474 #54Fibonacci Arc Analysis combines Fibonacci geometry with Time and Price to identify dynamic support and resistance boundaries. In Arc Cycle Analysis™, price movement between these Arcs is used to identify the current market cycle, potential scenarios, and projected targets.