USD/CHF - LongI'm currently in this trade, inverted Head and Shoulders pattern, break and retest off of a neck line. Longby WealthShiftVentures0
Ethereum Analysis: Head & Shoulders Breakdown in Progress?Ethereum appears to be forming a **Head & Shoulders** pattern, most clearly visible on the **1H to 4H timeframes**. This is the primary structure I'm watching, as it could signal a shift in momentum if the pattern continues to develop. Using the **Fibonacci retracement tool**, I've noticed that price has consistently respected the **golden pocket** before beginning to break below the **38.2% retracement level**, suggesting that sellers may be gaining control. Another area I'm watching is the *Shortby bigdreamsrichmotives0
Diamond Top, Trendline Test: QQQ's Make-or-Break MomentQQQ ran in a powerful, clean uptrend from the April low near 558 to a peak just above 745 in mid-July — essentially an uninterrupted V-recovery with barely a pause until price reached the low-700s. That's the move captured by the yellow trendline. The diamond top: Once price hit the 700-745 zone, it stopped trending and rotated into a diamond formation — price action first widening (higher highs, lower lows) then compressing back to a point. Diamonds that form after an extended advance are clasby QuantAi-TrendUpdated 22
EURAUD - Bullish MoveHello, Traders! 👋 The EURAUD price has formed an Inverted Head & Shoulders pattern. The neckline has now been broken, confirming a bullish breakout. So, I expect a bullish move. 🎯 Target: 1.64835Longby Hsan_BenhmedUpdated 512
USAR: Head & Shoulders, Bounce Off Support, Possible Kumo BounceThis was another Soloway tip. He presented it as a day-trade or short swing-trade opportunity. He predicted a bounce off the support line. I rather expect, come Monday, that's what we'll see. I don't think he mentioned anything about the head and shoulders. But it's there. If the bounce makes it up to the Kumo, you could see a second bounce--a Kumo bounce. Ideally, you'd like to see rejection of the Kumo in the form of an expansion candle, bearish engulfing, or pin. So, price could gShortby troydowvanzandtUpdated 12
BUG: A bullish SetupBreakout of Previous ATH and Retest while forming series of HH, HL SL and TPs are highlighted Keep trailing SL while riding the trendLongby YASIRWA5
$UNH Head & Shoulders in the makingNYSE:UNH An important observation on this short. One day reversal Earnings were a beat which created a huge spike that was completely reversed the same day. At the top (including our example of a local top), that usually indicates a change of trend. Needless to say, the volume here checks out. I will be looking to sell short if the neckline breaks below with a set timer on that event. Ideally on good volume. The borrow rate on UNH is extremely low at 0.40% so it only makes sense to sShortby idbb112
BTC just completed a continuation Head & Shoulders patternCRYPTOCAP:BTC Bitcoin price action has been incredible in the last few months. 3x continuation Head & Shoulders patterns completed (A, B, D) with B and D being shoulders of the inverted Head & Shoulders pattern C that is in the making. Let's see how far the D pattern drags down the price. D Target: $58,350 (-7.00%) C Target: approx $76,000 (14.00%)Shortby idbb13
AMC | Trifecta: Blockbuster Revenues, Layoffs and 5 Year CoilWhether your tracking theater chains like AMC capitalizing on a massive post-pandemic box office rebound, or major media empires like Disney and Paramount getting lean, this general-purpose, high-energy information is built for you. Every now and then, the market creates a structure so beautifully wound up that ignoring it becomes a financial hazard. We are looking at a classic turnaround story backed by brutal corporate efficiency, explosive consumer demand, and a multi-year technical pattern Longby DivergenceSeekerUpdated 526
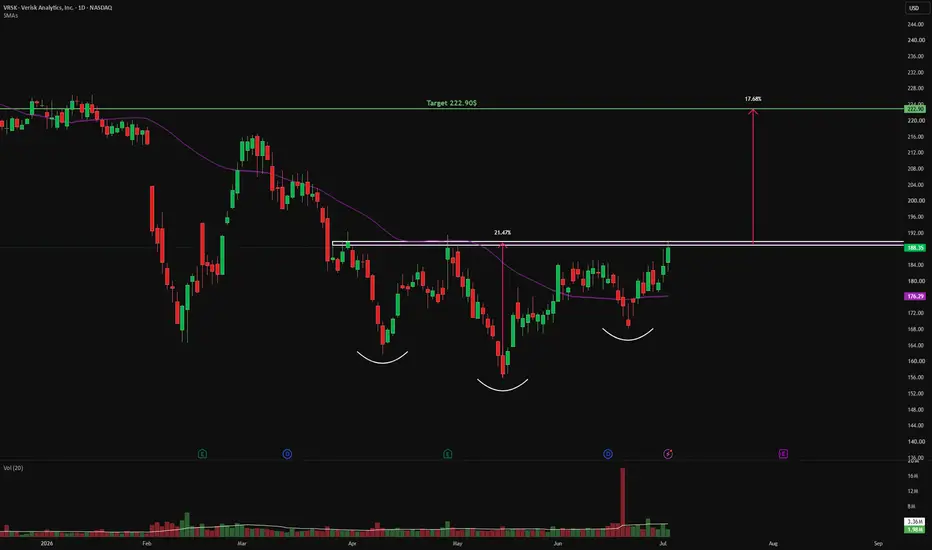
$VRSK - Reverse Head and Shoulders Pattern💡 Swing setup idea 50 SMA breakout 🔎 Analysis summary: The stock broke above the 50 SMA and is currently closing a reverse head and shoulders pattern. 👀 Levels to watch: Entry trigger: Break above $189.85 Target: $222.90 Stop: Under the breakout level 💬 What do you think of this setup? Let me know in the comments! 👇 Good luck! ⚠️ Note: This is for educational purposes only and is not financial advice.Longby Kochva_Updated 3
MU: Head & Shoulder Neckline Breakdown Failed!MU showed Head and Shoulder Pattern with a breakdown from neckline. However, neckline could not be sustained and the price has moved above the support line (neckline) confirming a fake breakdown. Interestingly, MA 100 has shown significant support for MU historically and has taken support from 100MA recently. Trade plans are provided along with SL and TP levels. Mange your risk properly while trailing your SL. Enjoy the ride!Longby YASIRWA12
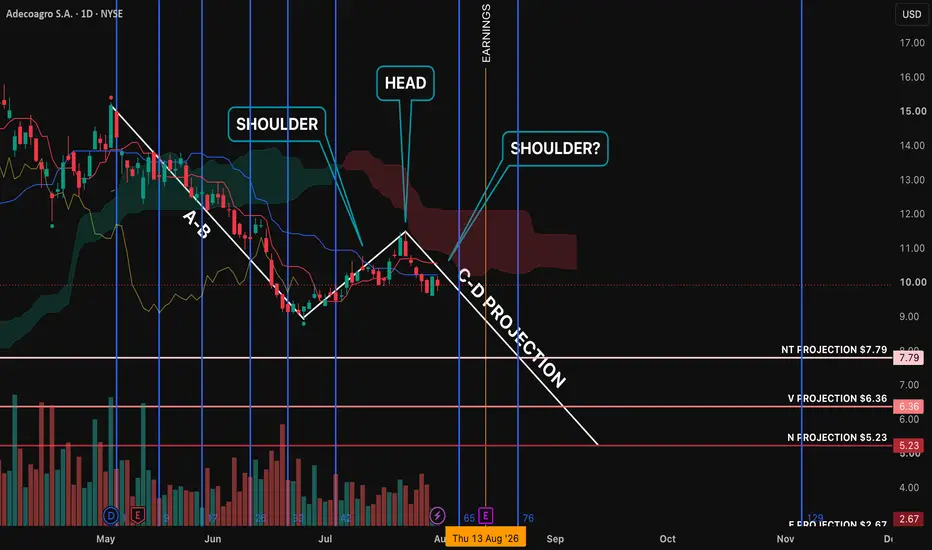
AGRO: Major N-Wave AnalysisThe fundamental unit of price progression in Ichimoku is the N wave. Due to the fractal nature of the market, you have N waves within N waves within N waves. On this chart, I have shown a major N wave in formation. You can see the minor N waves that have formed around the legs of the major wave. The assumption in Ichimoku is that the final leg of an N wave will form in symmetry and proportion relative to the A-B leg. Do all N waves reach their full potential? No. Like everything else inShortby troydowvanzandt0
IREN:Head & Shoulders Target Achieved — Whats Next?Trendline Rejection or the Start of a New Rally? As I posted previously (see attached) IREN has already completed one major bearish objective after the Head & Shoulders pattern played out almost perfectly. With that measured move now achieved, the stock has reached a technical crossroads. The long-term rising trendline that previously acted as support was eventually broken. As often happens in technical analysis, former support can become new resistance. Price is currently testing that very by ibraheeemz9
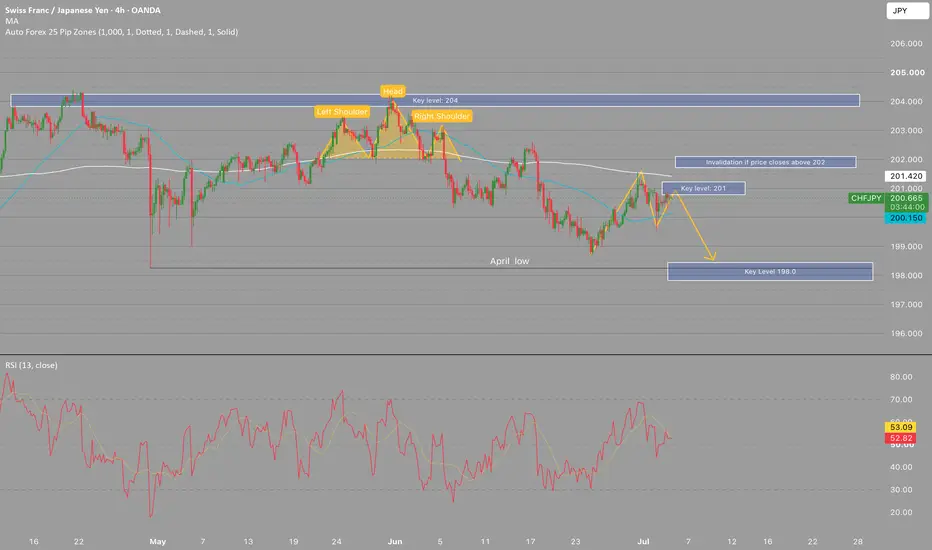
CHFJPY: Structure Favors Continuation Towards 198.00CHFJPY continues to present a bearish technical outlook following the completion of a Head and Shoulders reversal pattern beneath the 204.00 resistance zone, signalling a potential shift in market structure after an extended rally. Since confirming the neckline break, price has remained below the 200-period moving average, reinforcing the broader bearish trend. The current recovery appears corrective rather than impulsive, with the 201.00–202.00 region acting as a key resistance cluster where prShortby JCW-Fx21Updated 59
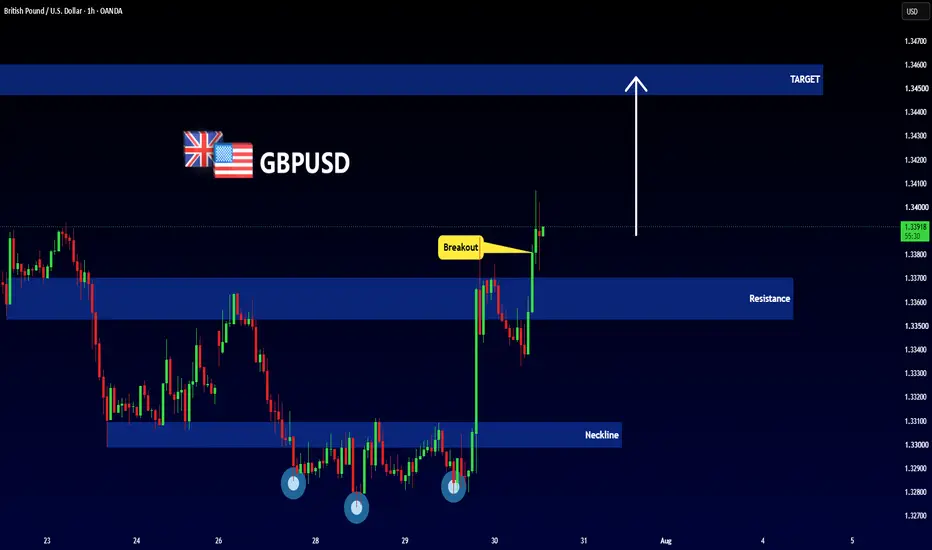
GBPUSD - Inverted Head & ShouldersHello, Traders! 👋 Previously, the GBPUSD price formed an Inverted Head & Shoulders pattern. The price has now successfully broken above the resistance zone (1.33528 – 1.33637). So, I expect another bullish move. 🎯 Target: 1.34475Longby Hsan_BenhmedUpdated 810
EURJPY | Liquidity Sweep Signals Potential Bearish ReversalEURJPY is currently approaching a significant technical inflection point after sweeping buy-side liquidity above the June high and retesting a historical resistance zone that has remained influential since January. Price is also developing a potential Head and Shoulders reversal pattern beneath this resistance, although the formation remains unconfirmed until further bearish price action develops. I will therefore be monitoring for a clear rejection from the highlighted resistance area before coShortby JCW-Fx21Updated 612
MESU July 30: Relief Bounce Before Another Selloff?MESU remains inside a bearish higher-time-frame structure, but an inside-bar formation may lead to short-term expansion. Acceptance above 7,392 could support a relief bounce toward 7,482, where multiple fair value gaps may attract price and create a potential reaction zone. I would still treat that move as a retracement unless MESU produces a confirmed 4-hour close above 7,524. That would shift my broader outlook from bearish to neutral. On the downside, a confirmed close below 7,351 could opLongby Zhuge1iang2
TTAN - Reverse Head and Shoulders above the 50 SMA💡 Swing setup idea Reverse head and shoulders 🔎 Analysis summary: The stock touched the 50 SMA and bounced, closing a reverse head and shoulders pattern. We can also see very strong buyers volume stepping in, but with the broad market still trending lower, this is one to manage with extra caution. 👀 Levels to watch: Entry trigger: Break above $84.10 Target: $111.36 Stop: Under the breakout level 💬 What do you think about this setup? Let me know in the comments! 👇 Good luck! ⚠️ NotLongby Kochva_2
$XAUUSD m15 bullish reversal ideaPrice has broken out of the Inverse H&S pattern and got rejected at m15 Supply zone. Looking for long entries at the confluence of the 0.618 - 0.786 Fibonacci levels and the m15 Demand area on a pullback. #NFA #DYOR Longby ruijin_trdUpdated 24
MESU July 29: 7500 or 7438 Before the Fed?MESU remains inside a choppy higher-time-frame range between approximately 7,524 and 7,411 ahead of today’s interest-rate decision at 2:00 PM Eastern Time. On the 4-hour chart, the main upside liquidity level is around 7,500. Price may push into that area before choosing its next direction. On the 1-hour chart, downside liquidity is visible around 7,438. Price could sweep that level first before rotating higher toward 7,500. The 15-minute chart supports the same two-sided scenario. Because prby Zhuge1iang0
AUDUSD: Bearish Confluence at April Highs, Targeting 0.7000AUDUSD is approaching a significant resistance confluence beneath the April Highs, where multiple technical factors suggest the potential for a bearish reversal. Price is currently forming the right shoulder of a Head & Shoulders pattern while simultaneously trading into a key liquidity pool above prior highs, creating the possibility of a buy-side liquidity sweep before lower prices. This area also coincides with the completion of an AB=CD harmonic structure, while the projected downside targetShortby JCW-Fx21Updated 46
SNDK:From "Buy the Dip?" to Confirmed Head & Shoulders Reversal?In my previous analysis, I pointed out that SNDK was beginning to lose its bullish structure, with the rising trendline breaking down, the Daily EMA20 turning into resistance, and bearish divergence warning that momentum was fading. Since then, the bearish story has become much clearer. SNDK has lost over 30% since then. What initially looked like a simple trendline breakdown has now developed into a textbook Head & Shoulders reversal, complete with a neckline breakdown and retest. The bullsShortby ibraheeemzUpdated 212
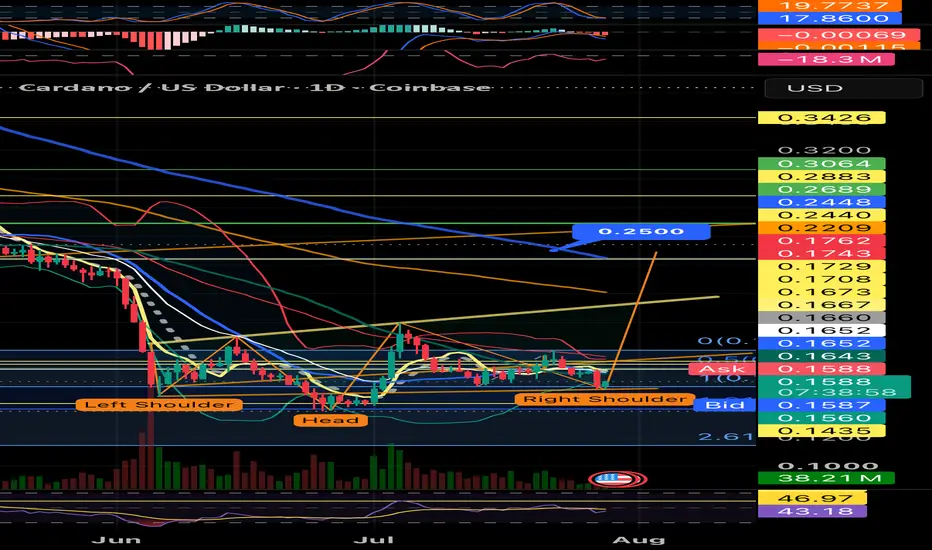
Trend reversal Inverse Head and Shoulders Elliot Wave 1?Could the bottom be in for ADA USD? It’s a high probability setup that needs confirmation by a daily close above the neckline of the Inverse Head and Shoulders. It coincides with an Elliot Wave 1 and ABC correction leading into wave 3. The RSI supports the price action. Longby BreakingGood13
BTCUSDT: Head & Shoulders Breakdown in FocusHi! Bitcoin has formed a Head & Shoulders pattern on the 4h chart, with the right shoulder completed after rejecting higher prices. The recent decline has also broken the ascending trendline, signaling weakening bullish momentum. Price is now testing the $62,900 support. A confirmed close below this level would validate the bearish setup and increase the probability of further downside. Bearish target: The measured move of the Head & Shoulders points toward the $61,400 support zone. If sellinShortby melikatrader94Updated 2967

 LongLong
 Short
Short

 Long
Long Short
Short Long
Long Short
Short Short
Short Long
Long Long
Long Long
Long Short
Short
 Short
Short LongShort
 Long
Long Long
Long LongShort
 Short
Short LongShort