The New Fed Chair Has Gold Scared!!Price on OANDA:XAUUSD had been trading in a Pennant pattern up until we had the Interest Rates set by the Federal Reserve today delivering not only 1 but 2 breakouts, lets break it down!
Even though the Federal Reserve had Held Interest Rates today, the announcement of future Rate Hikes on the table had severely weakened OANDA:XAUUSD resulting in a False Breakout of the Falling Resistance and delivering a Breakout of the Rising Support of the Pennant.
Remember, OANDA:XAUUSD is a non-yiel
Relative Strength Index (RSI)
RSI 1W - gambling or smart retest?Rush Street Interactive (RSI) just confirmed a breakout above the 15–16 zone with a textbook retest - a classic bullish setup. The weekly chart shows a clean “cup and handle” structure backed by rising volume. Current pullback is forming right inside the buy zone, suggesting potential continuation.
Fibonacci extensions highlight 30.7 and 43.9 as key upside targets. As long as price holds above 15.5–16.0, the bullish bias stays intact. A breakout above 18.0 would confirm the next leg higher.
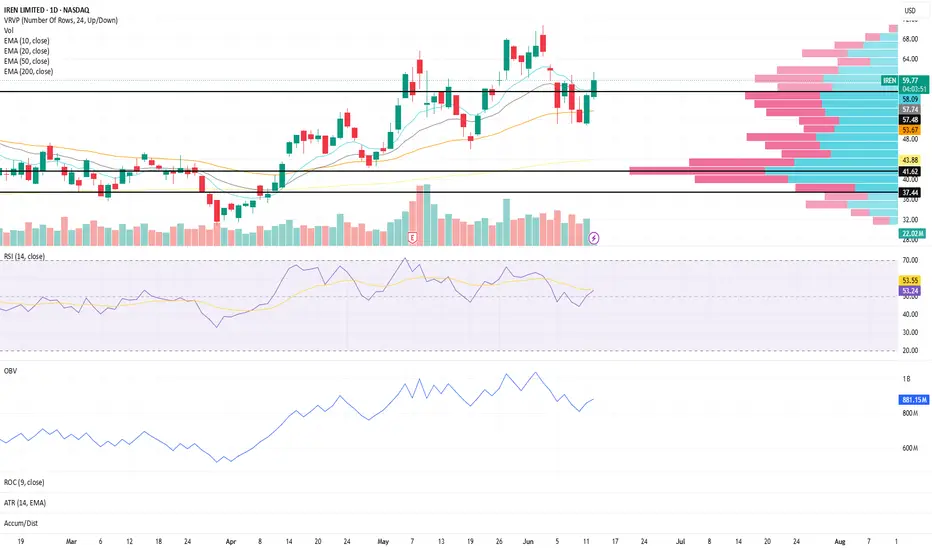
Momentum Above Value Area High | IREN Structure Update IREN continues to show constructive behavior on the daily timeframe as price trades above a key volume profile level.
Price is currently trading above the Value Area High (VAH), suggesting continued acceptance above the upper boundary of the primary value area
The Value Area Low (VAL) remains below current price and represents an area worth monitoring if momentum begins to weaken
The Point of Control (POC) sits below both levels and represents the price where the highest volume has historically
EA Bulls "Wedge" Price Higher, Now For A RetestPrice on OANDA:EURAUD was able to make a Breakout of the Falling Resistance of the Wedge pattern formed to end the week last week, and now we are potentially looking at a Retest!
Currently, price is trading just above the Falling Resistance but has space yet to move further down for a legitimate Retest around 1.6290.
- Volume has begun to increase as price started to reach the Higher High @ 1.63928
- RSI trading around 56
- MACD presenting Bullish indications
If price continues to fall and
SPY Structure Update (Daily Chart)SPY remains in a constructive trend environment despite today's pullback, with the broader moving average structure continuing to hold.
The 10, 20, 50, and 200 EMAs remain positively aligned
Price continues to trade above all major moving averages, keeping the larger trend structure intact
While short-term momentum has weakened, the overall trend remains constructive until key support areas begin to fail
Momentum conditions have cooled:
RSI is currently near 49, reflecting a notable loss of
Bitcoin's Final Shakeout Before the Bottom?Bitcoin isn't doing anything unusual.
In fact, it's doing what it has done before.
The setup 📊
When you overlay the current cycle with the previous one, the similarities become hard to ignore.
The sequence looks very familiar:
• Expansion phase
• Cycle peak
• Sharp decline
• Extended correction
Up to this point, Bitcoin has been tracking that roadmap surprisingly well.
Where are we now?
If we use the previous cycle as a reference, the final bottom didn't arrive immediately after th
SPY Structure Update (Daily Chart)SPY continues to maintain one of the most constructive trend structures on the chart, with price holding above all major moving averages.
The 10, 20, 50, and 200 EMAs are all trending higher
The EMA stack remains fully aligned, reflecting strong trend participation across multiple time horizons
Price continues to trade above key moving averages, keeping the broader structure intact
Momentum conditions remain supportive:
RSI is currently near 74, holding in the upper range while maintaining sl
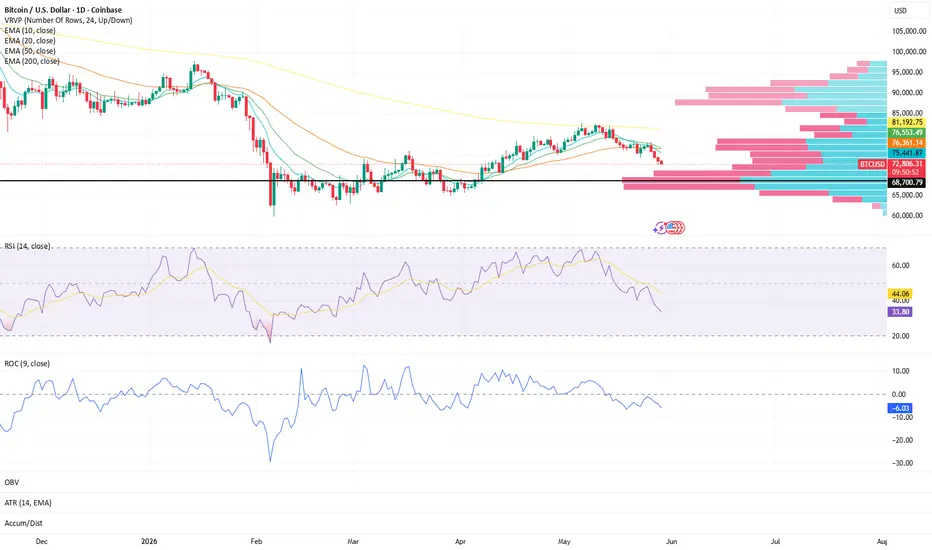
BTC Structure Update (Daily Chart)Bitcoin continues to face short-term pressure as momentum and trend alignment weaken.
The 10 EMA and 20 EMA have now crossed below the 50 EMA, signaling a deterioration in short-term trend structure
The 50 EMA remains overhead, acting as an important area to monitor for any recovery attempts
The 200 EMA continues to represent the broader trend reference point, remaining well above current price
Momentum conditions have also weakened:
RSI is currently near 34, reflecting continued sell
$GOLD 200DMA Retest / Death Cross / RSI / Fib *Buy Signals*GOLD appears to be in the final leg of its corrective phase as its once again retesting the 200DMA after being rejected from the 50DMA.
Historically when TVC:GOLD loses the 200DMA it corrects another 10-12%
This would put price ~$4k
We could very well see a retracement to the 50% Gann level ~$3,6 to fuel the correction for the next leg higher.
Note the RSI gives a buy signal when it touches <30 and it's not quite there yet.
50/200 DMA Death Cross should occur within the next few weeks s
SPY Structure Update (Daily Chart)SPY continues to maintain constructive structure as price holds above all major moving averages following the April recovery phase.
The 10 & 20 EMAs remain positively sloped, continuing to reflect sustained short-term momentum
The 50 EMA has continued turning higher, reinforcing intermediate trend support
The 200 EMA remains steadily upward sloping, keeping broader structure intact
Price is currently trading above the major volume concentration zone, showing continued acceptance away from prio
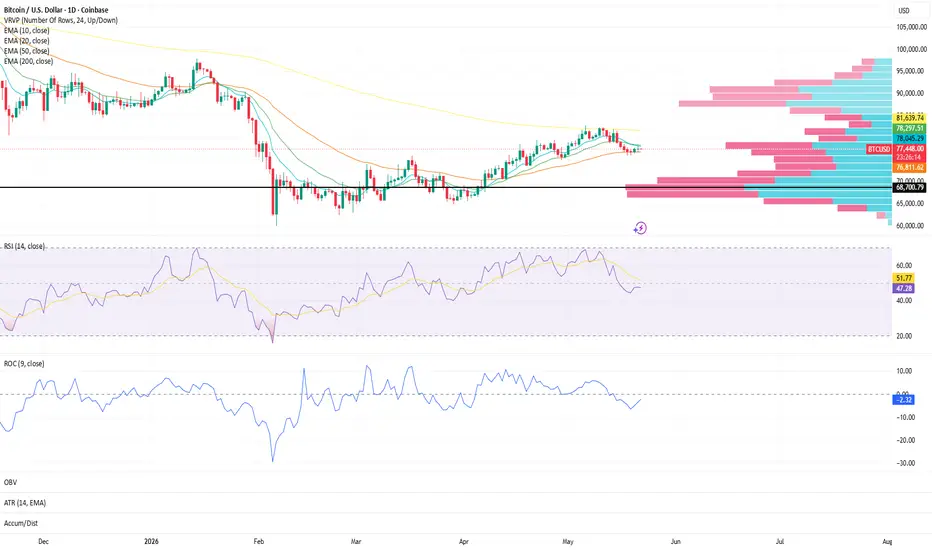
BTC Weekly Structure Update:(Daily chart)Bitcoin continues to trade in a structurally mixed environment as price compresses between key moving averages.
The 50 EMA is currently acting as support
The 10 & 20 EMAs are acting as near-term resistance, showing short-term pressure against price expansion
The 200 EMA remains above current price and continues to hold steady, keeping longer-term overhead structure intact
Momentum conditions continue to soften:
RSI (14) currently at 47.04
Both short-term RSI and long-term RSI continue trendin
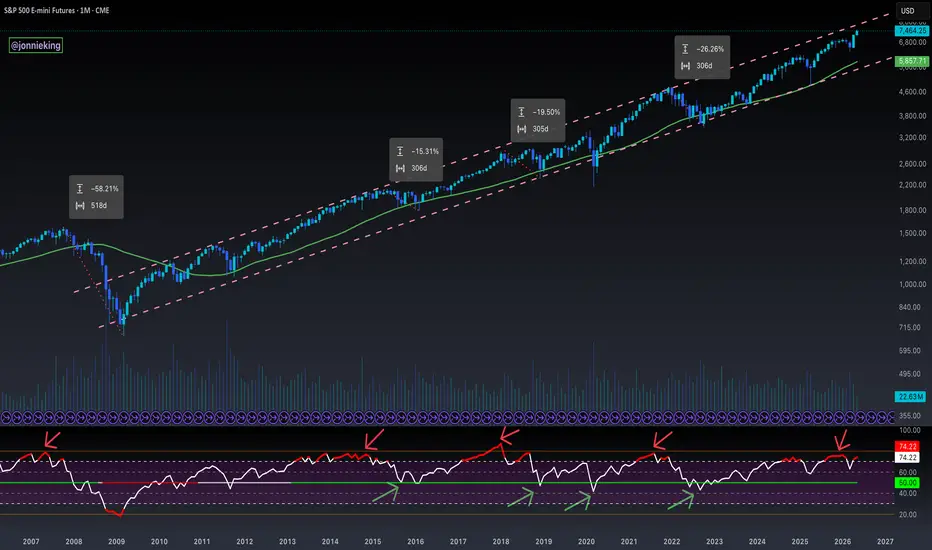
$SPX 18-year Parallel Channel RSI AnalysisThe S&P 500 has been trading in an 18-year parallel channel.
Every time the RSI trades >75 we see a significant market correction, where we are then presented with amazing buying opps when the RSI touches ~50 in confluence with the MMA34.
This time is different tho, right?
$XHB Homebuilders ETF Moment of Truth at 50WMATHE REAL ESTATE MARKET IS SHOWING MAJOR CRACKS 🚨
Golden Arches spotted on the Homebuilders ETF 🍔🍟
AMEX:XHB has lost the .382 Fib, and currently testing the 200WMA which has historically acted as very strong support.
Last time it broke we saw a 50% correction.
So far it's 25% down, so has a ways to go.
Could easily get back down to ~$60, or even a full retrace to ~$50.
Expect the price of homes to crate if this happens.
US10Y Massive Weekly Close Breakout - 5% Next !?THE US10Y IS THE BEACON OF TRUTH IN FINANCIAL MARKETS.
As predicted, the 10Y yield is back above 4.6% and have officially entered the danger zone.
The US Guvament has to refinance ~$9.8T of debt this year with the biggest intra-year cliffs in February and August.
I think we all remember what happened to CRYPTOCAP:BTC in February; don’t be surprised if we see the same in August.
If yields stay elevated for the next couple of Weekly Closes outside of this massive 6-year bull pennant, then I
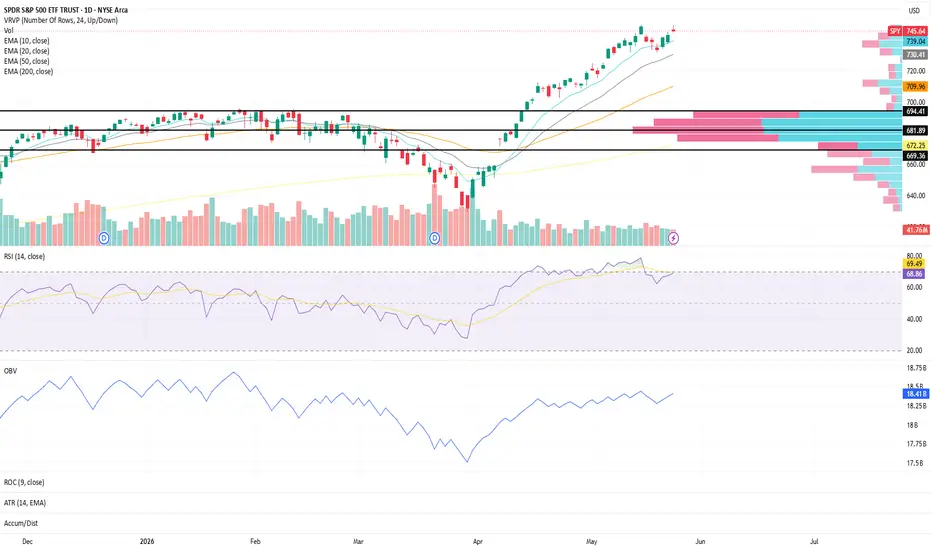
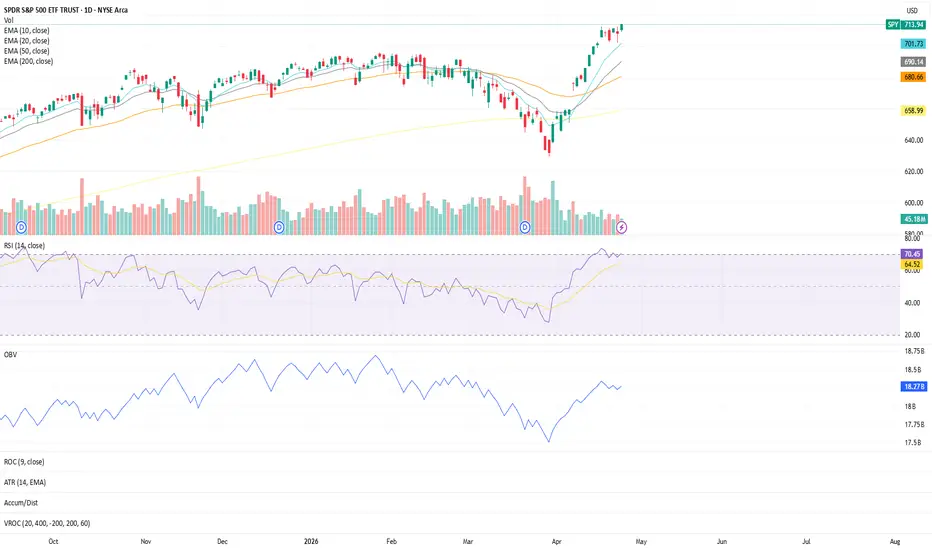
SPY Structure Update (Daily Chart)The 10, 20, and 50 EMAs remain in healthy alignment and continue showing constructive upward curvature. The 200 EMA remains below price and is also steadily trending upward, keeping the broader structure constructive across multiple layers.
RSI is currently holding around 68, showing continued participation while remaining in a strong momentum range.
OBV has maintained an upward trend since March 31st and is currently consolidating near recent highs — something I continue watching closely for
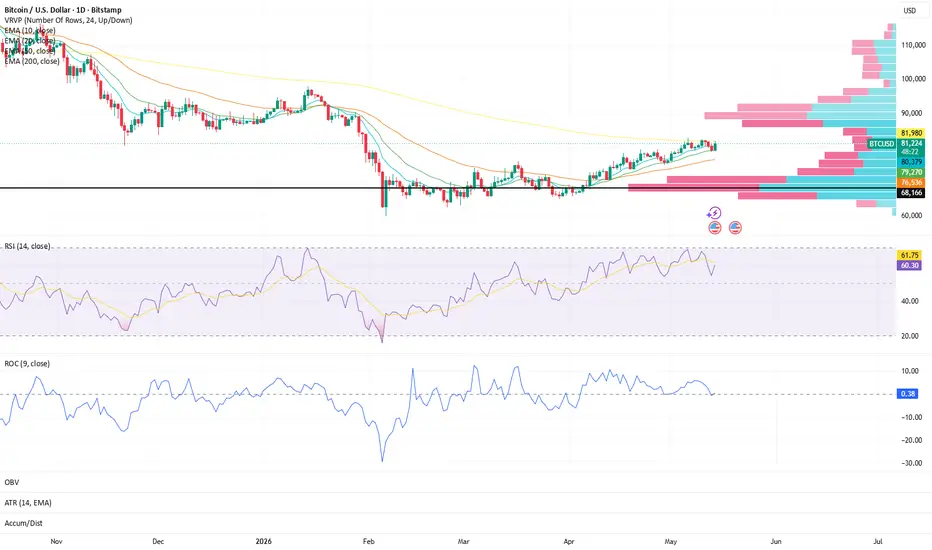
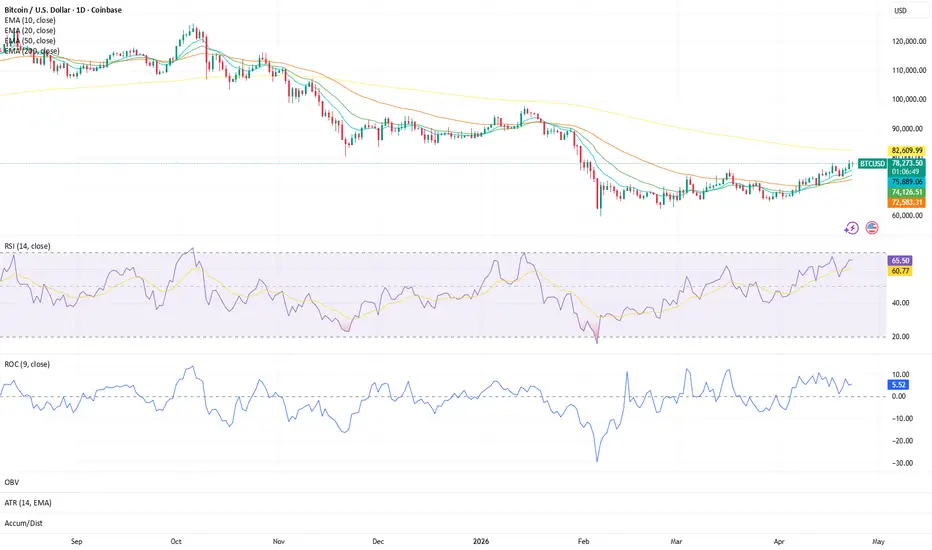
BTC Structure Update (Daily Chart)The 10, 20, and 50 EMAs remain in constructive alignment and are continuing to trend upward while approaching the 200 EMA — a level the market is now actively testing.
Historically, when shorter-term EMAs reclaim and cross above the 200 EMA, it can signal a major shift in longer-term structure, commonly referred to as a golden cross.
RSI (14) is holding steady near 60 while continuing to show constructive upward curvature, indicating participation remains healthy without reaching extreme condi
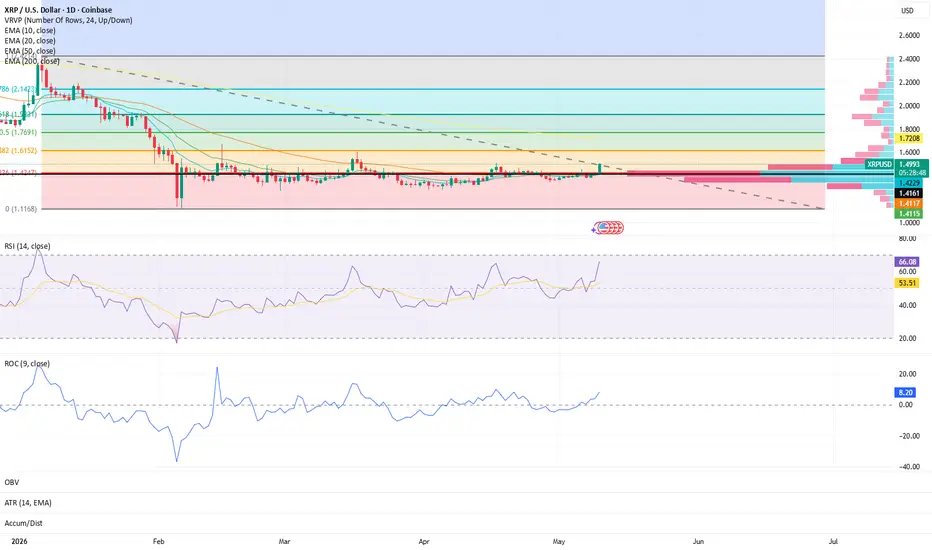
XRPUSD Structure Update — Daily ChartXRPUSD is beginning to show improving internal structure on the daily timeframe as momentum indicators continue to strengthen beneath the surface.
Price is attempting to stabilize after an extended compression phase, while RSI continues holding firmly near 66 — signaling sustained participation and constructive momentum rather than immediate exhaustion.
ROC is also turning higher, adding confirmation that momentum expansion may be starting to build alongside the recent price stabilization.
Th
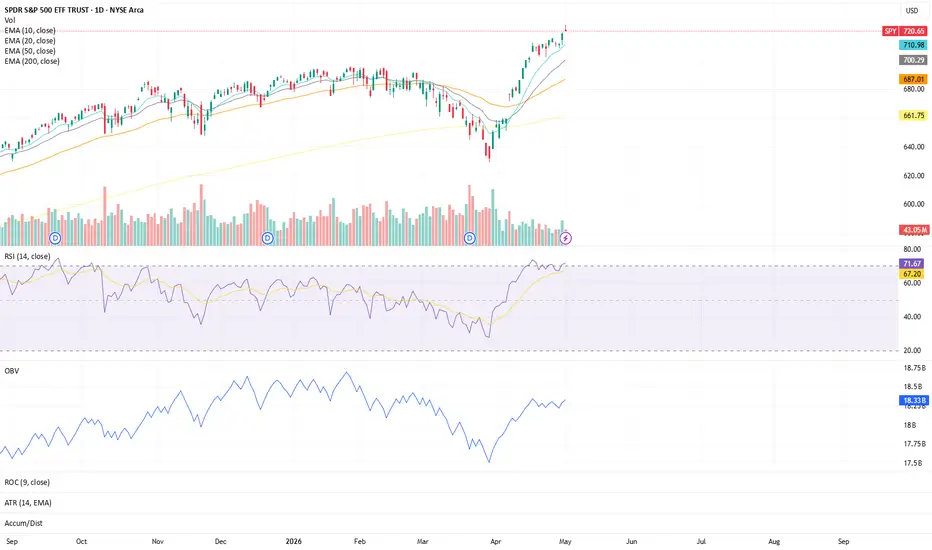
SPY Structure Update — DailyEMA stack remains in strong alignment, with the 10/20/50/200 all trending upward and showing clear curvature. Structure continues to reflect constructive momentum across all key moving averages.
Price is holding above the stack, reinforcing trend strength rather than extension failure at this stage.
RSI is steady at 71, signaling sustained participation without immediate signs of exhaustion, but still within a zone where continuation vs. cooling becomes important to monitor.
OBV has been tren
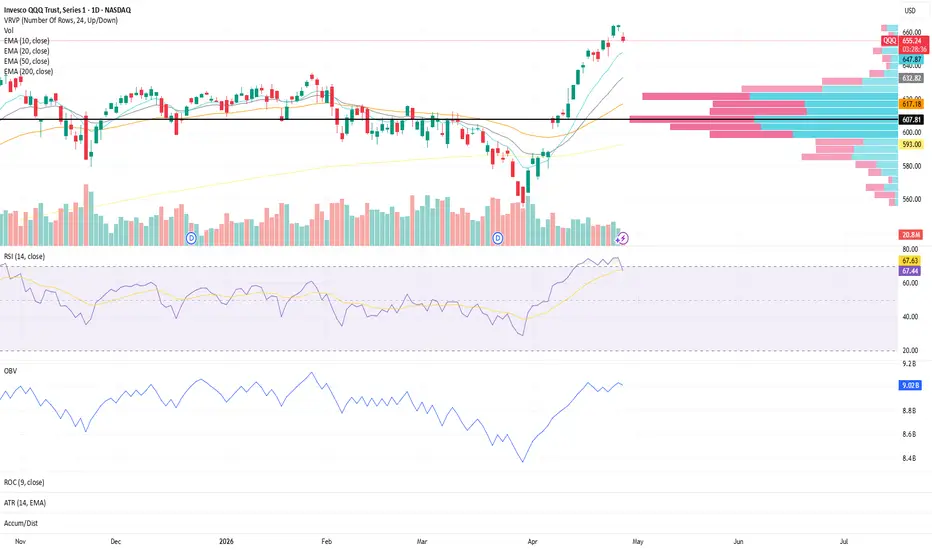
Observing Point Of ControlThe black line represents the Point of Control (POC) at 607.81 — the level where the highest volume has traded.
Notice how price consistently gravitates back toward this area. This reflects a zone where the market previously found the most agreement, making it a key reference point within the structure.
What stands out is that some of the strongest moves are developing directly from this level — not randomly, but from a zone of confirmed participation.
At the same time:
• RSI showed its stron
SPY Structure Update (Daily Chart)Price continues to respect short-term momentum structure as the trend rebuilds off the recent pullback.
The 10 & 20 EMAs are maintaining upward curvature, showing sustained short-term momentum
The 50 EMA has turned higher as well, though with a more gradual slope — indicating developing support rather than aggressive expansion
The 200 EMA continues its steady upward trajectory, keeping the broader structure intact
Since the March 30th pivot, both RSI and OBV have shown constructive behavior:
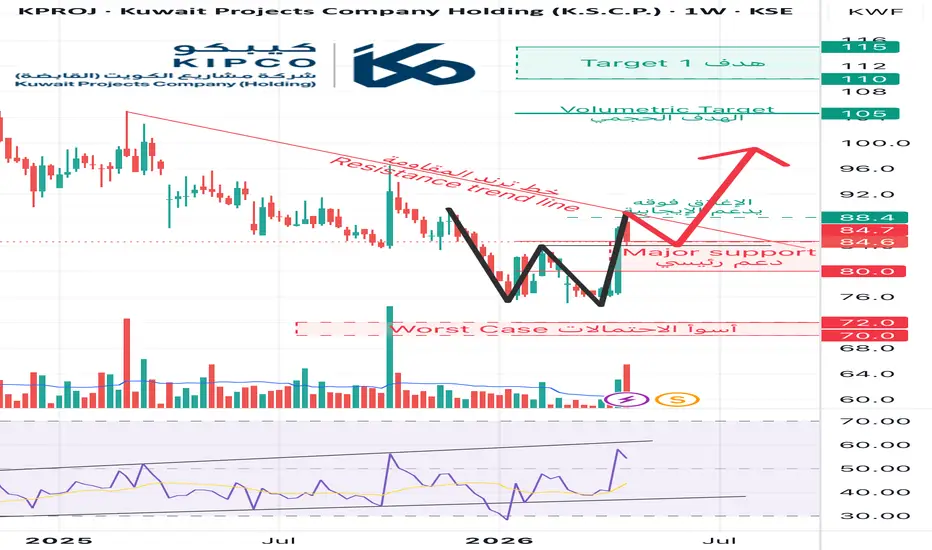
KPROJ criticality The weekly chart for KPROJ highlights a critical juncture for the stock. Price is consolidating near the 84–85 support zone, which has acted as a major pivot in recent sessions. The Relative Strength Index (RSI) has climbed above the 50 line, signaling a potential shift in momentum toward the bulls.
- A potential double-bottom (W pattern) is forming, with confirmation only if price closes above the 90–92 neckline.
- Major support sits at 82–84. Holding this level strengthens the bullish case, w
Bitcoin Structure Update | Daily TimeframeBitcoin continues to show signs of developing structure beneath the surface, even as price remains below the longer-term trend.
On the daily chart, the 10 and 20 EMAs remain positioned above the 50 EMA, indicating that short-term momentum is still intact and gradually building. This progression suggests early-stage structure attempting to push higher toward the 200 EMA, which remains the key macro barrier.
Momentum & Participation:
RSI (~65) is holding firm in bullish territory, reflecting