PRO Scalping Strategy EMA50 + RSI3 + ADX5Consiste en unir varios indicadores como rsi adx y ema50 para hacer scalping Chiến lượccủa jesusito21618
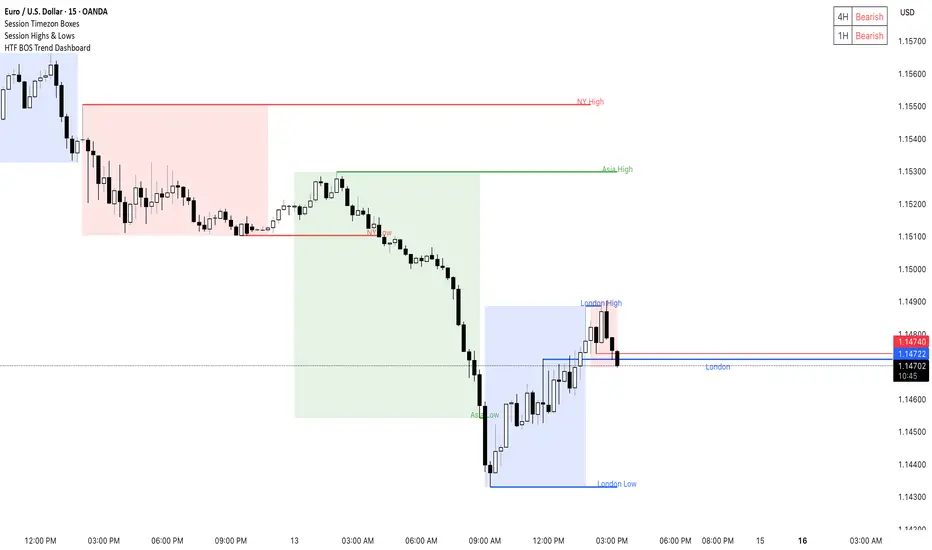
Trading Sessions Asia / London / New York ( benjamin.M)Trading Sessions Asia / London / New York This indicator was created to identify the best trading time windows. It helps analyze the moments of the day when the market is most active and when the best opportunities appear. With this tool, traders can better understand which hours offer the most favorable volatility and volume, allowing them to optimize their entries and improve their trading strategy. Chỉ báocủa benjamin_moreau1612019
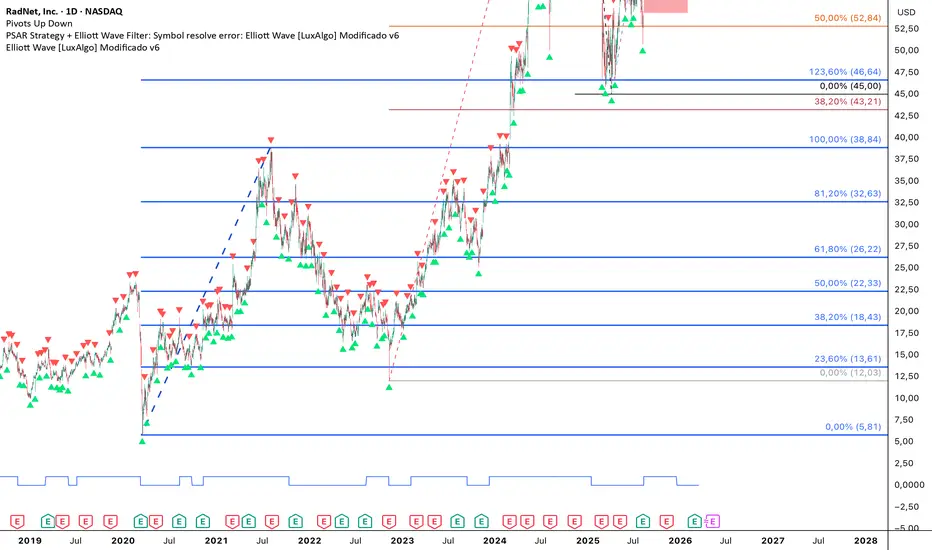
Elliott Wave [LuxAlgo] Modificado v6Script Modificado de Elliot solo es una prueba, no sé cómo funciona bien.Chỉ báocủa armando25077863
WLD 4H Auto Entry ConfirmedUT bot, MACD and EMA confirmation strategy. This a strategy for 4H timeframe, confimring when to go in a short/long and where to take TP/SL based on ATR levelsChiến lượccủa farshad_hamidi101136
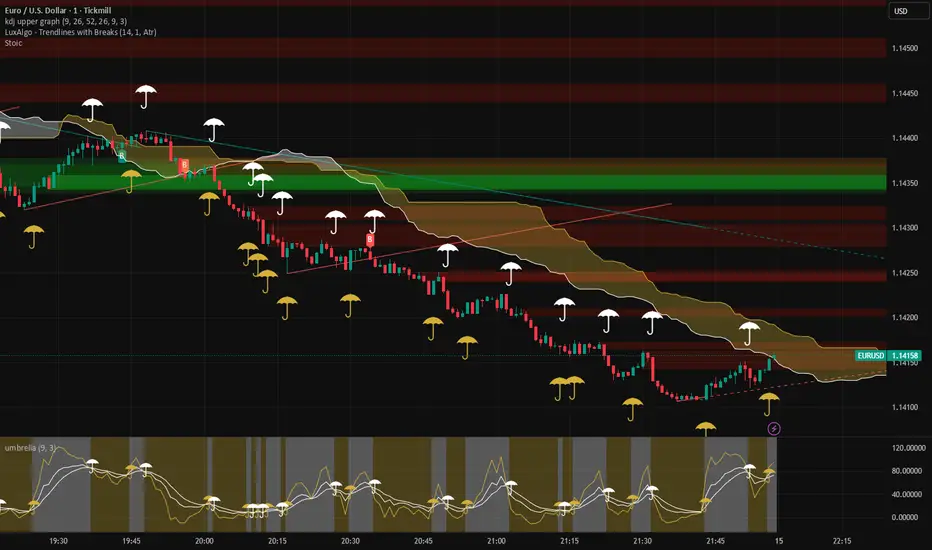
Stoic Master IndicatorStoic is an all-in-one Smart Money Concepts indicator that combines market structure tools with optional ICT Killzones and timezone-aware session boxes. It includes: Order Blocks Break of Structure Mitigated blocks Fair Value Gaps Opening Gaps Volume Imbalances Previous Daily / Weekly / Monthly Highs & Lows Equal Highs / Equal Lows Trend and retest candle highlights The built-in ICT module lets you plot: Asia London New York AM Lunch New York PM with selectable timezone support, making session visualization more accurate across different trading locations. Stoic is built for traders looking for clean chart confluence between structure, liquidity, imbalance, and session timing. For educational use only.Chỉ báocủa schanvnnom4
Stoic Master IndicatorStoic is an all-in-one Smart Money Concepts indicator that combines market structure tools with optional ICT Killzones and timezone-aware session boxes. It includes: Order Blocks Break of Structure Mitigated blocks Fair Value Gaps Opening Gaps Volume Imbalances Previous Daily / Weekly / Monthly Highs & Lows Equal Highs / Equal Lows Trend and retest candle highlights The built-in ICT module lets you plot: Asia London New York AM Lunch New York PM with selectable timezone support, making session visualization more accurate across different trading locations. Stoic is built for traders looking for clean chart confluence between structure, liquidity, imbalance, and session timing. For educational use only.Chỉ báocủa schanvnnom8
Stoic Master IndicatorStoic is an all-in-one Smart Money Concepts indicator that combines market structure tools with optional ICT Killzones and timezone-aware session boxes. It includes: Order Blocks Break of Structure Mitigated blocks Fair Value Gaps Opening Gaps Volume Imbalances Previous Daily / Weekly / Monthly Highs & Lows Equal Highs / Equal Lows Trend and retest candle highlights The built-in ICT module lets you plot: Asia London New York AM Lunch New York PM with selectable timezone support, making session visualization more accurate across different trading locations. Stoic is built for traders looking for clean chart confluence between structure, liquidity, imbalance, and session timing. For educational use only.Chỉ báocủa schanvnnom17
Simple Buy/Sell SignalsScriptz made by me. Buy and sell signal created with AI. Trial and error lets see how good it works.Chỉ báocủa JustWin8830
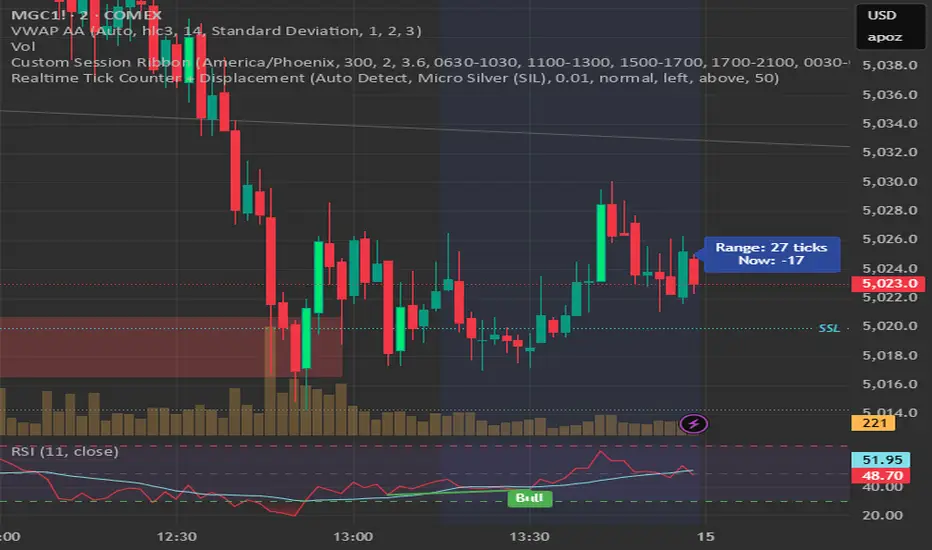
Realtime Tick Counter + DisplacementRealtime tick counter per bar Range of tick per bar Added Displacement candle highlighterChỉ báocủa supertokki5219
Yen Carry Trade Risk -10Y JGB vs 10Y US Treasury Yields + USDJPYBy plotting delta between 10Y JGB and 10Y UST along side the currency performance of Yen versus USD to determine the risk of Japan shorting overseas assets to bring back the Yen.Chỉ báocủa JeSuisBonheur7
30min ORB This code creates horizontal lines on your chart representing the first 30 minutes of trading (09:15 to 09:45). It captures the highest and lowest prices from that period and draws them as permanent levels for the rest of the day.Chỉ báocủa sudhakar_kb20
RegalRides Pro Indicator - Hourly ResetImportant note This version will: reset hourly, and also reset immediately after TP/SL. So it can generate multiple setups in the same dayChỉ báocủa trader_ramjiram26
lachy momentum botLachy FX Trend Bot Indicator based on the UT Bot concept, optimized with trend and momentum filters to reduce false signals. The system uses an ATR Trailing Stop combined with a 200 EMA and an ADX filter to generate BUY and SELL signals only when the market shows clear direction and sufficient momentum. Designed to keep the chart clean and help traders identify high-probability opportunities across indices, forex, and cryptocurrencies. Recommended settings: Key Value 1.8–2.0 | ATR 14 | EMA 200 | ADX > 20Chỉ báocủa Lachy_fx21
Session Highs & LowsThis indicator automatically identifies and plots the high and low levels of major market sessions directly on your chart. It helps traders easily visualize important liquidity zones and potential support or resistance levels formed during key trading hours. The indicator tracks the Asian, London, and New York sessions and marks their highs and lows once the session is completed. These levels often act as important areas where price may react, break out, or perform liquidity sweeps. The sessions are fully customizable, allowing you to adjust the session times and timezone so they match your broker or trading platform perfectly. Features: Automatically plots session highs and lows Includes Asian, London, and New York sessions Adjustable timezone settings Customizable session times Highlights key liquidity and breakout levels Clean and easy-to-read chart visualizationChỉ báocủa landermussely718
Trio vwapVWAP of all three indices tells it. You can avoid getting trapped. Green means it is above VWAP, and red means it is below VWAP.”Chỉ báocủa sudhakar_kb16
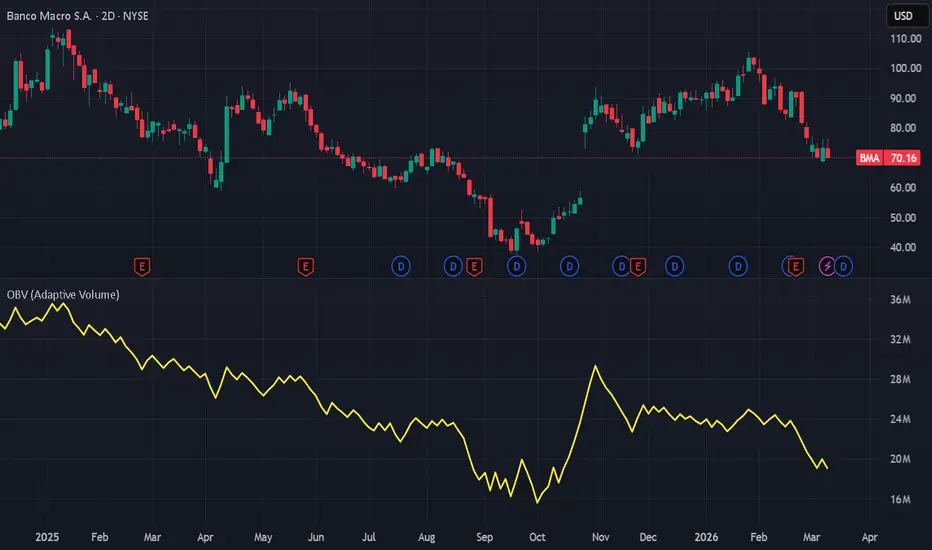
OBV Adaptive Volume [G IV]OBV Adaptive Volume This is the foundational Commitment component of the ET Massif Framework Research suite. Description G IV is an adaptive On-Balance Volume that caps extreme volume spikes and accepts any source as input, producing a clean and raw measure of accumulation and distribution pressure without the skew caused by abnormal volume events. Features Volume spike control – A configurable cap limits the impact of abnormal volume bursts, preventing volume spikes from overwhelming the cumulative total. By default, volume is capped at 2.5× the 180-period SMA of volume. Flexible input source – The indicator can be applied to any source, not just closing prices (HL2, OHLC4, or even other indicators). Raw participation focus – Designed to remain a direct measure of volume participation. Avoids the lag and noise common in heavily smoothed or oscillator-based OBV variants. Volume Spikes Matter Traditional volume indicators can be distorted when unusually large volume spikes occur. These spikes may reflect temporary liquidity events, news reactions, or block trades, which can heavily skew the OBV line and obscure the broader participation trend. Beyond a certain level of volume per bar, additional volume often represents churn rather than direction. How to Use Same as standard OBV: Rising values = accumulation; Falling values = distribution Confirmation Layer Apply the OBV transformation of any source to create a volume confirmation layer for other analytical tools (e.g. standard or custom indicators). Optionally, run a visual or z-score comparison between this output and the original source to identify divergences. In the above example, the OBV transformation is applied to TRIX (Triple Exponential Average) and shown alongside the original. Default Settings Source: Close Volume Cap: 2.5 Volume Lookback: 180 Volume cap and lookback can be adjusted depending on the instrument and market conditions. 日本語概要 (Japanese Summary) G IVは、極端な出来高スパイクを上限設定(180日SMAの2.5倍)で制御し、任意のソースを入力可能な適応型OBVです。価格だけでなくEMA等の各種指標にも出来高を反映した累積計算を適用でき、異常値による歪みを排除したクリーンな蓄積(Accumulation)と分配(Distribution)の傾向を、ラグを抑えた市場参加データとして視覚化します。 中文概要 (Chinese Summary) G IV 是一款自適應 OBV 指標,具備成交量上限機制(預設 180 週期 SMA 的 2.5 倍)以防止極端數值干擾,並支援自定義輸入來源。它能將成交量加權應用於價格或 EMA 等各類技術指標,有效排除異常波動帶來的偏誤,提供最原始且無滯後的市場吸納(Accumulation)與派發(Distribution)壓力數據。 Disclaimer This script is intended for research and educational purposes only. It does not constitute financial advice. Trading involves risk. Chỉ báocủa et20tradeview16
Yash_sapkal_MACDHist Alert (Correct Colors)This indicator recreates the popular MACDHist_Alert indicator from MetaTrader 4 and brings the same logic and visual behavior to TradingView. Unlike the standard MACD indicator available on TradingView, this version plots the MACD value itself as the histogram, which makes momentum shifts easier to identify. The signal line is calculated using an SMA smoothing, matching the behavior of the original MT4 indicator. The indicator also uses four momentum-based histogram colors to visually represent the strength and direction of the trend.Chỉ báocủa yash_19931161
Carry Trade Delta between 10Y JGB and 10Y USTCarry Trade Delta between 10Y JGB and 10Y UST... Attempting to gather the risk of unwinding of assets held using the JGB carry tradeChỉ báocủa JeSuisBonheur5
Crypto Breadth % Above 200DMAThis Pine Script indicator measures crypto market breadth by calculating the percentage of selected cryptocurrencies trading above their 200-day moving average (200DMA). It tracks 10 major coins (BTC, ETH, BNB, SOL, XRP, ADA, DOGE, DOT, LINK, LTC), checks whether each coin’s price is above its 200-day SMA, and then computes the percentage of those coins that are in an uptrend. The result is plotted as a breadth indicator (0–100%): Above 70% → strong market breadth (many coins in uptrend) Below 40% → weak breadth (few coins in uptrend) Traders use it to gauge overall crypto market strength rather than a single coin’s performance.Chỉ báocủa andrej87kolar2
RegalRides Pro IndicatorThe new part is this panel: appears at bottom left updates automatically after signal shows entry, stop loss, target also shows whether trade is active, target hit, or SL hitChỉ báocủa trader_ramjiram46
J.E. TradingJ.E. Trading is a market session and liquidity level indicator designed for intraday traders who focus on institutional trading concepts. The indicator automatically displays important price levels used in professional trading analysis, helping traders quickly identify liquidity areas and key market reactions. Features included in this script: • Asian session range (High and Low) displayed as a box • Weekly High and Weekly Low levels • Previous Day High (PDH) and Previous Day Low (PDL) • Daily Open price level • Clean visualization of important market levels • Customizable colors and visibility settings This tool helps traders understand how price reacts around major liquidity zones and session ranges, which are often used in ICT-style or liquidity-based trading strategies. The indicator works on any market including indices, forex, crypto, and futures, and is optimized for intraday timeframes. It is designed to keep the chart clean while highlighting the most important institutional levels that traders monitor during the trading day. Chỉ báocủa jipcrypto20205
Ema with Squeeze ColorThis indicator transforms a standard Exponential Moving Average (EMA) into a dynamic, multi-dimensional trend line. Instead of just showing average price, the line's color acts as a heat map for two critical market forces: Volatility Compression (the "Radar") and Normalized Momentum (the "Engine"). By combining these elements directly into the EMA structure, traders can visually identify whether the current trend is accelerating, chopping, or coiling up for a massive breakout, all without taking their eyes off the price action. ► Underlying Logic & Calculations This script does not rely on standard overbought/oversold logic. The color engine is driven by three distinct mathematical layers: The Baseline Structure: The foundation is a standard EMA (default 20-period), which tracks the immediate trend direction. The "Engine" (Normalized Momentum): The script measures raw momentum (ta.mom) and normalizes it against a 20-period standard deviation (volatility). This outputs a 0 to 100% "Engine Power" score, representing how aggressive the current momentum is relative to recent market volatility. The "Radar" (Pressure Squeeze Index): To detect consolidations and impending breakouts, the script calculates dynamic upper and lower recursive envelopes using a customizable convergence factor. It takes the logarithmic difference between these envelopes and calculates its linear correlation against the bar index to generate a 0 to 100 Pressure Squeeze Index (PSI). ► The Color Matrix & Priority System The indicator assigns colors based on a strict priority system to filter out noise: Priority 1 (The Radar Squeeze): If the Squeeze Index exceeds the high threshold (default 70%), the line turns Yellow. This overrides all momentum calculations, warning the trader that volatility is heavily compressed and a breakout is imminent. Priority 2 & 3 (The Engine Power): If the market is not squeezing, the script checks the direction of the momentum (Bullish vs. Bearish) and assigns a color gradient based on the Engine score: Strong Explosion (Neon Cyan / Laser Red): Normalized momentum is above 80%. Aggressive trend continuation. Standard Trend (Green / Pink): Normalized momentum is above 40%. Healthy trend. Weak / Chop (Lime / Orange to Teal / Light Orange): Normalized momentum is extremely low. The market is exhausted or drifting. ► How to Use It The Squeeze Play: Look for the EMA to turn Yellow during periods of tight consolidation. Wait for the color to violently shift into a "Strong Explosion" color (Neon Cyan for longs, Laser Red for shorts) to trade the breakout. Trend Management: Stay in winning trades while the line remains in the strong or medium trend colors. Consider taking profits or trailing stops tightly once the line fades into the "Weak" or "Chop" colors, indicating the momentum engine is running out of gas.Chỉ báocủa DarwinIsidro7
5m/15m ORB Boxes, Colors & 4-Layer StarTitle: 5m/15m Opening Range Breakout (ORB) with Confirmation Logic Description: This indicator is designed to visualize and trade the classic Opening Range Breakout (ORB) strategy, specifically optimized for high-volatility morning sessions on indices and equities. Instead of relying on a single timeframe, this script dynamically plots both the initial 5-minute reaction and the more established 15-minute range, allowing traders to monitor early momentum while filtering out immediate opening bell fakeouts. Core Features & Visuals: Dual-Range Boxing: The script automatically detects the 09:30 AM EST New York open and draws two distinct ranges: a 5-minute initial balance box (default yellow) and a 15-minute established range box (default orange). The candle colors are overridden during these formation periods for immediate visual clarity. Forward-Projecting Levels: Once the 15-minute Opening Range is set, clean extension lines project the high and low of that range into the future session. This provides strict visual boundaries for breakout entries and stop-loss placements without cluttering historical price action. 1-Candle Confirmation Trigger: High-volatility assets frequently sweep the opening range highs or lows to grab liquidity before reversing. To combat this, this indicator uses a strict 1-candle confirmation rule. The breakout logic requires the initial candle to close outside the 15-minute range, and it requires the very next consecutive candle to also close outside the range. This ensures the breakout is holding before a signal is generated. Custom Multi-Layer Signal: When the confirmation logic is met, the script plots a highly visible, 4-layer overlapping star signal at the exact breakout point. How to Use: Traders can use the 15-minute extension lines as a strict "Go/No-Go" filter for the morning session. A bullish bias is adopted only when price holds above the top extension line, and a bearish bias when price holds below the bottom extension line. The multi-layer star signal serves as the mechanical entry trigger once price action has proven it can sustain the breakout. Settings: Users can fully customize the colors of the 5-minute box, the 15-minute box, and the extension lines to fit their specific chart themes.Chỉ báocủa DarwinIsidro17