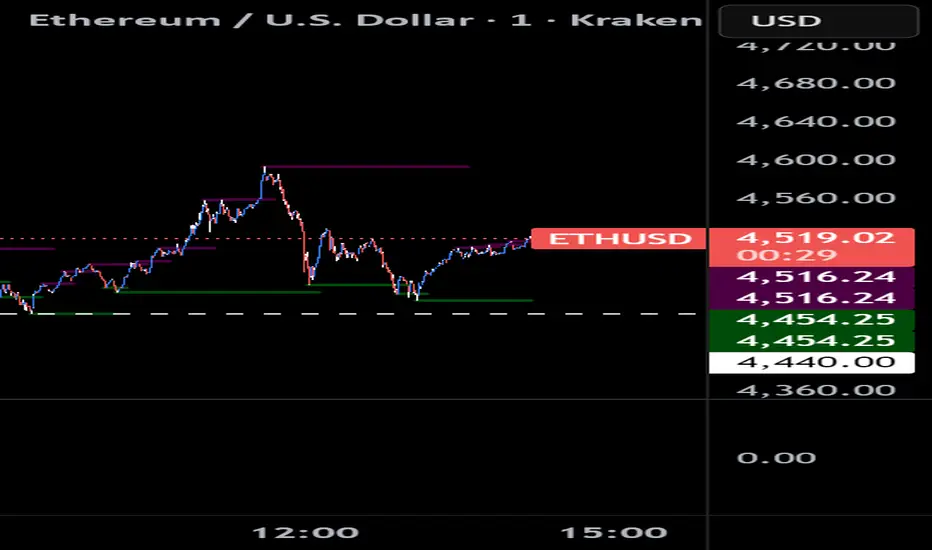
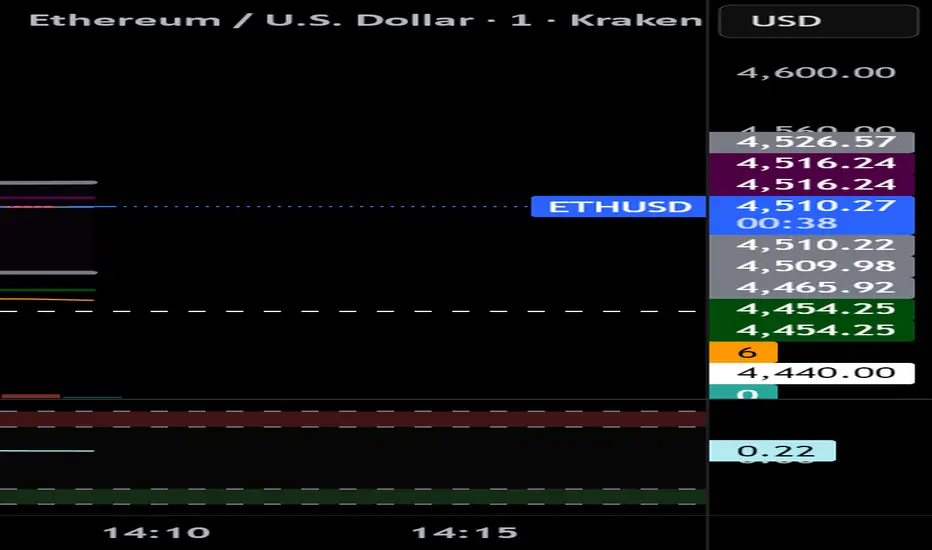
TCL - Extreme S/R Auto Levels (Pivot-Snapped, Snapshot) It is a fan-made indicator for TCL strategy to declare extreme s/r levels.Chỉ báocủa Kamil314Cập nhật 167
Ultra Clean Support / Resistance LevelsThis provides an Ultra Clean look for Support and Resistance levelsChỉ báocủa Stocktitian78
Ultra Clean Support / Resistance LevelsThis Provides a very clean Support and Resistance level on any timeframeChỉ báocủa Stocktitian35
Regular Trading Hours Opening Range Gap (RTH ORG)### Regular Trading Hours (RTH) Gap Indicator with Quartile Levels **Overview** Discover overnight gaps in index futures like ES, YM, and NQ, or stocks like SPY, with this enhanced Pine Script v6 indicator. It visualizes the critical gap between the previous RTH close (4:15 PM ET for futures, 4:00 PM for SPY) and the next RTH open (9:30 AM ET), helping traders spot potential price sensitivity formed during after-hours trading. **Key Features** - **Standard Gap Boxes**: Semi-transparent boxes highlight the gap range, with optional text labels showing day-of-week and "RTH" identifier. - **Midpoint Line**: A customizable dashed line at the 50% level, with price labels for quick reference. - **New: Quartile Lines (25% & 75%)**: Dotted lines (default width 1) mark the quarter and three-quarter points within the gap, ideal for finer intraday analysis. Toggle on/off, adjust style/color/width, and add labels. - **High-Low Gap Variant**: Optional boxes and midlines for gaps between the prior close's high/low and the open's high/low—perfect for wick-based overlaps on lower timeframes (5-min or below recommended). - **RTH Close Lines**: Extend previous close levels with dotted lines and price tags. - **Customization Galore**: Extend elements right, limit historical displays (default: 3 gaps), no-plot sessions (e.g., avoid weekends), and time offsets for non-US indices. **How to Use** Apply to 15-min or lower charts for best results. Toggle "extend right" for ongoing levels. SPY auto-adjusts for its 4 PM close. Tested on major indices—enhance your gap trading strategy today! Questions? Drop a comment. Thanks to twingall for supplying the original code. Thanks to The Inner Circle Trader (ICT) for the logical and systematic application.Chỉ báocủa MadMonkTradingCập nhật 66147
Smart Money Concept v1Smart Money Concept Indicator – Visual Interpretation Guide What Happens When Liquidity Lines Are Broken 🟩 Green Line Broken (Buy-Side Liquidity Pool Swept) - Indicates price has dipped below a previous swing low where sell stops are likely placed. - Market Makers may be triggering these stops to accumulate long positions. - Often followed by a bullish reversal. - Trader Actions: • Look for a bullish candle close after the sweep. • Confirm with nearby Bullish Order Block or Fair Value Gap. • Consider entering a Buy trade (SLH entry). - If price continues falling: Indicates trend continuation and invalidation of the buy-side liquidity zone. 🟥 Red Line Broken (Sell-Side Liquidity Pool Swept) - Indicates price has moved above a previous swing high where buy stops are likely placed. - Market Makers may be triggering these stops to accumulate short positions. - Often followed by a bearish reversal. - Trader Actions: • Look for a bearish candle close after the sweep. • Confirm with nearby Bearish Order Block or Fair Value Gap. • Consider entering a Sell trade (SLH entry). - If price continues rising: Indicates trend continuation and invalidation of the sell-side liquidity zone. Chart-Based Interpretation of Green Line Breaks In the provided DOGE/USD 15-minute chart image: - Green lines represent buy-side liquidity zones. - If these lines are broken: • It may be a stop hunt before a bullish continuation. • Or a false Break of Structure (BOS) leading to deeper retracement. - Confirmation is needed from candle structure and nearby OB/FVG zones. Is the Pink Zone a Valid Bullish Order Block? To validate the pink zone as a Bullish OB: - It should be formed by a strong down-close candle followed by a bullish move. - Price should have rallied from this zone previously. - If price is now retesting it and showing bullish reaction, it confirms validity. - If formed during low volume or price never rallied from it, it may not be valid. Smart Money Concept - Liquidity Line Breaks Explained This document explains how traders should interpret the breaking of green (buy-side) and red (sell-side) liquidity lines when using the Smart Money Concept indicator. These lines represent key liquidity pools where stop orders are likely placed. 🟩 Green Line Broken (Buy-Side Liquidity Pool Swept) When the green line is broken, it indicates: • - Price has dipped below a previous swing low where sell stops were likely placed. • - Market Makers have triggered those stops to accumulate long positions. • - This is often followed by a bullish reversal. Trader Actions: • - Look for a bullish candle close after the sweep. • - Confirm with a nearby Bullish Order Block or Fair Value Gap. • - Consider entering a Buy trade (SLH entry). 🟥 Red Line Broken (Sell-Side Liquidity Pool Swept) When the red line is broken, it indicates: • - Price has moved above a previous swing high where buy stops were likely placed. • - Market Makers have triggered those stops to accumulate short positions. • - This is often followed by a bearish reversal. Trader Actions: • - Look for a bearish candle close after the sweep. • - Confirm with a nearby Bearish Order Block or Fair Value Gap. • - Consider entering a Sell trade (SLH entry). 📌 Additional Notes • - If price continues beyond the liquidity line without reversal, it may indicate a trend continuation rather than a stop hunt. • - Always confirm with Higher Time Frame bias, Institutional Order Flow, and price reaction at the zone. Chỉ báocủa FXMAFIA2033117
HUNT_line [Dr.Forexy]HUNT_line Indicator 📊 **Category:** Price Action & Market Structure ⏰ **Recommended Timeframe:** 5-minute and higher 🎯 **Purpose:** Advanced market structure visualization for professional traders ⸻ ⚡ **Key Features:** • Break of Structure (BOS) and Change of Character (CHOCH) detection • Internal & Swing Market Structure analysis • Order Blocks identification with smart filtering • Fair Value Gaps (FVG) visualization • Premium/Discount Zones • Multi-timeframe support • Real-time structure alerts ⸻ 🛠 **How to Use:** 1. Apply on 5M or higher timeframes for best results 2. Monitor BOS/CHOCH for trend direction changes 3. Use Order Blocks as potential support/resistance areas 4. Watch for FVG fills as price inefficiency zones 5. Combine multiple confluences for higher probability setups ⸻ ⚠️ **Risk Disclaimer:** This indicator is for educational purposes only. Not financial advice. Always conduct your own research. ⸻ 🔹 **Credits:** Inspired by LuxAlgo's "Smart Money Concepts" with custom improvementsChỉ báocủa drforexy1134
MK_OSFT-Momentum Confluence DetectorMOMENTUM CONFLUENCE DETECTOR - Trading Indicator Overview What This Indicator Does The Momentum Confluence Detector is a comprehensive Pine Script indicator designed to identify high-probability trading opportunities by detecting momentum bars that align with multiple confluence factors. It combines traditional technical analysis with advanced Smart Money Concepts to filter out noise and highlight the most significant price movements. CORE FUNCTIONALITY 📊 Momentum Bar Detection Identifies unusual volume and bar size expansion using customizable multipliers Detects bullish, bearish, and neutral momentum bars based on OHLC relationships Uses moving averages to establish baseline volume and bar size thresholds 🔄 Multi-Filter Confluence System The indicator employs up to 5 different filter types to validate momentum signals: Level Concept Filter - Choose between: - Support/Resistance Levels : Traditional pivot-based S/R zones with touch counting and break tracking - Smart Money Concepts : Institutional order flow analysis including Order Blocks, Fair Value Gaps (FVGs), and market structure breaks Trend Filter : EMA/SMA-based trend direction confirmation with alignment requirements Breakout Filter : Detects price breakouts beyond recent highs/lows with percentage thresholds Volatility Filter : ATR expansion confirmation to ensure signals occur during active market conditions Market Session Filter : Filters signals to specific trading sessions (Tokyo, London, New York) ADVANCED FEATURES 🎯 Smart Money Concepts Integration Order Blocks : Identifies institutional supply/demand zones from major and minor structure breaks Fair Value Gaps (FVGs) : Detects price imbalances and tracks their evolution through partial fills and inversions Market Structure : Recognizes Break of Structure (BOS) and Change of Character (CHoCH) patterns Retracement Patterns : Tracks HLH (Higher-Low-Higher) and LHL (Lower-High-Lower) institutional patterns 📈 Support/Resistance System Multi-timeframe pivot detection (3, 5, 7-bar spans) Volume-weighted strength calculation for level importance Dynamic level merging and break tracking Automatic level type classification (Support/Resistance/Flip zones) ⚙️ Intelligent Filtering Logic ALL Mode : Requires all enabled filters to pass (high precision) ANY Mode : Requires at least one filter to pass (higher frequency) Real-time filter status tracking and visualization Visual Features Signal Markers : Clear triangular markers for qualified momentum bars Unfiltered Signals : Optional display of raw momentum bars for comparison Level Visualization : Dynamic S/R level boxes and lines with strength indicators Structure Lines : BOS/CHoCH break visualization with major/minor classification Fair Value Gaps : Color-coded boxes showing bullish/bearish FVGs with partial fill tracking and IFVG conversion Order Blocks : Institutional supply/demand zones displayed as colored boxes with major/minor classification Information Table : Real-time display of signal details and filter status Session Boxes : Visual representation of active trading sessions Practical Applications ✅ Swing Trading : Identify high-probability reversal and continuation setups ✅ Day Trading : Spot intraday momentum shifts with institutional backing ✅ Multi-Timeframe Analysis : Combine major and minor structure analysis ✅ Risk Management : Filter out low-quality setups using confluence requirements ✅ Educational : Understand market structure and institutional order flow Customization Options Adjustable momentum thresholds for different market conditions Comprehensive filter settings with individual enable/disable controls Visual customization for colors, sizes, and display preferences Alert system with detailed signal information Performance optimization settings for different chart timeframes Who Should Use This Indicator This indicator is suitable for traders who: Want to combine multiple technical analysis approaches Seek to understand institutional market behavior Prefer confluence-based trading setups Need customizable filtering for different market conditions Value comprehensive signal validation over high-frequency alerts The Momentum Confluence Detector transforms complex market analysis into clear, actionable signals by requiring multiple forms of confirmation before highlighting trading opportunities. Chỉ báocủa MK_OSF_TRADINGCập nhật 1313 1.5 K
Custom Period High LowSummary I'm moving over from TradeStation and default Pre-Market Session there is 0800-0930. Default PMS on TradingView is 0400-0930. I find that the 0800-0930 High and Low are more accurate levels. This script addresses exactly that - it allows you to grab High and Low of any custom time slot. This script started as Custom Pre-Market H/L, that's why the shading. Then I realized it can be used for any custom time period, so I renamed it to PERIOD H/L. Limitations Different tickers are provided by different exchanges, in different time zones. The end result is that the SAME session time (0800-0930) may shift for different tickers. Examples: - SPY : 0800-0930 // no shift: NYSE, in NYC - ES1!: 0900-1030 // shifted 1 hr ahead: CME, in Chicago - NQ1!: 0900-1030 // shifted 1 hr ahead: CME, in Chicago To see for yourself, set Time Zone config parameter to empty string for non-NYC tickers like ES1! or NQ1 and watch times for shaded and non-shaded areas. Why TV chooses to go by the ticker's TZ, and not the TZ that's configured in the lower right corner of my TV screen - I have no idea. But asking for user's TZ is how you fix it. If you know how I can get that value so I don't have to ask the user - let me know. I'm new to TV. Hacks You can use it more than once for, say, Opening Range Breakout. Configure your custom PMS for 0930-0945, change lines, remove area fill - and ta-da - you have High and Low for first 15 min! See release chart for the example.Chỉ báocủa hash102435
Dynamic Support ResistanceDynamic Support Resistance By Harpreet Daulatpuria. Marking Support and Resistance for every time frame automatically.Chỉ báocủa Daulatpuria11158
Swing High/Low MarkerThis indicator allows you to find the swing highs and lows of the chart and offsets it by the ATR and a custom factor to give you concrete breakout and stop loss prices.Chỉ báocủa meterpaffayCập nhật 148
🎯 Auto Support & Resistance Detectortesting automatic support and resistance detectionChỉ báocủa bpachter11234
Contrarian Period High & LowContrarian Period High & Low This indicator pairs nicely with the Contrarian 100 MA and can be located here: Overview The "Contrarian Period High & Low" indicator is a powerful technical analysis tool designed for traders seeking to identify key support and resistance levels and capitalize on contrarian trading opportunities. By tracking the highest highs and lowest lows over user-defined periods (Daily, Weekly, or Monthly), this indicator plots historical levels and generates buy and sell signals when price breaks these levels in a contrarian manner. A unique blue dot counter and action table enhance decision-making, making it ideal for swing traders, trend followers, and those trading forex, stocks, or cryptocurrencies. Optimized for daily charts, it can be adapted to other timeframes with proper testing. How It Works The indicator identifies the highest high and lowest low within a specified period (e.g., daily, weekly, or monthly) and draws horizontal lines for the previous period’s extremes on the chart. These levels act as dynamic support and resistance zones. Contrarian signals are generated when the price crosses below the previous period’s low (buy signal) or above the previous period’s high (sell signal), indicating potential reversals. A blue dot counter tracks consecutive buy signals, and a table displays the count and recommended action, helping traders decide whether to hold or flip positions. Key Components Period High/Low Levels: Tracks the highest high and lowest low for each period, plotting red lines for highs and green lines for lows from the bar where they occurred, extending for a user-defined length (default: 200 bars). Contrarian Signals: Generates buy signals (blue circles) when price crosses below the previous period’s low and sell signals (white circles) when price crosses above the previous period’s high, designed to capture potential reversals. Blue Dot Tracker: Counts consecutive buy signals (“blue dots”). If three or more occur, it suggests a stronger trend, with the table recommending whether to “Hold Investment” or “Flip Investment.” Action Table: A 2x2 table in the bottom-right corner displays the blue dot count and action (“Hold Investment” if count ≥ 4, else “Flip Investment”) for quick reference. Mathematical Concepts Period Detection: Uses an approximate bar count to define periods (1 bar for Daily, 5 bars for Weekly, 20 bars for Monthly on a daily chart). When a new period starts, the previous period’s high/low is finalized and plotted. High/Low Tracking: Highest high (periodHigh) and lowest low (periodLow) are updated within the period. Lines are drawn at these levels when the period ends, starting from the bar where the extreme occurred (periodHighBar, periodLowBar). Signal Logic: Buy signal: ta.crossunder(close , prevPeriodLow) and not lowBroken and barstate.isconfirmed Sell signal: ta.crossover(close , prevPeriodHigh) and not highBroken and barstate.isconfirmed Flags (highBroken, lowBroken) prevent multiple signals for the same level within a period. Blue Dot Counter: Increments on each buy signal, resets on a sell signal or if price exceeds the entry price after three or more buy signals. Entry and Exit Rules Buy Signal (Blue Circle): Triggered when the price crosses below the previous period’s low, suggesting a potential oversold condition and buying opportunity. The signal appears as a blue circle below the price bar. Sell Signal (White Circle): Triggered when the price crosses above the previous period’s high, indicating a potential overbought condition and selling opportunity. The signal appears as a white circle above the price bar. Blue Dot Tracker: Increments blueDotCount on each buy signal and sets an entryPrice on the first buy. Resets on a sell signal or if price exceeds entryPrice after three or more buy signals. If blueDotCount >= 3, the table suggests holding; if >= 4, it reinforces “Hold Investment.” Exit Rules: Exit a buy position on a sell signal or when price exceeds the entry price after three or more buy signals. Combine with other tools (e.g., trendlines, support/resistance) for additional confirmation. Always apply proper risk management. Recommended Usage The "Contrarian Period High & Low" indicator is optimized for daily charts but can be adapted to other timeframes (e.g., 1H, 4H) with adjustments to the period bar count. It excels in markets with clear support/resistance levels and potential reversal zones. Traders should: Backtest the indicator on their chosen asset and timeframe to validate signal reliability. Combine with other technical tools (e.g., moving averages, Fibonacci levels) for stronger trade confirmation. Adjust barsPerPeriod (e.g., ~120 bars for Weekly on hourly charts) based on the chart timeframe and market volatility. Monitor the action table to guide position management based on blue dot counts. Customization Options Period Type: Choose between Daily, Weekly, or Monthly periods (default: Monthly). Line Length: Set the length of high/low lines in bars (default: 200). Show Highs/Lows: Toggle visibility of period high (red) and low (green) lines. Max Lines to Keep: Limit the number of historical lines displayed (default: 10). Hide Signals: Toggle buy/sell signal visibility for a cleaner chart. Table Display: A fixed table in the bottom-right corner shows the blue dot count and action, with yellow (Hold) or green (Flip) backgrounds based on the count. Why Use This Indicator? The "Contrarian Period High & Low" indicator offers a unique blend of support/resistance visualization and contrarian signal generation, making it a versatile tool for identifying potential reversals. Its clear visual cues (lines and signals), blue dot tracker, and actionable table provide traders with an intuitive way to monitor market structure and manage trades. Whether you’re a beginner or an experienced trader, this indicator enhances your ability to spot key levels and time entries/exits effectively. Tips for Users Test the indicator thoroughly on your chosen market and timeframe to optimize settings (e.g., adjust barsPerPeriod for non-daily charts). Use in conjunction with price action or other indicators for stronger trade setups. Monitor the action table to decide whether to hold or flip positions based on blue dot counts. Ensure your chart timeframe aligns with the selected period type (e.g., daily chart for Monthly periods). Apply strict risk management to protect against false breakouts. Happy trading with the Contrarian Period High & Low indicator! Share your feedback and strategies in the TradingView community!Chỉ báocủa chuckaschultz45
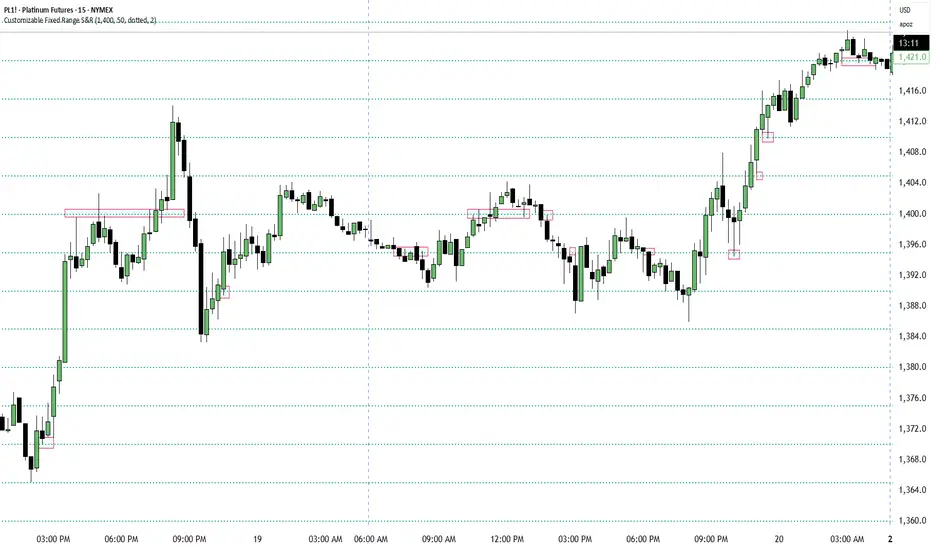
Customizable Fixed Range Support & ResistanceTraders often overlook the fixed range support and resistance, especially if they are round numbers. If you make some observations, you will see that buyers and sellers engage in numerous transactions at those levels. You can have a look at the screenshots presented here (find the red boxes!) or check it out for yourselves on the instrument's chart that you prefer. This indicator will be a big help for day traders and scalpers to set their entries, profit targets, and stop loss levels. Chỉ báocủa TheDemonTrader3372
Tomorrow's Pivot Points [SMH]這個TradingView指標不同於內置的Pivot Point指標,因為它能夠提前顯示明天的Pivot Point。透過預測下一交易日的支撐與阻力位置,交易員可以更早部署策略,為隔日的市場波動做好準備。 This TradingView indicator is different from the built-in Pivot Point tool because it can display tomorrow’s Pivot Points in advance. By forecasting support and resistance levels for the next trading day, traders can position their strategies earlier and be well-prepared for upcoming market movements.Chỉ báocủa SaitoHitomi11125
EMA50 + SR Boxes + VP Right + ATR + SL% + Entries + SentimentThis indicator combines several pro-grade building blocks to read the market at a glance: EMA50 as a trend filter. Smart Support/Resistance zones (rectangles) detected where price has touched multiple times. “U / Inverted U” markers (confirmed pivots). Optional Buy/Sell signals: only when a U appears inside a support zone with price above the EMA50 (buy), or an inverted U inside a resistance zone with price below the EMA50 (sell). Simplified right-side Volume Profile (with a special Forex fallback if volume isn’t usable). ATR & SL%: displays current ATR and an SL% based on ATR(100) Daily / Close × 100, attached to the latest candle.Chỉ báocủa Manu5914033808
Previous Day OHLCDescription : This script automatically draws the previous day’s Open, High, Low, and Close levels on each trading day. Traders widely use these reference levels to identify key support and resistance zones, potential breakout areas, and intraday bias. The levels update daily and remain visible throughout the trading session to quickly identify price interactions with yesterday’s important zones. Features : Plots the previous day’s Open, High, Low, and Close. Levels extend across the full trading day for easy reference. Useful for intraday and swing traders tracking price reactions at historical levels.Chỉ báocủa gabrielpop19032236