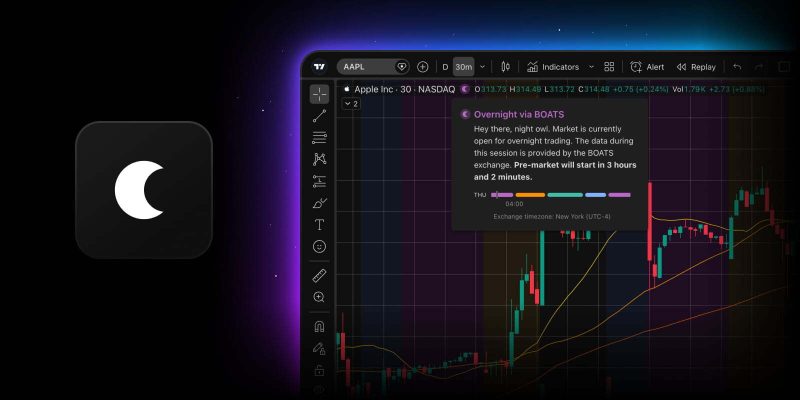
For many US stocks, meaningful price moves don’t wait for the opening bell.
Earnings announcements, analyst updates, macroeconomic news, and global events can all move prices outside regular trading hours. But overnight activity has often lived outside the main workflow, requiring separate symbols, separate charts, and separate analysis.
Now, we’re bringing overnight session data directly into the main symbol experience on TradingView.
With the new 24h session for BOATS-supported US stocks, you can follow regular, extended, and overnight sessions in one continuous intraday chart.
A single 24/5 intraday chart
With 24h session enabled, TradingView combines regular trading hours, extended hours, and overnight session data into a single 24/5 intraday chart.
Previously, overnight data was available through separate BOATS symbols. Now, supported overnight activity becomes part of the main symbol workflow, so you no longer need to switch between tickers to analyze the same stock across different sessions.
The chart brings together:
- Regular Trading Hours (RTH)
- Extended Hours (ETH)
- Overnight Session (24h)
This gives you a continuous view of intraday price action while preserving the familiar TradingView charting experience.
Note that the 24h session is designed for intraday analysis. Daily and higher timeframes continue to follow the main exchange session, so longer-term charts remain consistent with the standard market view.
Built for analysis
Overnight session data is not just visible, it becomes part of the chart.
Drawing tools, indicators, and chart analysis features can be used on the 24h intraday time series, helping you analyze overnight moves together with pre-market, post-market, and regular-session price action.
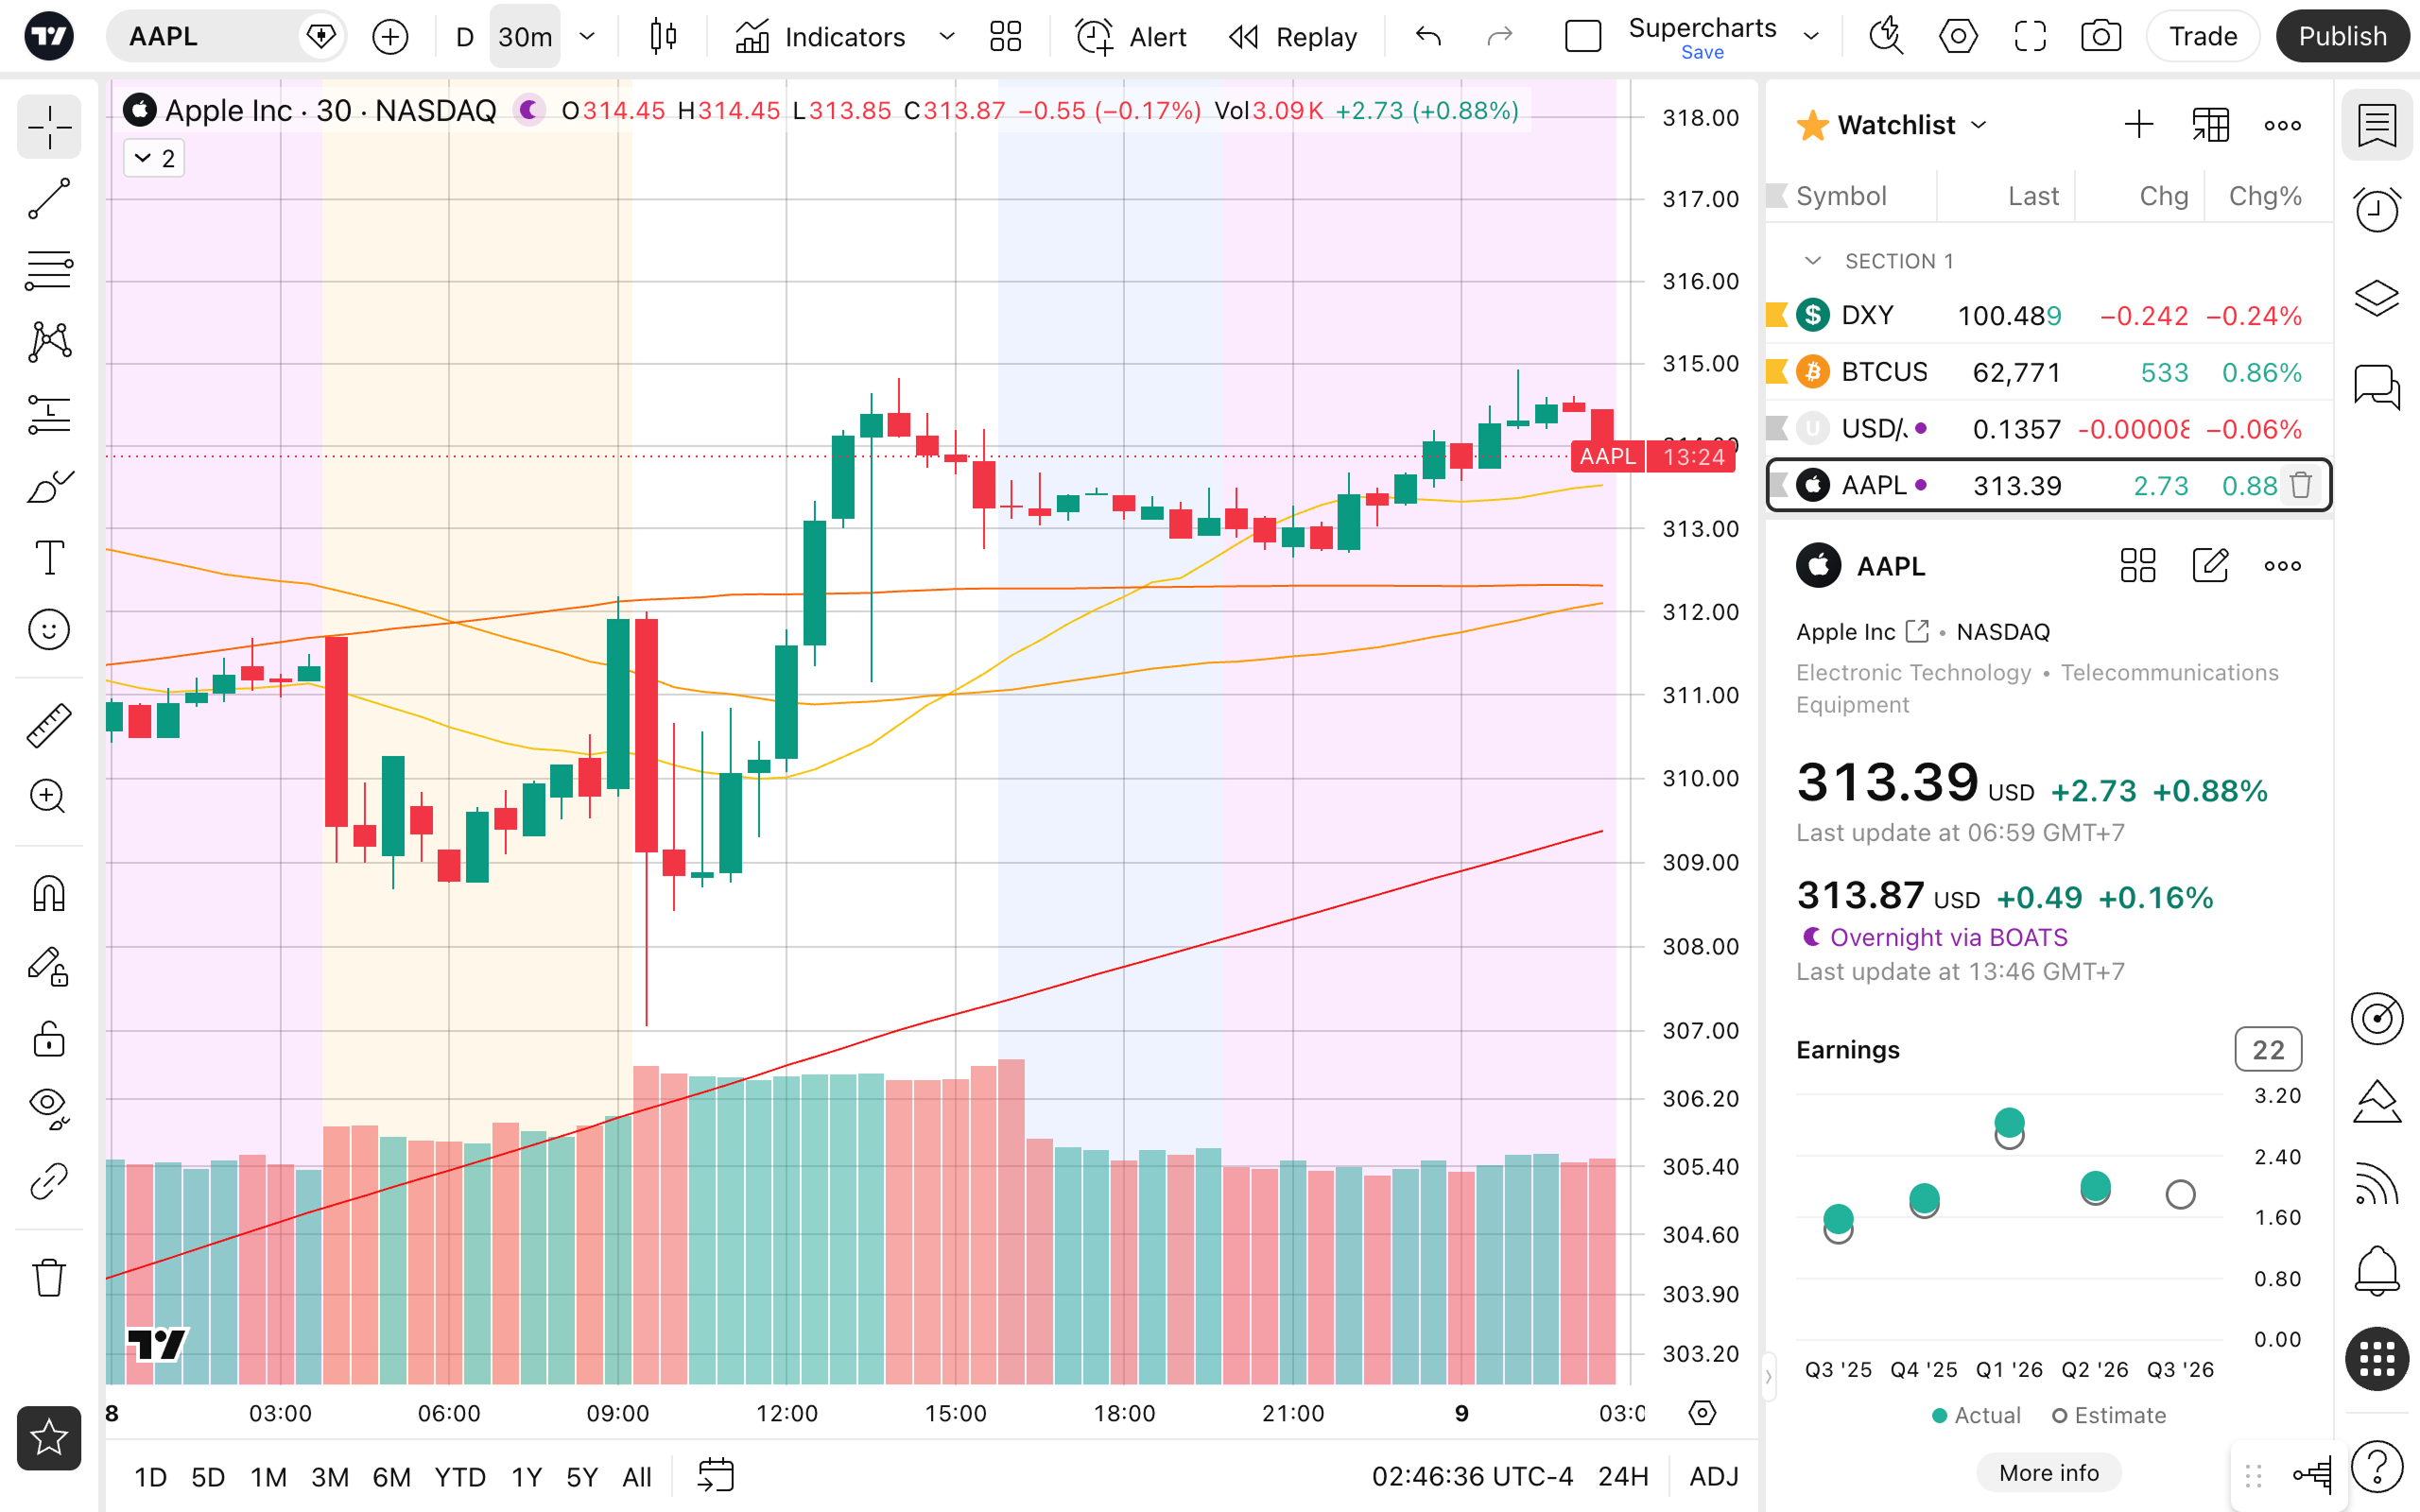
Trading periods are visually separated, so you can clearly see where the overnight session begins and ends without breaking the continuity of the chart.
This makes it easier to understand how overnight moves relate to opening gaps, pre-market momentum, and regular-session trends — all from the same chart.
See what’s happening now
TradingView also shows the current market phase directly in the interface.
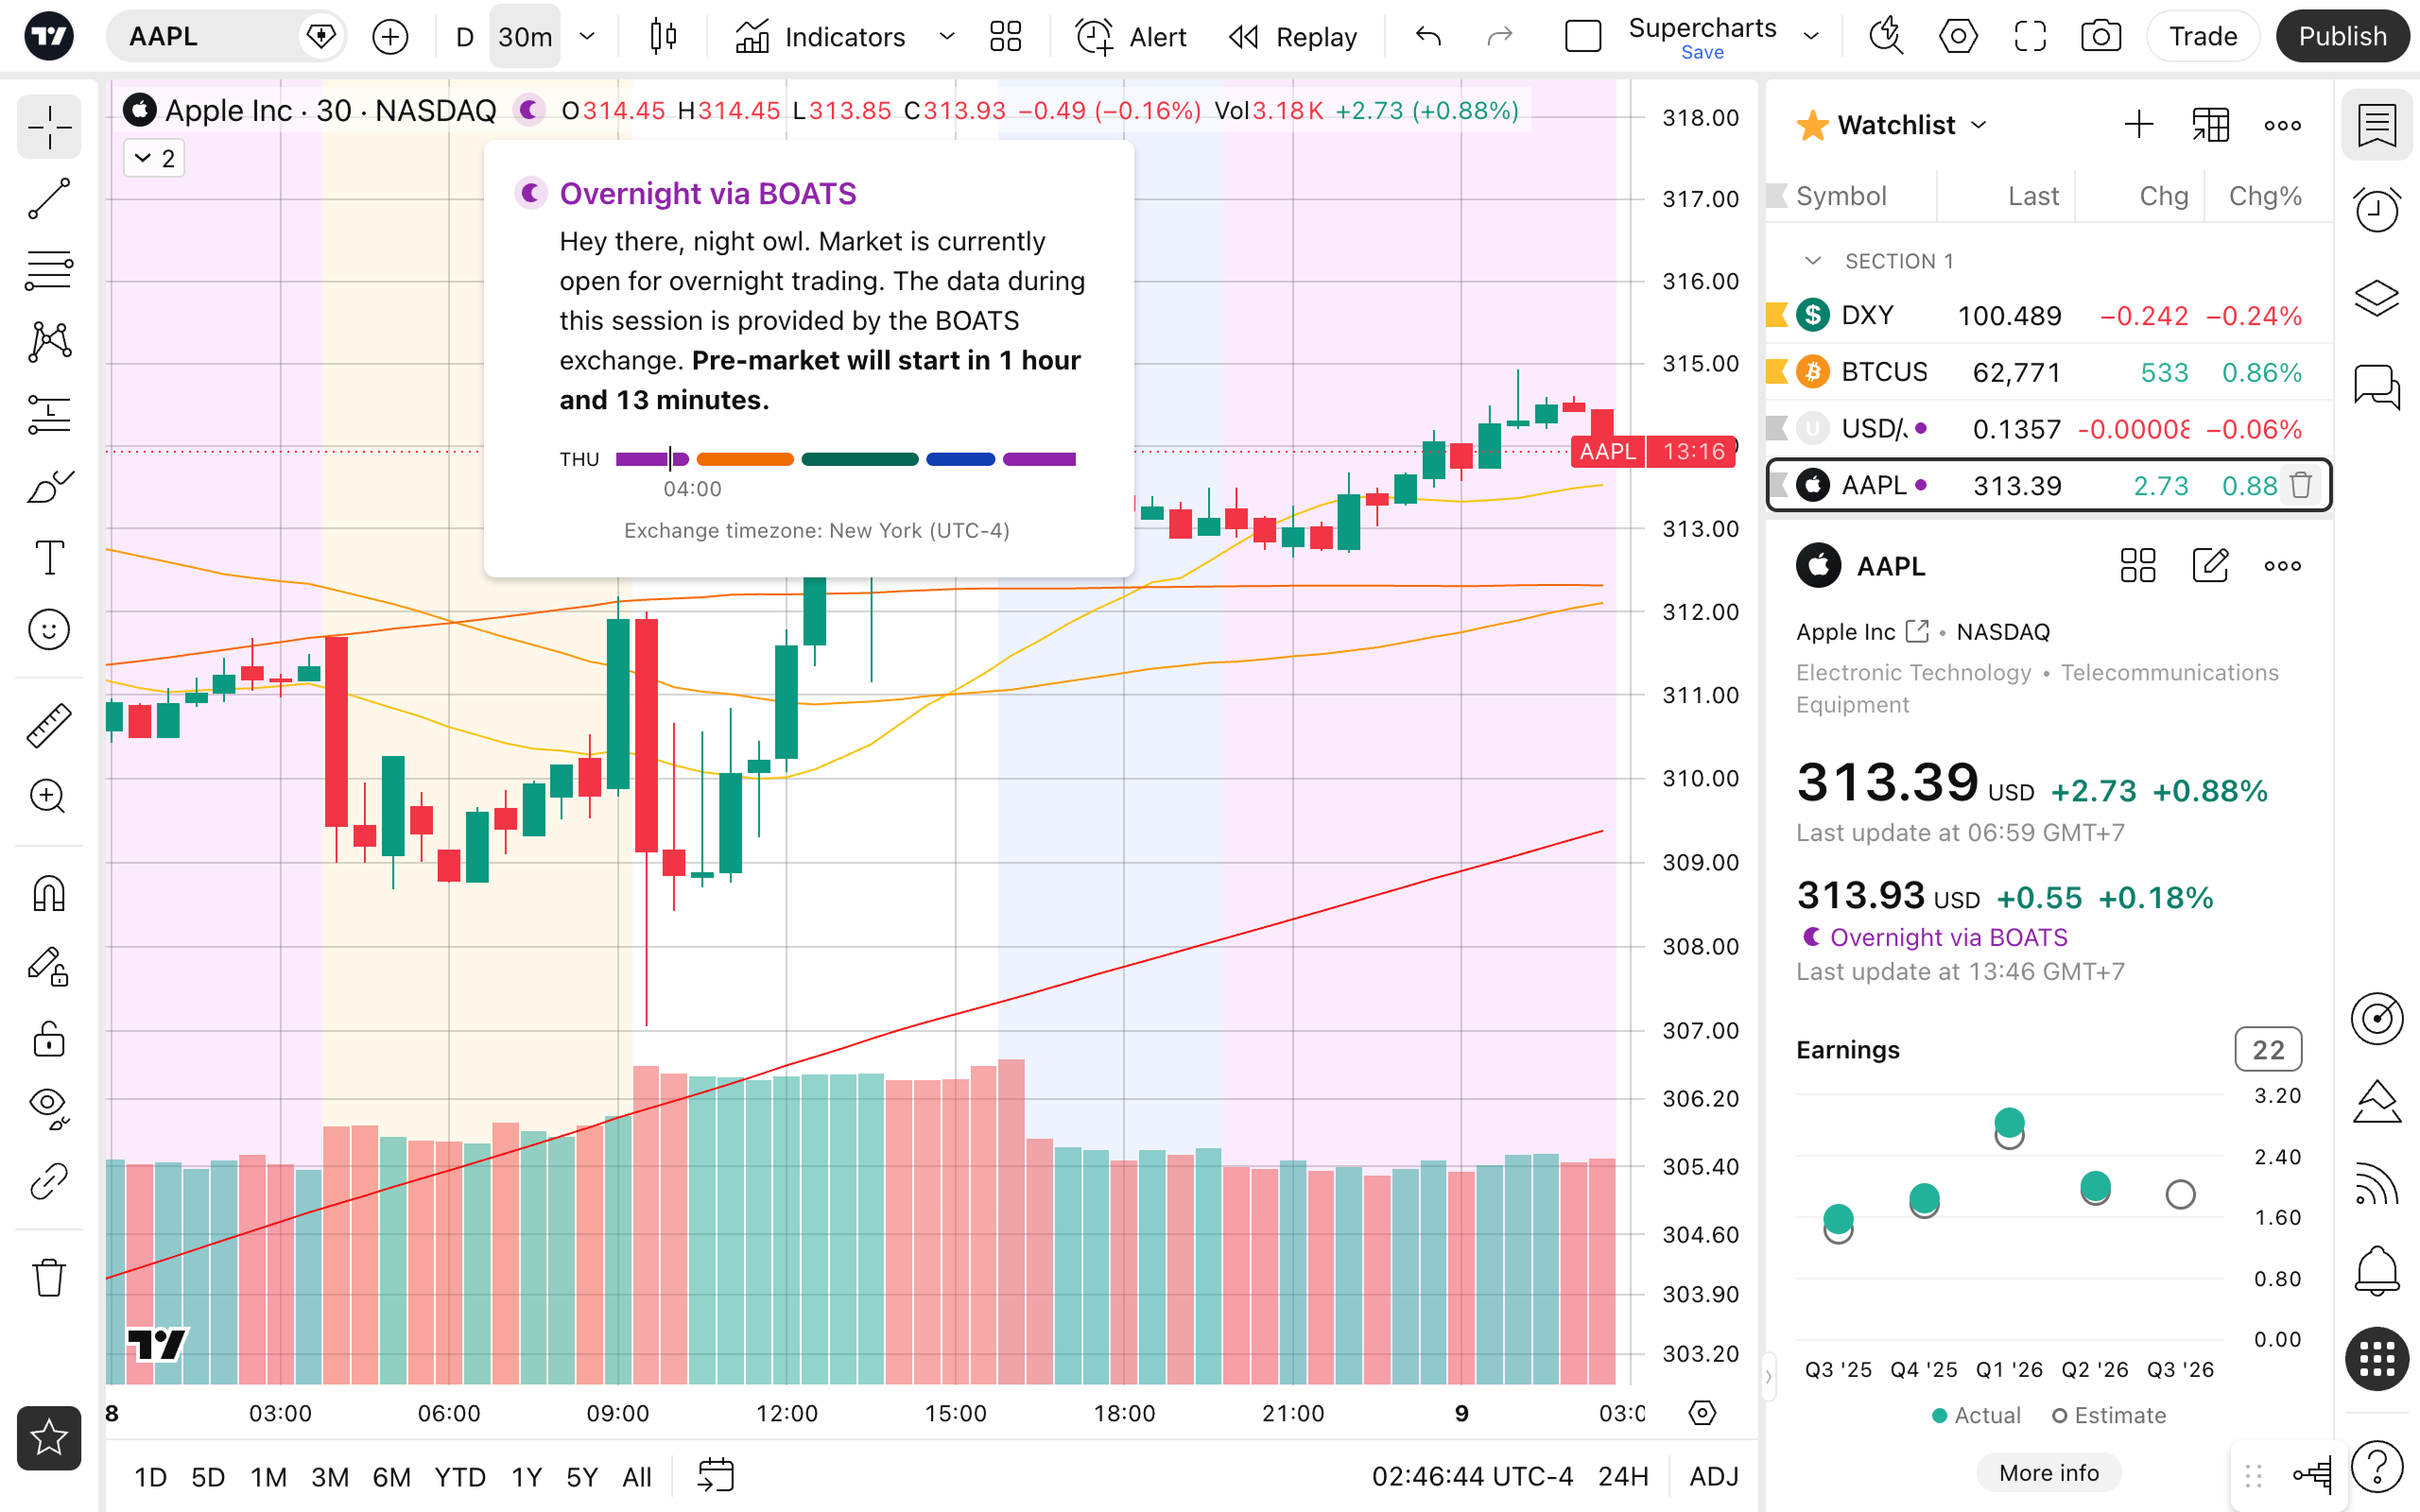
Depending on the time and symbol, you can see whether the market is currently in regular trading, pre-market, post-market, or overnight session.
For the overnight session, TradingView displays the last sale price and price change, helping you stay informed even when the main exchange is closed.
Overnight data across TradingView
24h session support extends beyond the chart.
On symbol pages and in Details, you can see whether 24h data is available, check the current session, and follow overnight price movement directly alongside the instrument.
Watchlists can also display overnight prices, so you can monitor price movements without opening separate overnight-specific symbols.
Alerts can work with the 24h chart as well, helping you track price movements that happen outside regular trading hours.
Mobile support is currently in progress, so overnight activity will soon be visible across devices.
Why it matters
The line between regular trading hours and the rest of the day keeps getting thinner.
Company news, earnings, economic releases, and global events can affect US stocks long before the next opening bell. When overnight data lives separately, it creates friction: you have to switch symbols, rebuild analysis, and manually connect price movements across sessions.
With a 24h session, overnight activity becomes part of the same experience you already use every day — the same chart, the same indicators, the same symbol, and the same workflow.
As markets continue moving toward longer trading hours, we will keep expanding the tools that help you follow and analyze them from one platform. Tell us what you think — your feedback helps us improve TradingView and shape what comes next.
Team TradingView