Why Trading Silver in the Short Term May Be The Better PlayHey traders, very simple play to look at today.
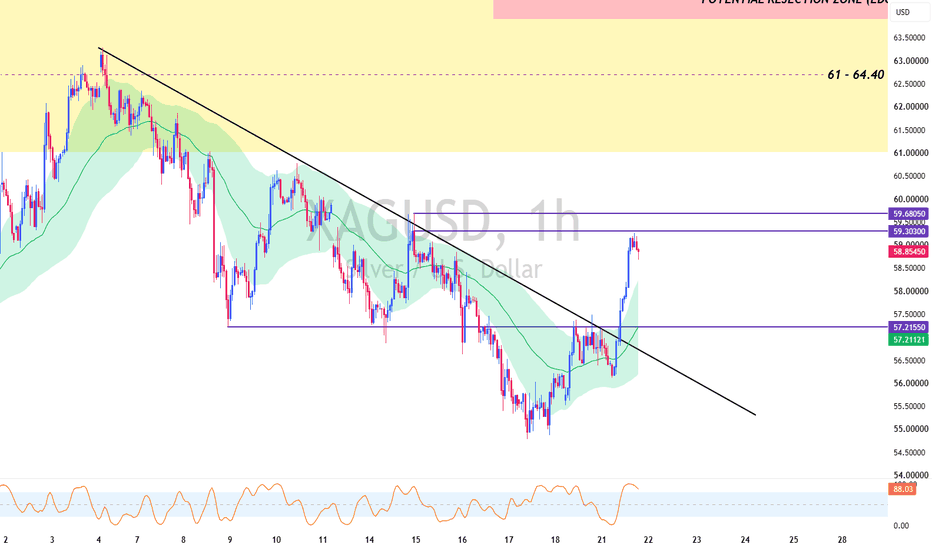
Silver is outperforming Gold, and it could be the better metal to trade in the next few sessions as the Silver-to-Gold ratio chart has flipped short term bullish (1h).
Both metals are right now at resistance, so expect a retracement first, but once they stabilise (and if USDJPY plays nice), I expect Silver to move in a stronger manner compared to Gold.
More details in the video, but that's the basic gist.
- Yang
Alchemy Markets publications
SpaceX Returns to $135: What Would Confirm a Recovery?Hey traders, quick one here.
Many of you are probably wondering whether SpaceX is becoming a value buy after falling back towards its $135 IPO offer price.
Well let's examine several moving parts here...
There is a structural source of demand behind the stock.
SpaceX was added to the Nasdaq-100 on 7 July, meaning funds that track the index are required to hold it. This includes index products used within some retirement accounts, although it does not mean every 401(k) is automatically buying SpaceX.
That demand may provide support, but it does not settle the valuation question.
SpaceX does not currently have a meaningful positive P/E ratio
It reported a net loss of approximately $4.94 billion in 2025, followed by another $4.28 billion loss during the first quarter of 2026. Investors are therefore paying for the expected growth of Starlink, launch services, Starship and its other developing businesses, rather than current net earnings.
Now that the share price is back near the official $135 IPO offer price, what should traders look for before developing a higher-confidence bullish view?
The $135 level was the price paid by investors during the offering, while public Nasdaq trading began at approximately $150.
The earliest technical sign, in my opinion, would be a reclaim of the declining 1 hour 50-EMA band.
SPCX has remained beneath this band throughout its recent decline, with rebounds repeatedly failing around it. That keeps the short-term structure bearish and suggests sellers are still using recoveries to reduce exposure.
A move through the upper edge of the band would be the first step. However, a temporary break is not enough. Price would need to hold above the band and successfully defend it during a retest.
That would indicate that the 50-EMA band is beginning to shift from resistance into support.
Until that happens, the base case remains cautious. A sustained move below $135 would place SPCX beneath its IPO offer price and reopen downside price discovery.
A confirmed reclaim of the EMA band would improve the short-term picture and bring $150, SpaceX’s first public Nasdaq trading level, back into focus.
Key levels:
$135: Official IPO offer price
1H 50-EMA band: Immediate dynamic resistance
$150: First public Nasdaq trade and major recovery level
- Yang
DXY 4H | US Dollar Index: The Conditions for Continuation LowerJune inflation undershot on every gauge and the dollar barely moved. This breakdown walks through what the DXY range structure requires before a downside continuation is credible, why the composition of the print matters more than the number, and the single input that would invalidate the entire setup.
Covered: range structure, impulse and corrective behaviour, level defence, Fed policy repricing, energy component analysis, crude oil linkage.
4-hour timeframe. .
[UPDATE] Is the Cup and Handle Still Healthy?Hey everyone, I wanted to update our TSLA's weekly cup and handle idea again.
With semiconductors and Nasdaq taking a hit after META’s reported work with Chinese chip companies, plus renewed geopolitical risk around the Strait, the cup and handle setup is starting to look less clean.
That said, geopolitical headlines and sudden company-direction shifts are hard to predict. So instead, I’m focusing on the technical levels retail traders can actually watch.
For now, I’m using the 4H FVG zone to set short-term bias.
Strong close above the FVG = bullish recovery case stays alive
Close back below the FVG = bearish structure returns
Key resistance: 430-453
Key support: 364-380
The setup is no longer looking clean. Nasdaq breadth is also weakening, with TSLA historically struggling when the NDX breadth indicator drops below 55.
TLDR: Still valid, but less healthy. Watch the stated support and resistance zones.
- Yang
NZD/USD: the bear flag walks into the RBNZPrice has coiled into a bear flag, that neat little upward drift after the leg down. Textbook, it resolves lower, and the flag is pointing straight into the yellow support zone I've marked. That band is the whole story now. Hold it and the sellers lose their grip; lose it and the next leg opens up.
Is Gold's Low in? This Secret Chart May Offer a ClueHey traders, this is breakdown of why I think Gold has found a temporary bottom here, and potentially, a major low.
Aside from a bullish divergence forming on Gold's daily chart, several ratios against Gold are showing that the yellow metal is priced at a major reversal point.
The main chart in question I'm talking about is - GOLD/XLK, or XAUUSD/XLK
After 10 consecutive weeks of underperformance, Gold is now revisiting its 2021 and 2024 levels of weakness against the XLK.
Both times, gold rallied while the tech sector dropped.
Again, this doesn't mean gold is definitely going to reverse now, but rather:
The conditions for a major gold reversal seems to be in place
On the daily timeframe as well, Gold is forming a bullish divergence against:
The Nasdaq
The S&P 500
SOX Semiconductors ETF
XLK ETF itself
And to boot, all of them are being suppressed by the 20-EMA band.
You can add this to your chart by selecting Bollinger Bands, and setting the basis line to 20 EMA, and standard deviation to 1.
Very helpful in my opinion.
If gold can overcome the 1d-20 EMA band on XAUUSD, GOLD/XLK, and other pairs, I would become more optimistic on $4,000 being a major low.
Again, this is just an opinion using historical behaviors and technical analysis - not financial advice. Trade safe, and have a great weekend ahead!
- Yang
BREAKING: Did Japan Just Intervene in USDJPY?As we approach the end of the trading week, Japanese authorities appear to have JUST intervened in USDJPY.
While this remains unconfirmed at the time of writing, it is undeniable that a major EMA has just been broken, marking a possible shift into a downtrend for the 1st time in two months.
July 2nd to 3rd was already on our radar here at Alchemy as a possible intervention window because US market liquidity is thinning ahead of the Independence Day holiday.
Japanese authorities have previously preferred intervening during quieter market periods, when the impact can be larger.
Price could find some support here for now before rising back into the EMA band.
If that happens, watch for a possible resistance test around 161.50, 161.80 or 161.95.
Another possibility is that this was a rate check, which can be used to warn yen sellers before direct intervention.
Let’s see what happens as we enter the New York open.
Trade safe and take care of your accounts!
- Yang
KIS: Google at 4H Upper Trendline after a Relief RallyHey all, pretty simple update today on Google - It's looking to break this upper trendline after two massive up-days.
A rejection here is probable, but watch how Google reacts at:
1. The previous high at 353
2. Support zone at 337 to 349
To see if a bounce will take place. If the trendline is broken, we may find resistance at the 367 zone, and support at the trendline.
Keep it simple - until we get definitive shakeups in the war or interest rates, dip buyers still appear active across large-cap tech.
Other confluences: 4H bullish rsi divergence, 1D-EMA 200 (~$320) as support
- Yang
NKE: The Beat Was Fake — Why NKE Just Broke Down to 10-Year LowsNike posted a massive EPS beat this week — but most of it came from a one-off tariff refund, not the actual business. Strip that out and you get a company still guiding cautiously, still losing share in China, and a stock that closed at a 10-year low before the print even hit. In this video we break down the print, why management's own words did more damage than the numbers, and what the chart is telling us now that price has cleanly broken the multi-month $42–$47 range. We map out the key levels to watch on any retest, why this isn't a base yet, and the squeeze risk retail positioning could bring if that changes.
Micron Just Smashed Earnings — So Why Is the Chart Hesitating?Micron just posted one of the biggest earnings beats in its history and gapped higher into a level it's been respecting for weeks. In this video we step back from the headline and let the chart talk: the rising channel that's framed the entire move off the spring low, where price is sitting right now relative to channel resistance, and the two anchored VWAPs that could decide what happens if this stalls. Record revenue, record margins, and a stock pressed against structure — the fundamentals are loud, but the price action is where the story actually plays out. We'll map the levels that matter, the RSI behaviour you'd want to keep an eye on, and the scenarios in play from here.
Google Drops to a Key Support at $343: Time to Buy?Following senior AI researcher John Jumper's "jump" to Anthropic, Google has seen a rapid decline. Now we find ourselves back at the 337.47-349.00 zone, which has served as support before - is this an attractive spot to buy?
At first glance, this looks very attractive, even to me. And a further peek reveals a 4H bullish divergence forming at this exact location.
However, the true test is whether buyers actually defend this zone again.
🟢 If Google holds above 337.47-349.00, then this could be a decent relief-rally setup back towards the 365.82-374.07 gap-low zone.
🔴 If Google breaks cleanly below this support, then the February breakout starts to look like a failed move, and the chart gets much less attractive.
Additionally, Micron (MU) will be doing their earnings call tomorrow. That event could be a sell the news moment , especially if Micron does not outdo already positive expectations.
Technically, this is a strong supportive base for Google, but if sentiment around AI disappoints through Micron's earnings tomorrow, GOOGL could be in for some trouble.
My personal take is to wait for tomorrow's Micron earnings before jumping into any hasty decisions. Not financial advice, of course.
I only say this because we are currently in a fragile environment, with a hawkish Fed, fragile negotiations, and an overstretched AI market.
Follow us our take on Micron tomorrow, which could be a decisive factor for Google holding its support.
- Yang
Can Micron rescue the Nasdaq?All eyes are on Micron’s fiscal Q3 results after the close, followed by the earnings call at 4:30 p.m. ET. This is probably the most important near-term catalyst for semiconductors right now, as it could:
Stabilise the Nasdaq and S&P 500
Bring some optimism back into the AI trade
Or accelerate the current bearish sentiment
However, there is a good case that yesterday’s decline was amplified by panic and forced selling , rather than a sudden collapse in semiconductor fundamentals.
A lot of the pressure came from South Korea, where the KOSPI’s heavily leveraged chip trade unwound very quickly. Margin borrowing had climbed sharply since 2025, while Samsung and SK Hynix had grown to more than half of the index. Once those two names started falling, the pressure spilled across the wider Korean market and over into US semiconductor stocks.
That spillover has now left a possible bearish island top on the Nasdaq:
This means Micron now has two jobs to fulfil tonight:
Deliver a strong earnings beat and positive guidance
Convince the market that HBM and high-end DRAM demand are still strong enough to support the wider AI trade
Technically, Micron is still holding its wider uptrend despite the recent damage.
🟢 Watch the daily 20-EMA, the first area that matters, since buyers have stepped in around that band several times before.
🟢 If earnings and guidance land well, this is where price could bounce if it gets there.
🟢 If the daily 20-EMA fails, the daily 50-EMA becomes the next zone where traders may expect a reaction.
A strong HBM and DRAM outlook could calm the semiconductor trade and weaken the bearish island-top setup on Nasdaq.
However, we have a little bit of an awkward news cycle. Tomorrow's PCE release could turn even a bullish read on Micron into a stall. Even if Micron delivers strong numbers, price could spike and then stall as traders wait for the next inflation print.
– Yang
Bitcoin $80,000 Rejection Idea (Bearish Scenario)Bitcoin just tapped into $80.5K - a critical zone.
It's the lowest point Bitcoin has reached in November 2025 and now, Bitcoin could be rejecting off that level with multiple bearish confluences.
1. Rising channel / Bear Flag - BTC could be testing the top of a channel.
2. Lowering volume - This is a sign of consolidation, and aligns well with the idea of a bear flag.
3. EMA 200 Band (0.25 standard deviation) - Since the Death cross, when BTC taps into this zone, it pivots.
And last but not least, Bitcoin looks like it's in a 5-wave move to the downside.
This bear flag is potentially the 4th developing leg, and if it breaks $70,000, could take us to $50,000 or even lower.
Note: This is not a trade setup, but rather just a clarification of why Bitcoin looks bearish on a technical level.
Bitcoin Bearish Trade Idea Still Valid - Readjusted Targets $38KBitcoin has the potential to fall towards $38K as per a daily timeframe bear flag. And on the 1H timeframe, a smaller rising channel breakdown appears to be forming.
Overall, macro conditions of a hawkish Fed do not support Bitcoin upside, so be very careful even if Bitcoin recovers into $64 - $64.46K today.
$50K level remains a valuable watch as that was a springboard for a previous rally.
- Yang
Potential Value Play on Tesla: Massive Cup and Handle to $765Tesla is starting to look pretty interesting on the daily/weekly. There’s a possible massive cup-and-handle structure forming, with the neckline around $488.
If TSLA can break that level cleanly and HOLD the neckline, the measured move points towards the $764–$765 region over the longer term.
The extra spice is the SpaceX narrative. With Elon signalling that Tesla could potentially be rolled into SpaceX, the market may start treating TSLA differently again.
Definitely not a “ape in now” signal, but it is very interesting how the fundamentals and technicals are lining up on Tesla.
As a long-term value/speculation setup, this is one I’d personally keep on the watchlist.
- Yang
[UPDATE] TESLA Cup and Handle: Still Valid after Hawkish FOMC?TLDR - Tesla is likely going to be range bound within 365 - 410 today, and Monday we may see a gap to support or invalidate the Cup and Handle pattern.
Thanks for all the support on the first video! I hope to answer some questions you've posted in the comment section of the first one:
Is there a double top?
What do you think about the Opex today?
Is this pattern still solid after Warsh's FOMC?
Overall, if Tesla breaks 365 and holds below, a double top pattern could play out. If that happens, the cup and handle case looks weaker. If it holds, this idea is still valid - but only confirmed once the 488 neckline breaks (and price holds above).
Keep in mind that:
- Tesla has Q2 earnings in July
- US and Iran signed the MOU, so the 60 day peace deal is in play
- Macro backdrop of the Fed is now HAWKISH - not supportive of upside price movements
- Israel is still opposed to the MOU in regards to Lebanon, which means the MOU is fragile
For Monday, I’m watching whether Tesla holds the $380–$365 area or breaks lower towards $337. If buyers reclaim $420, the bullish structure starts looking better again.
Let me know in the comments which scenario you think plays out first.
Have a great Juneteenth and take care of yourselves.
– Yang
DXY | The hawkish signal with a built-in expiry dateThe June FOMC was billed as a quiet hold and on the headline rate it delivered exactly that, unchanged at 3.50 to 3.75 percent. Everything wrapped around that hold was the story.
The dot plot flipped from a projected cut to a projected hike. Headline PCE inflation forecasts jumped to 3.6 percent, core to 3.3, while growth was trimmed and the easing language was stripped out of the statement entirely. The 2-year yield led the move higher, equities sold off, and the dollar caught a bid into resistance.
Here is the part most desks are not pricing. The hawkish jolt came almost entirely from the SEP projections, and Chair Warsh withheld his own dot, launched a task force to overhaul the tool, and has said on record he wants forward guidance gone. The instrument that just moved markets is the one he is dismantling.
That matters for the chart. DXY is pressing the 100.00 to 100.60 band that has capped every rally since mid-2025, sitting inside a rising channel off the February low. The hawkish dots give the breakout fuel. The guidance vacuum is the reason it may not hold.
A clean daily close above 100.60 opens the channel higher. Rejection here sends it back toward channel support. The level is doing the talking, not the narrative.
Nvidia: The Chart Move Everyone Missed This WeekNvidia spent this week behind the bond-sale headlines, but the 4-hour chart was building a structure worth a closer look. In this one I walk through the anchored VWAP from the March lows, the 50% Fibonacci retracement of the spring rally, and the consolidation pattern forming at current levels, then tie it back to the hyperscaler capex trend that Nvidia's largest segment is priced on. I cover the levels I'm watching on both sides and what would confirm or invalidate the setup.
WTI Crude: The Premium's Gone. Now What?Three weeks ago the triangle refused to break. This week it did. WTI has round-tripped the entire war premium and now sits at a level that decides everything from here. With the fear priced out and the deal headlines catching up to the chart, the real question is what turns oil back up, and it's not the catalyst everyone's watching. We map the structure, the measured move, and the one driver the market may be underpricing.
Euro's at the Top of the Channel — Eyes on 1.18 | EUR/USDLast time we looked at the euro, price was sitting at the bottom of this channel. It's now pressed against the top — and one clean move decides whether this is a flag breakout or just another rejection.
We break down the structure, the rate-divergence tailwind giving the euro its fuel right now, and the one level that flips the whole picture. Above it, there's a target overhead that's been sitting there since May. Below it, we're right back where we started.
With the Fed landing this week, the timing isn't an accident.
The Channel Held Again — But This Bounce Feels Different | GoldThe channel we've been tracking since the January high just did its job again — gold drove down to the lower boundary, tagged it, and bounced. But a bounce inside a falling channel and an actual breakout are two very different things, and only one of them ends the four-month downtrend.
In this update we check back in on the same structure, look at why this bounce might have more behind it than the last few, and lay out the two levels that decide whether the bottom is in — or whether we're just setting up the next leg lower. With the Fed landing this week, the timing matters.
Watch the boundary, not the headlines.