LITE Surges: Why AI Investors Are Repricing Optical Networking? AI Money Is Looking for the Next Infrastructure Theme
Against a backdrop of higher rates and broad pressure on technology stocks, Lumentum (LITE) surged roughly 9.6% on September 16, making it one of the strongest performers in the S&P 500. Concerns over the sustainability of AI capital spending have recently increased, but money is not simply leaving the AI trade. Instead, investors are rotating toward infrastructure segments where orders are clearer and earnings growth is already becoming visible. Optical networking is increasingly one of those areas.
As AI data centers expand, the bottleneck is no longer just GPU supply. Larger clusters require dramatically more data to move between servers, racks and data centers, accelerating the transition from 800G to 1.6T connectivity. Bandwidth, latency and power efficiency increasingly determine the performance of AI infrastructure, raising the strategic importance of optical modules, optical components and switching technologies.
Compared with simply adding more GPUs, network upgrades are becoming a necessary part of the next phase of AI infrastructure investment. That is one reason optical networking stocks are attracting renewed attention.
Lumentum’s Growth Is Already Showing Up in the Numbers
More importantly, this story is no longer based purely on expectations. Lumentum’s latest quarterly revenue reached $1.006 billion, up 109% year over year and 24.5% sequentially. Non-GAAP gross margin rose to 50.4%, while operating margin reached 36.6%.
For the next quarter, the company expects revenue of $1.225 billion to $1.275 billion, with non-GAAP operating margin rising further to between 39.5% and 40.5%. Growth is therefore no longer coming from revenue expansion alone. Profitability is improving at the same time.
This puts Lumentum in a particularly important stage of its growth cycle. As higher-value products account for a larger share of revenue, incremental sales may not require proportional increases in operating costs. That creates operating leverage. If this trend continues, earnings could grow significantly faster than revenue, potentially changing how investors value the company.
1.6T and OCS Open Up a New Growth Runway
At the product level, 1.6T cloud modules and optical circuit switching, or OCS, are emerging as key growth drivers. 1.6T products address the higher-bandwidth requirements of next-generation AI data centers, while OCS gives Lumentum exposure to a broader upgrade in network architecture. Management has already indicated that both businesses are beginning to contribute to growth.
This also means Lumentum’s AI story is becoming broader than simply selling more optical components. If 1.6T volumes continue to rise and OCS develops into a meaningful business, the company could move further into higher-value parts of the AI data-center infrastructure stack. That could support an additional improvement in both revenue quality and margins.
After the Rally, the Market Is Pricing in High Expectations
The rapid rise in the share price, however, changes the key question. The main risk for LITE is no longer whether AI demand exists. It is how much future growth the market has already priced in.
If hyperscaler capital spending slows, order growth weakens, or the ramp in 1.6T and OCS falls short of expectations, Lumentum’s elevated valuation could amplify downside volatility.
Expectations also become harder to satisfy after a major rerating. Earlier in the cycle, evidence of stronger demand alone could support the stock. Going forward, investors are likely to focus much more closely on order growth, margin expansion and whether earnings guidance can continue to exceed expectations.
The next phase therefore depends on three variables: whether 1.6T shipments continue to accelerate, whether OCS develops into a meaningful revenue contributor, and whether margins can keep pace with current expectations.
If those indicators continue to strengthen, Lumentum’s valuation rerating will remain supported by improving fundamentals. If they do not, the high expectations already embedded in the share price could leave far less room for execution mistakes. XAUUSD: First Fed Hike in 3 Years — Can Daily Support Hold?📊 Market Context
The Fed just delivered its first rate hike since 2023 — 25bp to 3.75%–4%, unanimous 12-0. Chair Kevin Warsh made the message unmistakable: inflation has been "too high for too long." The statement dropped references to temporary energy shocks, placed the burden squarely on monetary policy, and signaled one more hike may be coming this year. Middle East tensions were explicitly cited as a contributing factor.
For gold, the macro read is straightforwardly bearish: higher real yields, a stronger dollar, rising opportunity costs for a non-yielding asset.
Yet XAUUSD TVC:GOLD is sitting at 4,282 — right on a daily support zone that has been holding. This is a decision zone, not a breakdown zone.
📉 Technical Structure
Price has pulled back sharply from the 4,697 swing high, printing lower highs and lower lows. Multiple moving averages sit overhead. The short-term trend is under pressure.
Key levels:
Resistance: 4,315–4,331 (MA cluster) → 4,350–4,371 (recovery zone) → 4,408–4,415 (major resistance) → 4,434–4,510 → 4,697 (swing high)
Support: 4,276–4,282 (current) → 4,252 → 4,100 → 3,942 (higher-timeframe)
🎯 Core Thesis
Below 4,350–4,371, the bias stays bearish. The cleanest setup is a short on a rejection into that zone — look for a bearish rejection candle, a lower high, and failure to reclaim 4,315–4,331. Confirmation from a stronger dollar or rising Treasury yields would add weight.
Bearish targets: 4,252 → 4,100 → 3,942 (extended if macro pressure accelerates).
A daily close below 4,276 would confirm the support has failed and sellers remain in control.
⚠️ Risk View
But support hasn't broken yet. If 4,276–4,282 holds and price reclaims 4,315–4,331, a relief rebound is live — especially if the dollar fades, yields retreat, or the hike was already fully priced in. A sustained break above 4,350–4,371 would be the first real sign the bearish structure is cracking. Above 4,415, the bearish thesis is invalidated.
🔑 Conclusion
The FOMC created a fundamentally bearish setup for gold — higher rates, elevated real yields, potential dollar strength. But price is testing daily support, not breaking it.
My read: below 4,350–4,371, stay bearish. Watch 4,276–4,282 for the next move — a break below opens 4,252 and 4,100; a hold and reclaim of 4,331 shifts the tone.
I'm tracking the dollar and Treasury yields alongside price for confirmation of the next XAUUSD move.
Trade gold and major stock indices through Bitget CFD, including XAUUSD, the Dow Jones, S&P 500 and Nasdaq — and stay prepared for opportunities created by FOMC, CPI, nonfarm payrolls and Treasury-yield volatility.
⚠️ Risk warning
CFDs are leveraged derivatives and can result in rapid losses. Losses may exceed your initial margin. This analysis is for educational and informational purposes only and does not constitute financial advice. Always manage your leverage, position size and risk before trading. Cloudflare New High: AI Safety Threat Turns Into Growth Engine?Cloudflare (NET) has become one of the strongest names in software and cybersecurity. On September 14, the stock surged 7.8% to $330.36 and touched $334.60 intraday, extending a sharp September rally.
The immediate catalyst is a broader reassessment of which companies could benefit from the next phase of artificial intelligence. But Cloudflare’s rally is about more than short-term rotation. The company increasingly sits at the intersection of AI agents, internet infrastructure, cybersecurity and machine-generated traffic.
The key question is whether that strategic position can support a valuation that has already become extremely demanding.
AI Is Becoming a Tailwind Rather Than a Threat
For much of the AI boom, software companies faced a difficult question: if AI can automate workflows, write code and replace parts of traditional software, will existing platforms eventually lose pricing power?
Cloudflare presents a different case. As AI models and autonomous agents generate more internet traffic, the infrastructure required to identify, secure, route and control that traffic becomes more important.
A recent partnership with OpenAI highlights this shift. On September 3, Cloudflare announced Vulnerability Discovery and Remediation, a security service using OpenAI Daybreak models, including GPT-5.6 Cyber. The system combines AI-based code investigation with real-time information from Cloudflare’s global network.
That gives Cloudflare an interesting position in the AI ecosystem. It does not need to compete directly with frontier model developers. Instead, it can provide the security and network layer through which increasingly autonomous software operates.
Cloudflare is also experimenting with new ways to monetize AI traffic. Its Pay Per Crawl system allows website owners to charge AI crawlers for access to their content. Although the product remains in beta, the strategic direction is clear: Cloudflare wants to become an intermediary between AI systems and the open internet.
Growth Is Accelerating — But Valuation Is the Main Risk
The AI narrative is supported by improving fundamentals.
Cloudflare generated $696.1 million in second-quarter revenue, up 36% year over year. Current remaining performance obligations grew 35%, while management raised full-year 2026 revenue guidance to $2.864-$2.870 billion.
That acceleration matters. Cloudflare spent several years trading at a premium while revenue growth gradually slowed. A return toward the mid-30% range strengthens the argument that AI, security and developer infrastructure are creating another growth cycle.
The problem is that investors are already paying heavily for that scenario.
With the stock around $330, Cloudflare’s equity value is approaching $120 billion. Against roughly $2.87 billion of expected 2026 revenue, the company is trading at around 40 times current-year sales.
Even on non-GAAP earnings, the valuation remains exceptionally high.
The market is therefore pricing Cloudflare as more than a fast-growing cybersecurity company. Investors are effectively assuming it can become a critical infrastructure layer for the AI-driven internet while sustaining very high growth for years.
That may eventually prove correct, but the margin for disappointment is now small. Strong results alone may not be enough. Revenue growth, large-customer expansion and guidance will increasingly need to exceed already elevated expectations.
After the Breakout, What Should Traders Watch?
Technically, NET has entered price-discovery territory.
The first key level is $334-$335, around the latest intraday high. A clean breakout above this area would confirm that buyers remain willing to chase the stock after its rapid September move.
Below that, $315-$320 is the first important support zone. A pullback into this area would still be consistent with a strong trend.
The more important level is $300-$305. As long as NET remains above $300, the broader breakout structure stays intact and weakness can still be viewed as consolidation rather than trend failure.
A decisive move below $300 would change the setup. It would suggest that the recent AI-security revaluation moved too quickly and could expose the stock to a deeper retracement.
Cloudflare therefore presents a clear tension: fundamental momentum is improving at the same time valuation risk is becoming more extreme.
AI may be expanding Cloudflare’s addressable market rather than disrupting it, which helps explain the recent re-rating. But with NET near record highs and trading around 40 times expected 2026 sales, the next leg higher will require continued execution.
From here, the fundamentals need to catch up with the price. DXY: Hot CPI Won't Save the Dollar Unless 99.95 FallsAugust CPI just came in hot — 0.4% headline, 0.3% core — and the dollar barely flinched. DXY is sitting around 99.10, right on its short-term support, and the question isn't whether inflation is sticky. It's whether the market still cares.
🌍 Why This Matters Now
The BLS dropped August CPI on September 11, and the headline print was a surprise: 0.4% MoM, up from 0.2% in July and above the 0.3% consensus. Core CPI held at 0.3% MoM for the second straight month, with the year-over-year rate at 3.1% — still well above the Fed's 2% target. Shelter (+0.4%) and energy (+0.7%, gasoline +1.9%) did the heavy lifting.
Here's the thing: a hot CPI print used to send the dollar ripping. This time, DXY barely moved off the 99.10 support. That tells me the market may have already priced in higher-for-longer — and the breakout isn't going to happen on CPI alone.
📊 Key Technical Levels
Resistance: 99.70–99.95 — The supply zone where the declining moving-average cluster sits. Price has been rejected here repeatedly. This is the line in the sand.
Breakout target: 100.50, then 101.00–101.15 — A confirmed daily close above 99.95 opens the door toward the next major resistance near 101.
Support: 99.10–99.20 — The most important short-term demand zone. A daily close below 99.10 breaks the rebound structure and exposes 98.55–98.80.
🎯 Core Thesis
My read: DXY TVC:DXY is neutral-to-bullish, but only conditionally. The macro backdrop supports a dollar bounce — sticky core inflation at 3.1% YoY means the Fed has cover to slow or pause rate cuts. But here's the catch: the 0.4% headline was inflated by energy and food, not by a re-acceleration in core services. Core services inflation held at 0.3% MoM — flat for two months. That means the "structural inflation comeback" narrative might be overstated.
So the dollar's fundamental tailwind is real but possibly thinner than the consensus thinks. For DXY to break 99.70–99.95, I want to see two things: Treasury yields climbing back toward recent highs, and price acceptance above 99.95 on a 4H close — not just a wick.
⚠️ Risk View
The risk to this setup is clear: if 99.10 fails on a daily close, the rebound structure breaks. The 98.55–98.80 demand zone comes back into play, and the bullish thesis is invalidated. On the flip side, repeated rejection at 99.70–99.95 keeps DXY range-bound and erodes buyer confidence.
Watch the 10Y yield — if it reclaims its recent highs, that's the fundamental confirmation for a breakout attempt. If yields roll over, the dollar's CPI tailwind fades fast.
📌 Bottom Line
I'm neutral-to-bullish DXY above 99.10 on a daily close. The trade trigger is a 4H close above 99.95 with expanding volume — that opens 100.50, then 101.00–101.15. If 99.10 fails on a daily close, the structure breaks and 98.55–98.80 comes back into play.
CPI gave the fundamental excuse. Now the chart has to confirm.
This analysis is for educational purposes only and is not financial advice. DJI: Oil Breaks $100, Dow Loses 52,700 — Is the Uptrend Done?Brent just reclaimed $100 for the first time since July. The Dow responded by losing its short-term footing — and the structure is starting to crack. TVC:DJI
📉 The Setup
Wednesday's close at 52,380.66 (down 405 points, -0.77%) marked the Dow's third consecutive declining session. The S&P 500 and Nasdaq followed, closing at 7,636.36 (-0.48%) and 26,253.34 (-0.64%) respectively. The Dow's weekly decline has now reached roughly 1.9%.
But here's what caught my eye: this isn't a blanket risk-off move. Energy was the only S&P 500 sector to finish higher (+1.1%), while storage and semiconductor names linked to AI infrastructure demand held up well. Capital is rotating within the market — not exiting all risk at once. That tells me the Dow is bearing the brunt of the oil shock because of its industrial and financial weighting, not because the entire market is collapsing.
📊 Technical Outlook
The daily chart shows a clear rejection from the 53,064–53,174 resistance zone, followed by a breakdown below the 52,696–52,760 support area — a level that had previously acted as an important reaction zone.
The moving-average structure is beginning to weaken:
Short-term yellow moving averages are rolling over.
Price has moved below several short-term averages.
The longer-term cyan averages remain upward sloping — the broader trend hasn't fully reversed yet.
The rising white trendline remains the key medium-term structural reference.
My read: the immediate bias is bearish below 52,700–52,760. The longer-term trend is still alive, but it's on borrowed time if oil stays elevated.
🎯 Key Levels
Resistance:
52,972 — First recovery level and short-term pivot
53,064–53,174 — Major resistance and recent rejection zone
53,212–53,250 — Upper resistance and potential breakout zone
A sustained daily close back above 52,972 would reduce immediate downside pressure. A break above 53,064–53,174 is what's needed to restore a constructive bullish structure.
Support:
52,696–52,760 — Broken near-term support zone (now acts as resistance)
51,547 — Key 4H support and immediate downside target
50,513 — Major daily support and larger correction target
If the Dow fails to reclaim 52,696–52,760, sellers will likely target 51,547. A decisive break below that opens the door to 50,513.
⚠️ Risk View
The bearish setup isn't bulletproof. The longer-term moving averages are still upward sloping, and the rising white trendline hasn't been broken. If Brent pulls back below $100 — say, after a de-escalation headline or a softer CPI print — the Dow could reclaim 52,972 quickly and stabilize.
Also worth noting: markets are pricing roughly 60% odds of a 25-basis-point Fed hike by end of September, with August CPI landing Thursday. A soft CPI could shift that probability and give equities room to bounce.
🎯 Trading Bias
Below 52,700–52,760: Bearish continuation favored
Recovery above 52,972: Short-term stabilization possible
Break above 53,064–53,174: Bearish setup invalidated, bullish momentum may return
Break below 51,547: Opens path toward 50,513
Bottom line: The Dow is vulnerable while oil stays above $100 and Middle East tensions persist. The level to watch is 52,700 — whether price reclaims it or fails there will determine whether this develops into a deeper correction or only a pullback within the broader uptrend. I'm bearish below 52,700, but I'm not calling the trend dead — not yet.
ORCL: Investors Are Starting to Price the Cost of Growth?Oracle will report fiscal Q1 2027 earnings after the market close on September 10. Over the past year, ORCL has shifted from one of the market’s favorite AI infrastructure trades to a much more controversial name. Demand is no longer the main question. With RPO reaching $638 billion, customers are clearly committing to Oracle’s computing capacity. The key issue is how much Oracle must spend to convert those contracts into revenue and whether that growth can eventually generate enough free cash flow.
Fundamentals
Last quarter, Oracle’s revenue rose 21% year over year, while cloud revenue grew 47% and OCI infrastructure revenue surged 93%. Management guided for fiscal Q1 revenue growth of 27%–29%, cloud revenue growth of 58%–64%, and non-GAAP EPS of $1.72–$1.76. Wall Street expects revenue of roughly $19.1 billion and EPS near $1.74. Oracle is also maintaining its fiscal 2027 revenue target of around $90 billion.
The challenge is that growth is becoming increasingly capital-intensive. Oracle generated roughly negative $23.7 billion in free cash flow in fiscal 2026 and raised about $48 billion in financing. It also expects to raise roughly another $40 billion through debt and equity in fiscal 2027.
This creates the core tension in the Oracle story. Higher RPO improves long-term revenue visibility, but it also requires more data centers, power, and infrastructure spending today. Investors therefore need to see OCI remain strong while CapEx, financing needs, and cash-flow pressure begin to stabilize.
Technicals
ORCL is trading near the $160 area, more than 50% below its 2025 peak and down roughly 20% year to date. Much of the valuation premium attached to the earlier AI trade has already been compressed.
The first major upside level is around $170. A sustained move above that zone after earnings could confirm a broader recovery and open the door toward $180.
On the downside, $155 remains an important support area. A decisive break below that level would suggest that the market is still focused on financing and cash-flow risks, with the $145 area potentially becoming the next major support.
Flows
Positioning reflects a mix of long-term optimism and short-term caution. Most analysts remain constructive on Oracle’s long-term cloud and AI opportunity, but price targets vary widely. Some firms still see major upside, while others have become more conservative as concerns around CapEx, debt issuance, and funding costs increase.
That divergence shows how the debate has changed. Investors are no longer asking whether Oracle can grow. They are asking how much that growth should be worth given the capital required to support it.
The options market is pricing in roughly an 11% post-earnings move, suggesting that expectations for volatility are already high. A simple EPS beat may therefore not be enough. Investors will likely focus more on OCI growth, backlog conversion, CapEx discipline, and the path toward improving free cash flow.
Strategy
- Bullish: If OCI and cloud growth beat expectations, management maintains its roughly $90 billion fiscal 2027 revenue target, and provides a clearer path toward stabilizing CapEx and cash flow, a breakout above $170 could confirm an earnings-driven recovery. The next major upside area would be around $180.
- Neutral: If revenue and EPS are broadly in line but financing needs and free cash flow show little improvement, ORCL could remain range-bound between roughly $155 and $170. In that scenario, waiting for a clearer breakout would offer a better risk-reward profile than chasing strength.
- Bearish: If OCI growth disappoints or management raises CapEx and financing requirements again, even stronger RPO could be interpreted negatively if contract growth appears to be outpacing Oracle’s ability to monetize it efficiently. A break below $155 would weaken the structure and bring $145 back into focus.
The central question for Oracle has shifted. Investors are no longer debating whether AI demand is real. They are asking how much that growth will cost. If revenue conversion begins to catch up with infrastructure investment, ORCL could enter a meaningful valuation-recovery phase. If cash-flow pressure continues to worsen, however, even a massive backlog may not be enough to restore confidence. Micron Reclaims $1,000: Is a Second Leg Higher Beginning?Micron Technology (MU) is once again becoming one of the most interesting trading setups in the semiconductor space. On September 4, the stock gained 6.1% and closed at $1,016.59, reclaiming the psychologically important $1,000 level. More importantly, MU has broken above the $955–$970 area that repeatedly capped upside attempts in recent weeks, materially improving the short-term technical structure.
My current bias remains bullish, but the setup is very different from several months ago. MU has already rallied more than 240% this year and reached an all-time high near $1,255 in June. At this stage, the stock can no longer rely simply on the “AI + HBM” narrative to drive further gains. The next leg will require continued earnings delivery, while the recent breakout must also prove sustainable.
Fundamentals Still Support the Bulls
Micron’s latest earnings remain exceptionally strong. Fiscal third-quarter revenue reached $41.46 billion, while non-GAAP EPS came in at $25.11. Management also guided for approximately $50 billion in fourth-quarter revenue, an 86% gross margin, and non-GAAP EPS of around $31. HBM4 shipments are already ramping across major customers, while HBM4E is expected to move toward volume production in 2027.
AI infrastructure spending continues to support strong demand for high-bandwidth memory, while supply remains tight across several key memory categories. Micron is expanding capacity, but demand growth still appears to be running ahead of available supply. Strong pricing, higher volumes, and the increasing contribution from higher-margin HBM products are therefore keeping earnings expectations elevated.
The main risk comes from the cyclical nature of the memory industry. If capacity expansion eventually catches up with demand, today’s unusually strong pricing and margins could normalize quickly. For MU, the key question is increasingly whether earnings growth can continue to exceed expectations that are already extremely high. The next earnings report on September 30 will be an important test.
The $970 Breakout Changes the Setup
From a trading perspective, the most important recent development is the move through $970. Throughout late August and early September, MU repeatedly struggled around this level, while the broader $930–$960 range became an important consolidation zone. A decisive break above $970 was needed to confirm renewed upside momentum, and that condition has now been met.
MU has also pushed back above $1,000, suggesting that short-term buying pressure has strengthened. The next question is whether the $970–$1,000 area can now turn from resistance into support. If MU pulls back toward this zone and buyers defend it, the breakout would gain credibility and the stock could begin building a new trend leg rather than producing another short-lived momentum spike.
Around $1,035 may serve as an initial short-term reference point, but the more meaningful upside area is closer to $1,100. If momentum remains strong beyond that level, the June all-time high near $1,255 would eventually return to focus. On the downside, $935 remains an important support level. A move back below $970 followed by a break of $935 would significantly increase the probability of a failed breakout and weaken the bullish structure.
Trading Strategy: Let the Breakout Prove Itself
Despite the stronger technical picture, MU does not necessarily offer an attractive risk-reward profile for aggressive chasing after a large up day. For traders already holding the stock, the trend remains constructive as long as the $970–$1,000 zone continues to hold, with $1,100 as the next major upside area to monitor.
For traders considering a new position, two setups appear more attractive. The first would be a pullback toward $1,000 followed by renewed buying pressure, confirming that former resistance has turned into support. The second would be a short consolidation followed by another breakout above the recent high. Both provide clearer risk control than chasing immediately after a strong momentum candle.
Micron’s fundamentals remain exceptionally strong, and the move above $970 suggests that the technical picture is once again shifting in favor of the bulls. The next major test is whether $1,000 can hold as support. If that transition is confirmed, MU may have the foundation for a second major advance and, eventually, another attempt at its previous all-time high. EURUSD: GDP Says Resilient — But the Rate-Spread Trap Says Other📊 The Setup
EURUSD is pressing against the 200-day SMA at 1.1634, riding a wave of better-than-expected Eurozone GDP. The headline looks bullish. But the fundamental fuel behind this rally might already be running out.
🌍 Why Now
Eurostat dropped the final Q2 GDP reading on September 7 — 0.6% QoQ and 1.2% YoY, both upward revisions from the initial 0.4% / 1.0% estimates. The market read it as euro-positive, and EURUSD climbed toward 1.1620.
But dig into the numbers. Ireland's GDP surged 10.2% in the quarter — a multinational accounting distortion that accounts for most of the upside revision. Strip that out, and the core eurozone story is far less impressive: Germany grew just 0.3% YoY, France flatlined at 0%, Italy managed 0.2%. The "resilience" is largely an Irish artifact.
Meanwhile, the ECB is expected to deliver a second rate hike next week, lifting the deposit rate to 2.5%. Markets are pricing ~90% odds. That sounds hawkish — and it is. But here's the trap: the Fed is also priced for roughly 60 basis points of tightening over the same horizon.
📈 Core Thesis: The Differential Trap
The 2026 euro bull case was built on one assumption: the Fed would cut while the ECB held. Rate differential compression would mechanically lift EURUSD.
That assumption is dead. Both central banks are now tightening into the Iran war's inflation impulse. When both sides are priced for the same 60bps of hikes, the differential doesn't compress — it stays where it is. And when the mechanical basis for the bull case disappears, what's left is a range asset trading between its moving averages.
EURUSD has recovered from below 1.1408 in late July to test the 200-day SMA near 1.1634. The daily structure shows higher highs and higher lows, with price sitting above the 100-day SMA at 1.1572. But the 200-day is the line that separates a genuine breakout from a range extension.
Key levels:
Immediate resistance: 1.1634–1.1640 (200-day SMA)
Major resistance: 1.1711 (August 21 high)
Upside target: 1.1800
Near-term support: 1.1587–1.1613 (100-day SMA zone)
Major support: 1.1542
Critical downside: 1.1503
⚠️ Risk View
The bearish framing isn't airtight. If the ECB delivers a hawkish surprise next week and signals further tightening while the Fed pauses, the differential could still compress in the euro's favor. A daily close above 1.1640 would confirm renewed momentum and invalidate the range-trap thesis — at that point, 1.1711 and 1.1800 come into play.
On the flip side, if EURUSD fails at the 200-day and loses 1.1542 on a daily closing basis, the structure breaks. A confirmed breakdown opens the door to 1.1503, then the broader support at 1.1408.
🎯 Conclusion
My read: EURUSD is at a decision point where the technical setup looks constructive but the fundamental engine is stalling. The GDP headline flatters a eurozone economy that's barely growing once you strip out Ireland's distortion. And with both central banks tightening in lockstep, the rate-spread argument for a sustained breakout is weak.
Watch for a daily close above 1.1640 to confirm bullish continuation toward 1.1711–1.1800. If price rejects here and slips below 1.1587, the range-trap thesis is live — and 1.1542–1.1503 comes back into play. The ECB decision next week and US PCE on September 30 are the two catalysts that could break this either way. SNOW Jumps 17% After Earnings — Can the AI Re-Rating Continue?Snowflake’s latest earnings report reignited investor enthusiasm around cloud data and AI software. Fiscal Q2 revenue reached $1.55 billion, up 35% year over year and above the $1.48 billion consensus. Product revenue rose 37% to $1.49 billion, while adjusted EPS came in at $0.62 versus expectations of $0.45.
More importantly, Snowflake raised FY2027 product revenue guidance from $5.84 billion to $6.07 billion, implying roughly 36% growth. SNOW responded with a 16.55% post-earnings rally, closing at $356.47.
AI Starts to Deliver
The strongest part of the quarter was AI-driven demand. Management said AI contributed roughly half of the recent acceleration in growth. Products such as CoCo and CoWork are increasingly entering customer workflows, while CoCo added more than 2,000 accounts during the quarter.
AI workloads are also increasing usage of Snowflake’s core data platform. That matters because AI is beginning to move beyond narrative and into measurable consumption growth.
Product revenue growth has now accelerated for three consecutive quarters. For investors, this trend is more important than a one-quarter earnings beat because it suggests Snowflake may be entering a new period of stronger growth.
Valuation Is Expensive Again
The stronger outlook has pushed Snowflake back toward a premium valuation. With a market capitalization of roughly $123 billion, the stock trades at around 22 times trailing sales.
Consensus estimates put FY2027 total revenue near $6.3 billion and FY2028 revenue close to $8 billion, leaving SNOW at nearly 20 times FY2027 sales.
That valuation can still be supported if product revenue continues growing around 35% or faster while margins improve. However, the stock is no longer cheap. Further upside increasingly depends on Snowflake proving that AI can sustain stronger consumption growth rather than simply creating another temporary valuation expansion.
Technical Breakout
SNOW reached an intraday high of $384.55 after earnings, setting a new 52-week high before closing at $356.47. The long upper wick shows that profit-taking has already appeared near the highs.
The $355 area is now the first level to watch. Holding above this zone would keep the post-earnings breakout structure intact.
More important support sits around $330–$340, where the previous consolidation range and earlier highs overlap. A break below $330 would weaken the current bullish structure and raise the risk of a deeper retracement.
On the upside, $385 remains the key resistance level. A clean breakout above it could open the way toward $400 and potentially higher.
Trading Strategy
At current levels, SNOW offers a better risk-reward profile on a confirmed pullback than on an immediate chase after the earnings spike.
In the bullish scenario, the stock holds around $355 and later breaks above $385. That would confirm continued momentum, with $400 as the first major target.
In the neutral scenario, SNOW may consolidate between $340 and $385 as investors wait for further evidence of product revenue growth and AI-driven consumption.
In the bearish scenario, a break below $330 would suggest that investors are beginning to unwind part of the recent AI re-rating. In that case, protecting capital should take priority over buying the dip.
Snowflake’s fundamentals have clearly improved, but expectations have risen just as quickly. The key question is whether product revenue growth above 35% can be sustained.
As long as AI continues driving platform consumption and growth remains strong, Snowflake’s premium valuation can be justified. If growth starts to slow again, however, the current multiple leaves little room for disappointment. DXY: 99.95 Supply Wall vs. the 98.55 BounceDXY TVC:DXY Bounces From 98.55 — But Can the Rebound Survive the 99.95 Supply Wall?
The dollar just had its best bounce in weeks. Oil spiked above $91, 10-year yields hit their highest since January 2025, and Fed hike odds for September jumped to 66%. But here's the catch — DXY is running straight into a supply wall.
📊 Context: Why This Matters Now
DXY crashed to a three-month low of 98.80 on August 21 before rebounding above 99.50. The rally was fueled by surging oil prices above $91/barrel on renewed Middle East tensions, which pushed the 10-year Treasury yield to its highest level since January 2025. Markets now price a 66% probability of a September Fed hike — up from just 40% a week ago.
But the ADP report told a different story: only 44K private jobs added in July, the weakest in six months and well below the 70K forecast. With August ADP expected at 47K and NFP due Friday, the dollar sits at a crossroads — inflationary pressures pushing yields up, but a softening labor market capping the dollar's upside.
📉 Technical Structure: Rebound or Dead Cat?
The daily chart tells a clear story: medium and long-term moving averages are still sloping downward. Price sits below all major MAs. My read is this bounce is a correction within a downtrend — not a reversal.
🔴 Resistance Above:
99.73–99.95: Primary supply zone and the short-term bull/bear pivot. This is where trapped buyers from the prior breakdown sit.
100.07–100.27: 4H structural resistance + mid-term MA cluster.
101.60–101.80: Daily supply zone — the larger rebound target if 99.95 breaks.
🟢 Support Below:
99.44–99.35: First short-term support. Lose this and the bounce loses momentum.
98.55–98.80: The 4H/daily demand zone that launched this rebound. The line in the sand.
97.62: Next daily support if 98.55 fails.
🎯 Three Scenarios
Scenario 1 — Pullback then bounce: If DXY can't clear 99.73–99.95, expect a pullback to 99.35–99.28, possibly testing 98.80–98.55. If support holds with a bullish rejection candle and price reclaims 99.44, watch for another attempt at the supply zone.
Scenario 2 — Supply break: A 4H or daily close above 99.95 that flips to support would weaken the bearish structure, opening 100.07–100.27 and potentially 100.60+.
Scenario 3 — Support fails: A close below 98.55 means the bounce is dead. Price returns to the daily downtrend, with 97.62 as the next target.
⚠️ Risk View
The bearish thesis breaks if DXY closes above 99.95 on a daily basis and holds — that would signal the supply zone has been absorbed. Conversely, if NFP surprises strong, yields could surge further and push DXY through resistance. A weak NFP would likely send the dollar back to test 98.55. The Middle East situation remains fluid — any escalation in oil could extend the yield-driven dollar bid.
-
DXY is sitting between a short-term bounce and medium-term bearish pressure. Don't chase in the middle of the range. Wait for price to react at 99.73–99.95 resistance or 99.35 / 98.55 support before committing.
Trade plan: Hold 98.55 to stay bullish on the bounce. Below 99.95, manage risk as a rally into supply.
This analysis is for market observation and technical research only, not investment advice. Important Notice Regarding Monetary Authority of Singapore (MAS)Bitget is not licensed, approved, registered, authorized or in any other way regulated by the Monetary Authority of Singapore (“MAS”), and is not subject to supervision by MAS.
Bitget does not make its products or services available to, and does not solicit or target, persons in Singapore. Singapore is a restricted jurisdiction (being one of the listed “Prohibited Countries”) under Bitget's Terms of Use, and access to the Bitget platform from Singapore is restricted.
Nothing published by Bitget on its website, mobile applications, social media accounts or any other communication channel constitutes, or should be understood as, an offer, solicitation or invitation of any kind directed at persons in Singapore, or a representation that Bitget is licensed, approved, registered, authorized or regulated by MAS.
This notice is published for the information of all users and visitors, wherever located. If you have any questions about this notice, please contact support@bitget.com. DELL: Can AI Growth Keep Beating High Expectations?Dell Technologies is set to report FY2027 Q2 earnings after the close on September 1. Over the past few months, DELL has emerged as one of the strongest hardware names in the AI infrastructure trade. Shares hit a record high near $514 on August 13 before pulling back to $456.01 by August 31.
At this point, strong AI demand is already widely priced in. The real question is whether Dell can once again beat expectations that have risen sharply alongside the stock.
AI Servers Keep Driving Growth
Last quarter, Dell generated $43.8 billion in revenue, up 88% year over year. AI-optimized server revenue reached $16.1 billion, while AI server orders totaled $24.4 billion.
Management later raised its FY27 AI server revenue outlook to roughly $60 billion and lifted full-year revenue guidance to a midpoint of about $167 billion. AI infrastructure has clearly become the main driver behind DELL’s valuation rerating.
For Q2, Wall Street expects revenue of roughly $45.1 billion and non-GAAP EPS of around $4.91, with AI server revenue near $16 billion.
The problem is that for a stock that has already multiplied this year, simply beating headline revenue and EPS estimates may no longer be enough.
Margins Could Decide the Reaction
AI servers can generate massive revenue growth, but they also create an important profitability question.
GPUs represent a large share of total system cost, while Dell mainly captures value through system integration, supply chain management, and delivery. That means revenue growth does not always translate into equally strong profit growth.
ISG operating margin came in at 10.5% last quarter, while the market expects roughly 11% for Q2.
If AI server revenue remains strong but margins, cash flow, or full-year guidance disappoint, the stock could still sell off despite an apparent earnings beat. On the other hand, resilient margins, stronger AI orders, and another upward revision to the $60 billion AI server target could support another leg of rerating.
The four numbers that matter most are therefore clear: AI server revenue, AI orders and backlog, ISG margin, and FY27 AI server guidance.
Key Technical Structure
Technically, DELL is consolidating after reaching its $514 record high.
The first key resistance area sits around $470–472. A post-earnings move back above this zone would suggest the recent pullback is largely complete, putting $500–514 back in focus. A clean break above $514 would push the stock into fresh price discovery.
On the downside, $425 remains the key structural support.
A decisive break below that level would damage the current higher-low structure and force traders to reassess the strength of the broader uptrend.
Trade the Reaction, Not the Guess
This setup favors trading the post-earnings structure rather than trying to predict the report in advance.
If earnings, margins, and guidance all come in strong and DELL breaks above $472, the next target zone is $500–514.
If the report is broadly in line and shares remain trapped between $425 and $472, waiting for a confirmed breakout is the cleaner approach.
If AI orders, margins, or guidance disappoint and the stock loses $425, the short-term bullish structure has weakened and risk control should take priority.
For DELL, the key issue is now growth quality: how long AI infrastructure demand can remain this strong, whether margins can hold up, and whether management can keep raising expectations. Those three factors will likely determine the next major move. NAS100: $145B in AI Capex — But Where's the Revenue?The Nasdaq 100 is stuck. $700 billion in AI spending later, price is still chopping sideways around 29,457 — and the market is starting to ask the uncomfortable question. NASDAQ:NDX
📊 The Capex Reality Check
Meta just raised its 2026 capital-expenditure guidance to $130–145 billion. The market's response? Shares dropped 10% the day after the announcement. That's not a vote of confidence — it's the first real signal that investors are questioning whether this spending will ever convert into revenue.
And Meta isn't alone. Total AI-related capex across the major hyperscalers is on track for nearly $700 billion by 2026. The question is no longer whether AI is transformative. It's whether the bill arrives before the payoff.
⚠️ What the Chart Is Saying
NAS100 is trading around 29,457, sitting inside a broad consolidation with short- and medium-term moving averages compressed tightly around price. This kind of setup often precedes a volatility expansion — the market is coiling.
Key levels I'm watching:
Resistance:
30,182 — near-term range top
30,807 — bullish breakout target
Support:
29,155 — immediate, first line of defence
28,202 — major range support
27,190 — deeper downside if risk-off accelerates
The 29,155–30,182 band is the line in the sand. A confirmed daily break sets the next direction.
🎯 My Read
The fundamental backdrop — accelerating AI capex, unproven revenue conversion, and valuations above historical averages — leans cautious. Microsoft's cloud results show AI demand can translate into revenue. But the broader supply chain tells a different story: several AI infrastructure names have missed Q2 expectations, and lower-cost AI models are pressuring US tech pricing power.
Bullish case: A sustained daily close above 30,182 with stabilising earnings expectations could open the path toward 30,807. But that needs risk appetite to improve meaningfully.
Bearish case: Lose 29,155 and the consolidation structure cracks. A decisive break below 28,202 shifts focus to 27,190 — and the AI monetisation narrative becomes the catalyst, not just the backdrop.
Bottom line: NAS100 is range-bound, but the fundamentals underneath are deteriorating, not improving. I'm watching 29,155 as the trigger. Hold above it, and the range lives another day. Lose it, and the $700B AI capex story becomes the reason to break lower.
This analysis is for educational purposes only and does not constitute investment advice.
NVIDIA Reclaims 220 After Earnings: What Comes Next ?NVIDIA’s latest earnings once again came in well above market expectations. But what really drove the stock was not just the quarterly numbers already reported—it was the stronger signal management gave about future growth.
Earnings Reignite Growth Expectations
NVIDIA reported FY2027 second-quarter revenue of $96.2 billion, up 106% year over year. Data Center revenue reached $89.0 billion, up 117%, while non-GAAP EPS came in at $2.22. The company also guided for approximately $108 billion in revenue next quarter, above the market’s prior expectation of roughly $105 billion.
The only slightly cautious point was margins. NVIDIA expects non-GAAP gross margin of around 74% next quarter, down from 75% this quarter, as supply constraints and rising memory costs may continue to create pressure.
This also explains the sharp post-earnings volatility. NVDA initially fell around 1% after the release, but quickly reversed during the earnings call. Management indicated that FY2028 revenue growth could still reach roughly 70%, far above the market’s previous expectation of around 45%, helping push the stock as much as 4% higher.
The most important takeaway from this earnings report, therefore, is that the market is once again raising expectations for the durability of NVIDIA’s growth into 2027.
The Technical Structure Is Shifting
NVDA closed at $209.66 the day before earnings, down 1.59% from $213.05. After the report, overnight trading pushed the stock back toward $220, suggesting that the previous $209–213 area could now turn into short-term support.
The first major level to watch is $220–225. If NVDA can hold above this zone during regular trading hours, the post-earnings gap could evolve from a short-term sentiment-driven move into a more meaningful breakout.
Above that, the next resistance zone sits around $225–231. This area is close to both previous technical resistance and the upper end of the pre-earnings options-implied move. A high-volume breakout above $231 could reopen the path toward the 52-week high near $236.50.
On the downside, $213 is the first key level to watch. It was an important pre-earnings price pivot and now serves as the first line of defense for the post-earnings gap.
Below that comes the $209–210 zone. A move back into this area would mean the market has essentially erased most of the positive post-earnings reaction.
The more important medium-term support sits around $200–205. A decisive break below this zone would suggest that the earnings-driven repricing has failed and that the short-term trend is turning weaker again.
Post-Earnings Trading Strategy
For traders already holding long positions, $213 can be used as the first dynamic risk-control level. As long as NVDA stays above it, the post-earnings bullish structure remains intact, with $225–231 becoming the next breakout zone to monitor.
For traders looking to enter after earnings, chasing the overnight gap may not offer the best risk-reward. Two setups look more attractive.
The first is a pullback toward $220 that quickly attracts buyers and holds. The second is a confirmed, high-volume breakout above the $225–231 resistance zone. The former favors a pullback-entry strategy, while the latter is better suited to momentum traders.
If NVDA pushes into $225–231 but quickly reverses and falls back below $220, traders should be alert to a classic post-earnings gap-and-fade pattern. A further break below $213 would justify reducing short-term exposure, while a move below $209 would signal that the earnings breakout has largely failed.
At this stage, the key question is no longer whether NVIDIA delivered strong earnings. The more important question is whether $220 can become a new price platform.
If the stock holds above $220, $231 and $236.50 become the next upside targets. If it falls back below $213, however, the market may be returning to the familiar pattern seen in previous quarters: strong earnings, but limited follow-through in the share price. DJI: 2.3% From Highs — But the Real Risk Is in YieldsThe Dow TVC:DJI sits just 2.3% below its all-time high of 54,744, set on August 5. The rebound from the recent pullback looks convincing — DJI recovered above the 53,400–53,450 support zone and closed strongly higher. But underneath the bounce, the setup is more fragile than the chart suggests.
📊 Why This Week Matters
This is a three-collision week for the Dow. Core PCE lands Thursday (Aug 26) — and it's stuck at 3.3% YoY, well above the Fed's 2% target. Twenty-four hours later, Fed Chair Kevin Warsh delivers his first Jackson Hole keynote on Friday morning (Aug 28). And NVIDIA reports earnings Wednesday after close — a sentiment shock that spills into even the price-weighted Dow.
The technical structure says bullish. The fundamental backdrop says "not so fast."
📈 Technical Structure: The Bullish Case
On the daily chart, DJI remains constructive. Price holds above the rising medium-term moving-average cluster and the ascending trendline. Short-term moving averages are converging after the recent consolidation — a pattern that often precedes a directional breakout.
The pullback looks like a healthy reset, not a reversal. DJI is up +11.3% YTD and has defended the 53,330–53,430 zone on multiple tests.
Key Levels:
Support:
53,430–53,330: Immediate support and key horizontal pivot
53,050–52,950: Rising moving-average support
52,730–52,900: Major support — a break below invalidates the bullish structure
Resistance:
53,570–53,670: Near-term resistance from short-term MA cluster
54,000: Psychological resistance
54,400–54,800: Previous swing-high area; next upside target
My read: the technicals support a push toward 54,000 if 53,330 holds. A daily close above 53,670 would confirm the breakout from consolidation and open the door to a retest of the all-time high at 54,744.
⚠️ The Hidden Risk: Yields, Not the Chart
Here's what the chart doesn't show. DJI's price-weighted structure makes it more sensitive to yield-driven components — financials, industrials — than the Nasdaq. If Core PCE prints above 3.3% and Warsh uses his Jackson Hole debut to push back on market rate-cut pricing, the yield move could overwhelm the technical structure.
The risk isn't hypothetical. Treasury yields remain elevated, and Warsh's keynote is the marquee event of the symposium. A hawkish Warsh + hot PCE combination would test 53,330 harder than any technical pattern can defend.
NVIDIA earnings add another wrinkle: a strong report could lift Nasdaq but simultaneously push yields higher on growth optimism — a scenario that helps tech and hurts the Dow.
🎯 What to Watch
Bullish trigger: Daily close above 53,670 on softer-than-expected PCE → confirms breakout, targets 54,000 then 54,744 (ATH).
Bearish trigger: Warsh signals hawkish + PCE above 3.3% + daily close below 53,330 → invalidates the setup, targets 52,730 then 52,000.
Neutral zone: 53,330–53,670 — wait for the catalyst to resolve.
The bounce is real. But whether it survives depends on Warsh, not the chart.
This analysis is for educational purposes only and does not constitute financial advice.  Long
Long
Pelosi Bets on BE: Can AI Power Still Support the PremiumPelosi Bets on AI Power
Bloom Energy has returned to the spotlight after Nancy Pelosi’s latest family trading disclosure showed that her spouse purchased a total of 15,000 BE shares on July 24 and July 28, along with 200 call options with a $100 strike price expiring in June 2027.
Congressional trading activity itself is not an investment thesis, but the combination of a sizable equity position and long-dated deep-in-the-money calls has drawn fresh attention to BE’s core story: AI data centers are increasingly constrained by power availability.
Bloom’s solid oxide fuel-cell systems can be deployed directly near data centers, reducing reliance on lengthy grid expansion. Its agreement with Nebius, which includes plans to deploy 328MW of capacity this year, highlights this “time-to-power” advantage. As AI infrastructure expands faster than traditional power grids can respond, electricity is becoming a critical bottleneck in the AI investment cycle.
Explosive Growth, Expensive Valuation
Bloom’s recent results do support part of the bullish case. Q2 revenue reached $1.065 billion, up 165.5% year over year, while product revenue increased 215%. Non-GAAP gross margin rose to 34.3%.
The company also raised its 2026 revenue guidance to $3.9–4.2 billion and expects non-GAAP EPS of $2.55–2.85.
The problem is valuation. At around $204 per share, Bloom carries a market capitalization of nearly $60 billion, implying roughly 15x the midpoint of its 2026 revenue guidance and more than 70x forward earnings based on the midpoint of its EPS outlook.
Even with revenue nearly doubling, that remains an aggressive growth valuation. The key question has therefore shifted from whether AI power demand exists to whether Bloom can grow fast enough to justify what is already priced in.
$185 Becomes the Key Line
BE has fallen more than 40% from its June 25 peak of $351.28. On August 24, shares traded as low as roughly $186 before recovering to close at $204.02, suggesting that the $185–195 area is beginning to attract buyers.
The first resistance zone sits around $220–230, followed by a heavier supply area near $240–253. A sustained move above $220 with improving volume would suggest that the correction since July is entering a recovery phase, opening the door to another test of $240–250.
For more aggressive traders, stabilization near $190 could offer a small starter position, while $185 should be treated as an important invalidation level.
A decisive break below $185 would suggest that the recent sentiment boost is insufficient to reverse the downtrend, with $160–165 becoming the next area to watch.
Bloom’s AI power thesis remains compelling, but at the current valuation, the next leg higher will depend increasingly on execution. Orders, revenue growth and profitability now need to keep catching up with the story. XAUUSD: Treasury Buybacks, Not ETFs, Drive Gold's Rally📊 The Setup
Gold hit a three-month high at $4,677 on Monday, up 1.6% on the day and more than 5% on the week. The headline everyone's running with: gold-backed ETFs pulled in $6.4 billion last week — 46.7 tonnes, the biggest weekly inflow in 10 months. But that's the symptom, not the cause.
🌍 Why Now
On August 19, Treasury Secretary Scott Bessent quietly announced the Treasury would more than double its bond buyback operations — from $2B to at least $4B per operation — targeting the 10-to-30-year maturity segment where a buyers' strike had pushed the 30-year yield to its highest since 2007. That's the structural engine behind softer long-end yields and a weaker dollar. Gold broke above its 200-day MA last week, confirming the technical shift. This week brings two catalysts that could accelerate or break the move: Core PCE on Wednesday and Fed Chair Kevin Warsh's debut Jackson Hole keynote on Friday.
📈 Core Thesis
My read: the Treasury's doubled buyback program is effectively stealth QE. By absorbing supply in the long end after a failed auction, it suppresses yields and pressures the dollar — both direct tailwinds for gold. The $6.4B ETF inflow confirms institutional positioning, but institutions are reacting to the same structural driver, not creating it.
The deeper pattern: when a government needs its own central bank's posture to help manage borrowing costs, that's the structural backdrop that makes gold — a store of value outside the currency system — worth holding, not just trading around. RSM's chief economist argued the buybacks undermine the Fed's inflation control; JPMorgan warned the intervention "belies underlying structural challenges." The Treasury-Fed tension is now explicit.
Technically, gold has cleared the 200-day MA and is testing the $4,680–$4,700 zone — the May 14 highs. A sustained break opens the path toward $4,775, where the 2026 downtrend's lower-highs line also converges. ETF flows are on track for a seventh consecutive week of net inflows (World Gold Council), and central bank buying recovered sharply in Q2.
⚠️ Risk View
Here's what could go wrong. If Wednesday's Core PCE accelerates beyond the expected 0.2% MoM, or if Warsh delivers a hawkish surprise — renewed emphasis on the 2% inflation commitment, validation of the three dissenting FOMC hawks — this flow-driven rally can reverse quickly. Systematic strategies tend to cut exposure at specific price levels when rate expectations shift, meaning volatility could spike even if the bigger inflation story barely changes. First support sits at $4,600, then the 200-day MA and breakout zone.
🎯 Key Levels
Resistance: $4,680–$4,700 (May 14 highs) → breakout target $4,775
Support: $4,600, then 200-day MA / breakout zone
Bias: Bullish while price holds above $4,600 and the 200-day MA
Trigger: Dovish Warsh + soft PCE → $4,700 breaks
Invalidation: Hot PCE or hawkish Warsh → pullback to 200-day MA
This analysis is for educational purposes only and is not financial advice.  Long
Long
MSTR Surges 20% in 2 Days: Is the Bitcoin High-Beta Trade Back?Why Did MSTR Suddenly Surge?
Bitcoin remains the primary driver.
After the U.S. Treasury increased long-duration Treasury buybacks, pressure in the long end of the bond market eased somewhat, which investors interpreted as a marginal improvement in liquidity conditions. Meanwhile, the Trump administration continued to push for more crypto-friendly regulation, while the SEC recently proposed a more flexible framework for token financing. These factors helped Bitcoin regain the $70,000 level and lifted crypto-related stocks broadly.
For MSTR, Bitcoin matters far more than it does for most crypto equities. Strategy currently holds more than 840,000 BTC at an average purchase price of roughly $75,000. With Bitcoin recovering from around $60,000 to above $70,000, pressure from unrealized losses has been reduced sharply.
If Bitcoin moves decisively above Strategy’s average cost basis, concerns over the company’s balance sheet and financing capacity could ease further. MSTR’s strong outperformance over the past two sessions already suggests that investors are assigning the stock a higher Bitcoin beta again.
mNAV Is the Real Key
MSTR can outperform Bitcoin because the stock is driven by two layers of leverage: the value of its BTC holdings and the premium investors are willing to pay over that underlying asset value.
During Bitcoin selloffs, both factors can move against the stock. Strategy’s BTC holdings lose value while its mNAV premium contracts, which explains why MSTR often falls much faster than Bitcoin.
Now that process is starting to work in reverse.
As BTC has rebounded above $70,000, Strategy’s underlying asset value has recovered. If Bitcoin continues higher and investors expand MSTR’s mNAV premium again, the stock could once more deliver two-times or even greater sensitivity to BTC moves.
That is the main reason MSTR has risen much faster than Bitcoin over the past two sessions.
The Financing Flywheel Has Not Fully Returned
MSTR is still some distance from the strongest version of its previous financing flywheel.
Strategy has continued to raise capital through equity issuance, but it has not used the proceeds to buy Bitcoin at the same aggressive pace. Management currently appears more focused on cash reserves, preferred-stock dividends, and debt obligations.
Investors will therefore focus on one important metric: whether BTC per share can continue to rise despite ongoing dilution.
If a higher share price improves financing efficiency and allows Strategy to increase BTC per share, the old positive feedback loop could return: higher stock price, new capital raising, more Bitcoin purchases, a larger asset base, and potentially a higher valuation.
If issuance mainly increases dilution without improving BTC per share, it will be much harder for MSTR to regain the extreme mNAV premiums seen in previous bull-market phases.
Technical Setup: $110 Is the Key Pivot
After two consecutive large gains, MSTR has broken above its previous $90–$100 consolidation range and moved back above $110.
The first level to watch is $110, now an important short-term reference point. As long as MSTR holds above this area, the rebound structure remains intact. The next major upside zone is around $120–$125, which represents a more important hurdle for a broader trend reversal.
On the downside, $104–$105 is the first major support area, roughly corresponding to the August 19 breakout level. A quick move back below $100 would suggest that the current high-beta trade is losing momentum.
Still Buyable After a 20% Two-Day Rally?
MSTR’s short-term structure has improved significantly, but a gain of more than 20% in two sessions also makes chasing the stock riskier.
If Bitcoin continues holding above $70,000 and breaks through the $75,000 area, the probability of MSTR testing $120–$125 would rise materially. If BTC then resumes a broader move toward $80,000, MSTR could remain one of the highest-beta names in the crypto equity space.
The downside is equally clear. If Bitcoin falls back below the $68,000–$70,000 area, MSTR could see a much sharper pullback as falling BTC prices and mNAV compression hit the stock at the same time.
From here, the two most important signals are whether Bitcoin can break above Strategy’s average BTC purchase price, and whether MSTR’s mNAV can continue to expand. If both improve together, the current rally has a better chance of evolving from an oversold rebound into a new high-beta trend. USDJPY: Intervention Fades, Carry Trade Doesn't — Why 159 Holds USDJPY FX_IDC:USDJPY has reclaimed 159 in under two weeks after joint US-Japan intervention slammed the pair from 164 to 155. That's half the intervention rally erased in record time. The message from the market is clear: you can weaponize the yen, but you can't kill the carry trade.
On August 2, Japan and the US executed their first coordinated yen-buying operation since 1998, reportedly through the EUR/JPY cross, backed by both Treasury Secretary Bessent and Japan's MoF. The pair hit a 40-year high near 164, then crashed to 155. Two weeks later, it's back above 159. The speed of that recovery tells you everything about who's really in charge.
🌍 Why This Matters Now
The problem isn't speculation. It's structural.
The BOJ raised its policy rate to 1.0% in June — the highest since 1995 — but held steady in July. Even with two board members pushing for faster hikes and markets pricing a September move, Japan's borrowing costs remain a fraction of US rates. The yield gap that fuels the carry trade hasn't closed.
Three forces keep USDJPY bid:
US Treasury yields stay elevated, keeping the dollar attractive
Japan's trade deficit widened sharply in July as record crude oil imports overwhelmed strong AI-chip exports — a structural yen drain
JGB 10Y yields hit 2.945% on Aug 18, a 30-year high, but rising US yields offset the narrowing
Intervention raised the cost of shorting the yen. It didn't remove the incentive. Until the BOJ closes the yield gap decisively — or US yields break lower — the carry trade has a floor under USDJPY.
📊 Technical Setup
On the daily chart, USDJPY is stabilizing around 158.80–159.00 after the intervention-driven flush. Price holds above the rising long-term trendline near 157.20–157.50 — the structural backbone of the broader bull trend.
But price sits below a cluster of short- and medium-term moving averages. Upside momentum needs confirmation.
🎯 Key Levels
Resistance:
159.15 — Immediate recovery zone; a daily close above strengthens the bull case
160.60–161.05 — Major MA resistance cluster
163.00–164.00 — Previous highs and intervention-sensitive zone
Support:
157.20–157.50 — Rising trendline; the line in the sand
156.00–156.50 — Secondary support
155.00 — Post-intervention low
⚠️ Risk View
The bullish thesis breaks if USDJPY loses the trendline at 157.20. A daily close below opens the path toward 156.00 and potentially 155.00 — the post-intervention low.
The bigger risk is political, not technical. Japanese authorities have signaled willingness to intervene again near 160, and with US backing, that ceiling is real. Traders should respect 160 as an increasingly sensitive level — chasing into that zone is asking for another coordinated slap.
There's also a genuine fundamental risk: if the BOJ delivers a September hike and signals faster normalization, the yield gap could narrow faster than expected. JGB yields at 30-year highs suggest the market is already pricing this in.
🎯 Bottom Line
USDJPY remains fundamentally supported as long as the US-Japan yield gap stays wide. Buy dips toward 157.20–157.50 with the trendline as your invalidation. Respect 160 as the intervention ceiling. The setup isn't about calling new highs — it's about recognizing that intervention changed the speed, not the direction.
This analysis is for educational purposes only and does not constitute financial advice. AMAT Rebounds 5.5%: Is the Correction Over?Capital Starts to Return
Applied Materials rose 5.5% to $535.31 on Monday, quickly recovering much of its post-earnings decline. The stock had previously fallen more than 25% from its June 30 high of $739.67, as stretched expectations across AI-related semiconductor equipment names underwent a meaningful reset.
Wall Street has also started reassessing the pullback. On August 17, Berenberg raised its AMAT price target from $575 to $675 while maintaining a Buy rating. FactSet’s current average target is around $658. Post-earnings analyst revisions have generally remained constructive, with JPMorgan, Goldman Sachs and Bernstein all assigning price targets above $600.
AI Equipment Cycle Remains Strong
AMAT’s biggest fundamental support continues to come from the expansion of AI capital spending into semiconductor manufacturing. The company expects advanced packaging revenue to grow more than 70% in 2026, while DRAM now represents 26% of Semiconductor Systems revenue. Customer discussions around equipment demand are also beginning to extend as far as 2030.
The key debate is whether AMAT can outperform the broader semiconductor equipment cycle. LSEG data shows the stock trading at roughly 32x forward 12-month earnings, below Lam Research, KLA and ASML at around 33–37x. That discount reflects lingering concerns over relative growth and competitive positioning, while also leaving room for valuation expansion if earnings expectations continue to rise.
$500 Becomes the Key Battleground
Technically, AMAT briefly fell toward the $500 area after earnings before rebounding to around $535. The $500–510 zone has now become the most important near-term support area. On the upside, the first hurdle is around $540, followed by the August 13 high of $563.75.
If AMAT holds above $500 and breaks through $560–565, the current correction could transition into a broader recovery, with $600 becoming the next major target. A break below $500 would weaken the rebound structure and suggest that the market still needs more time to digest the valuation pressure created by the earlier AI-equipment rally.
For now, I view AMAT as a watch-list long after a major pullback: use $500 as the risk line, $560 as the confirmation level, and consider increasing exposure only after a confirmed breakout. AMAT Rebounds 5.5%: Is the Correction Over?Capital Starts to Return
Applied Materials rose 5.5% to $535.31 on Monday, quickly recovering much of its post-earnings decline. The stock had previously fallen more than 25% from its June 30 high of $739.67, as stretched expectations across AI-related semiconductor equipment names underwent a meaningful reset.
Wall Street has also started reassessing the pullback. On August 17, Berenberg raised its AMAT price target from $575 to $675 while maintaining a Buy rating. FactSet’s current average target is around $658. Post-earnings analyst revisions have generally remained constructive, with JPMorgan, Goldman Sachs and Bernstein all assigning price targets above $600.
AI Equipment Cycle Remains Strong
AMAT’s biggest fundamental support continues to come from the expansion of AI capital spending into semiconductor manufacturing. The company expects advanced packaging revenue to grow more than 70% in 2026, while DRAM now represents 26% of Semiconductor Systems revenue. Customer discussions around equipment demand are also beginning to extend as far as 2030.
The key debate is whether AMAT can outperform the broader semiconductor equipment cycle. LSEG data shows the stock trading at roughly 32x forward 12-month earnings, below Lam Research, KLA and ASML at around 33–37x. That discount reflects lingering concerns over relative growth and competitive positioning, while also leaving room for valuation expansion if earnings expectations continue to rise.
$500 Becomes the Key Battleground
Technically, AMAT briefly fell toward the $500 area after earnings before rebounding to around $535. The $500–510 zone has now become the most important near-term support area. On the upside, the first hurdle is around $540, followed by the August 13 high of $563.75.
If AMAT holds above $500 and breaks through $560–565, the current correction could transition into a broader recovery, with $600 becoming the next major target. A break below $500 would weaken the rebound structure and suggest that the market still needs more time to digest the valuation pressure created by the earlier AI-equipment rally.
For now, I view AMAT as a watch-list long after a major pullback: use $500 as the risk line, $560 as the confirmation level, and consider increasing exposure only after a confirmed breakout. Gold Up 10% in August — Can Fed Minutes Unlock $4,450?📊 Gold TVC:GOLD just had its best week since January.
After plunging roughly 18% from its January record near $5,600, the metal has roared back to the $4,400 area — up about 10% this month alone. The selloff is over. The question now is whether the next leg higher can break through.
🌍 Two catalysts converge this week.
First, Fed minutes from the July 28-29 meeting drop on Wednesday, August 19. Markets have already slashed September rate-hike odds to roughly 40% after July nonfarm payrolls fell 23,000 — a 100K+ miss versus expectations for a gain of 80,000. Second, Jackson Hole looms August 27-29, where Fed Chair Kevin Warsh delivers his first keynote as chair. Both events could either fuel or stall gold's momentum.
Meanwhile, the Middle East remains a live risk premium. Israel struck Lebanon over the weekend, and Trump is preparing new sanctions on Iran. China's central bank added approximately 20 tonnes of gold in July — its 21st consecutive month of purchases. The structural bid underneath gold hasn't gone anywhere.
📈 On the daily chart, gold bottomed after its sharp correction from the January highs and has since reclaimed its short- and medium-term moving averages. The MA structure is now turning higher.
The key breakout came when gold pushed through the previous moving-average resistance cluster at $4,135-$4,158. That zone has flipped from resistance into support. More importantly, gold is holding above the 78.6% Fibonacci retracement at $4,343 — the level that now acts as the primary bullish pivot.
This isn't a V-shaped chase. Gold has been consolidating near the highs after the breakout, which is constructive price action. The market is using time to absorb profit-taking while maintaining its elevated range.
Fibonacci support framework:
$4,343 (78.6%) — primary bullish pivot
$4,260 (61.8%) — secondary support
$4,202 (50%) — momentum warning zone
$4,145-$4,158 (38.2% + MA cluster) — medium-term confluence
As long as gold holds above $4,343, the daily structure favors continuation over reversal.
⚠️ The flip side: gold is approaching near-term resistance at $4,436-$4,450, marked by recent swing highs and a psychologically significant round number. If price repeatedly fails to clear $4,450 and drops back below $4,343, the setup weakens and a deeper retracement toward $4,260 becomes the more likely path.
The Fed minutes cut both ways. Dovish minutes reinforce the lower-rate narrative and support gold. But if the minutes reveal a more hawkish tone than the market currently prices, the dollar could bounce and pressure gold back toward support.
🎯 My read: the broader bias stays bullish as long as $4,343 holds. The setup favors buying pullbacks into support rather than chasing strength at resistance.
Bullish framework:
Primary support: $4,343-$4,330
Invalidation: sustained daily break below $4,202
First target: $4,436-$4,450
Breakout targets: $4,500, then $4,550-$4,600
A confirmed daily close above $4,450 — especially if fueled by dovish Fed minutes — would signal the next leg higher is underway. Until then, patience on pullbacks is the better trade. Long 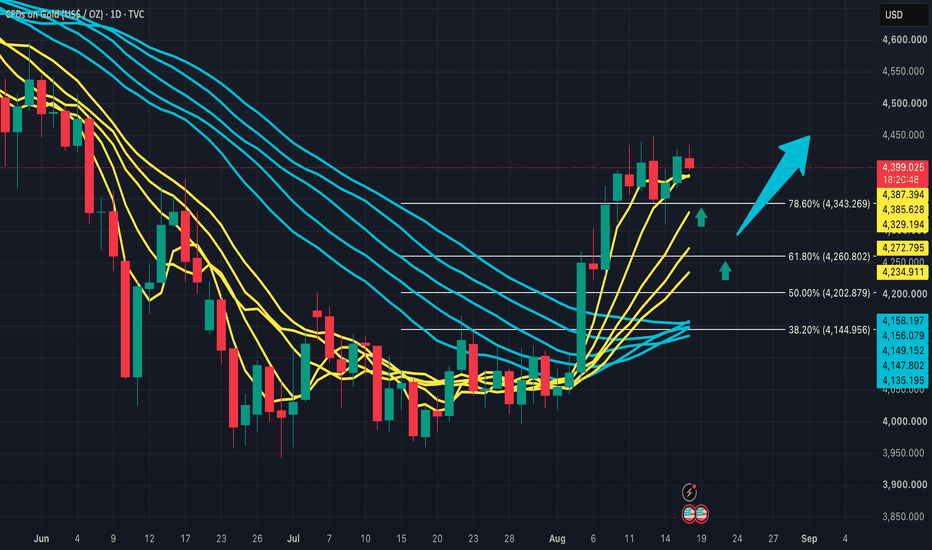
NBIS Surges 34%: Can It Break $300?Nebius surged 34% in a single session after its Q2 earnings, shifting the market’s focus from whether AI cloud demand is real to whether this level of growth can be sustained. The results clearly strengthened the fundamental story, but the sharp move was also amplified by short covering. The key question now is whether this marks the start of a new trend or simply a high-level consolidation after a one-off repricing.
1. Q2 Changed the Story
Q2 revenue reached $582.3 million, up 454% year over year, with AI Cloud contributing $574.9 million and ARR rising to $3 billion. Adjusted EBITDA jumped to $236.2 million, a major inflection from a $21 million loss a year earlier. More importantly, Nebius expects more than $9 billion in customer prepayments in 2026 and has secured over $40 billion in customer commitments.
This matters because customers are now paying in advance for future compute capacity. That not only validates demand but also reduces some of the pressure to fund expansion entirely through external financing.
The 34% rally, however, was not driven by fundamentals alone. Short interest was close to 30% of the float at the end of July, so the earnings surprise triggered aggressive covering. The move should therefore be viewed as a combination of fundamental repricing and a short squeeze.
2. What to Expect Next
Customer commitments are not the same as recognized revenue. Nebius spent roughly $5.7 billion on capital expenditures in Q2 and raised its year-end 2026 contracted power target to 5 GW, while planning to add more than 1 GW of capacity annually from 2027.
The next few quarters will test whether data centers come online on schedule, GPU and power supply remain available, customer commitments convert into revenue, and margins can hold up during aggressive expansion. Q2 reduced uncertainty around demand, but it also shifted the main risk toward execution and capital efficiency.
3. Technical Setup and Trading Strategy
NBIS closed at $259.20 after earnings, pushing the stock back into its June high zone. The $250–260 area is the first key support. If the stock can hold this zone on a pullback, it would suggest the market is accepting a higher valuation range. Around $275 is the next intermediate resistance, while $290–300 is the major overhead zone, with the 52-week high at $299.86.
From a trading perspective, holding $250–260 and breaking above $275 would keep the path toward $290–300 open. If the stock consolidates near current levels, waiting for a higher low may offer a better setup than chasing the initial surge. If NBIS falls back below $250 and continues to weaken, the risk of a post-earnings gap fill would increase, with the $220 area becoming the next level to watch. EURUSD: Soft CPI , Wait for Breakout — MA CompressionEURUSD: Soft CPI , Wait for Breakout — MA Compression
The July CPI report delivered exactly what EUR bulls wanted — headline inflation easing to 3.4%, core CPI down to 2.5%, and traders slashing September rate-hike odds to 42%. Yet EURUSD barely held its gains before reversing lower. When a bullish catalyst fails to produce a bullish reaction, that tells you something.
📊 The Setup
EURUSD FX_IDC:EURUSD is trading near 1.1522, trapped inside a tightening 42-pip range between 1.1503 and 1.1545 after failing to sustain its push toward 1.1563. On the 4-hour chart, the moving averages have converged to their tightest spread in weeks — a classic compression structure that typically precedes a volatility expansion.
The pair is sitting at a decision point. The compression won't last.
🌍 Why Now
The CPI data was supposed to be the catalyst. It wasn't. Headline inflation cooled to 3.4% (down from 3.5%), core eased to 2.5% (down from 2.6%), and energy prices dropped 1.5% in July — all in line with consensus. The market response was muted: Treasury yields fell, Fed-hike probability dropped to 42%, yet the Dollar Index held firm near the key 100 level, supported by persistent geopolitical risk and safe-haven flows.
The next round of catalysts — US PPI, Eurozone inflation prints, and EU industrial production — may finally force the range to break.
🎯 Key Levels & Scenarios
Bullish trigger: A sustained 4H close above 1.1545 reopens the path toward 1.1563 and the 1.1600 psychological zone.
Bearish trigger: A confirmed 4H close below 1.1503 invalidates the near-term bullish structure, targeting 1.1480 and 1.1450.
⚠️ Risk View
The compression setup is directionally neutral — it tells you a move is coming, not which way. A reclaim of 1.1545 without follow-through would suggest another false breakout. Conversely, a breakdown below 1.1503 on low volume may lack conviction. Watch for the close, not the wick.
EURUSD is coiled. CPI failed to break the range, but MA compression says the real move is still ahead. The trade is not to anticipate — it's to wait for the 4H close outside 1.1503–1.1545 and follow the direction.
This analysis is for educational purposes only and does not constitute financial advice.