USDJPY – Waiting for the Bank of Japan!Given the magnitude and importance of the central bank events taking place this week, FX traders could be forgiven for struggling to sleep at night as they process the possible permutations of what key interest rate decisions from the Federal Reserve (Fed) and the Bank of Japan (BoJ), alongside any comments provided by Fed Chair Kevin Warsh and BoJ Governor Kazuo Ueda on inflation, rising bond yields and future rate moves could mean for the direction of USDJPY into the Friday close.
After a sharp sell off from 160 at the end of August down to a low of 152.89 (September 8th), perhaps unsurprisingly, USDJPY prices squeezed back above 155.00 again yesterday as traders squared weak shorts ahead of last night’s Fed decision. Then on hearing the US central bank had decided to hike interest rates 25 bps (0.25%) for the first time in 2026 and indicated they could be prepared to move again before the end of the year, USDJPY prices squeezed all the way up to a high of 156.42 before drifting back to trade at current levels around 155.95 (0630 BST).
Now, looking forward, traders have that nervous 24 hour wait to hear the outcome of tomorrow’s BoJ rate meeting (0400 BST). Expectations are for the BoJ to raise rates again, but after last night’s update from the Fed, traders may be looking for something extra from Governor Ueda to reignite the recent USDJPY downtrend or risk a nasty squeeze back up to test higher resistance levels.
Technical Update: USDJPY – Normal Pullback or More Sustained Rally?
In our USDJPY update on September 7th, we highlighted the formation of a potential Head and Shoulders top, with closing breaks below the neckline support possibly leading to further price weakness (see our commentary timeline for full details).
As can be seen in the daily chart above, subsequent price action has seen the neckline support broken to the downside on a closing basis, and while not a guarantee of extended weakness, this move suggests the potential for a negative shift in USDJPY sentiment. However, as also shown in the chart, price action this week has seen a recovery develop, bringing USDJPY back above the neckline of the reversal.
It’s common in technical analysis to see a rally or pullback after completion of a Head and Shoulders top, before fresh declines materialise. However, after this week’s rally, traders may be wondering if last night’s Fed announcement and subsequent price strength, could be ending the threat of the reversal pattern, or if it’s just a limited rally within a developing downtrend, before fresh price weakness is seen again.
Ahead of tomorrow’s Bank of Japan rate decision, reassessing the technical backdrop and identifying some key support and resistance levels to monitor may prove useful in establishing the next directional themes for USDJPY.
If this is a Normal Limited Pullback to the Reversal:
If the latest price strength is to prove a normal pullback to the Head and Shoulders top before fresh price declines are seen, USDJPY upside may be limited, shifting focus to lower support levels.
The first key support to focus on may be 154.66 (half of the latest recovery). Closing breaks below this level could suggest the latest price strength is a limited move higher, before fresh USDJPY price weakness and tests of longer‑term support levels are seen again.
As the weekly chart above indicates, closes below 154.66 could lead to further downside momentum, opening potential to test 152.89 (September monthly low), then 151.96 (50% retracement of April 2025 to July 2026 strength), and possibly even 149.12 (61.8% retracement).
If a More Extended Price Recovery is to Develop:
It is equally possible following last night’s Fed announcement that a more extended USDJPY recovery could materialise. If this is the case, current price strength could challenge the first potential resistance level at 156.62 (50% retracement of September weakness).
Closing breaks above 156.62 could question the validity of the Head and Shoulders reversal pattern and indicate risks of moves toward higher resistance levels. This could open the way for tests of 157.50 (61.8% retracement) and, if closing breaks above this level are seen, on toward 160.39 (September 2nd high).
The material provided here has not been prepared accordance with legal requirements designed to promote the independence of investment research and as such is considered to be a marketing communication. Whilst it is not subject to any prohibition on dealing ahead of the dissemination of investment research, we will not seek to take any advantage before providing it to our clients.
Pepperstone doesn’t represent that the material provided here is accurate, current or complete, and therefore shouldn’t be relied upon as such. The information, whether from a third party or not, isn’t to be considered as a recommendation; or an offer to buy or sell; or the solicitation of an offer to buy or sell any security, financial product or instrument; or to participate in any particular trading strategy. It does not take into account readers’ financial situation or investment objectives. We advise any readers of this content to seek their own advice. Without the approval of Pepperstone, reproduction or redistribution of this information isn’t permitted. AI Wobble Leaves US 100 Sentiment on a Knife EdgeIts already been a tough start to the week for technology stocks in the US 100 index as traders reacted negatively on Monday to the shock proposal made over the weekend by influential Anthropic CEO Dario Amodei, who urged the AI industry to slow the development of its most advanced models in order for adequate guardrails to be put in place, comments further supported by Sam Altman of OpenAI and Elon Musk.
The fallout saw chipmaker stocks within the US 100, leading the index down from a close at 29370 on Friday to a low of 28804 yesterday afternoon, a drop of 1.9% before some fresh demand resurfaced. Chipmakers were hit especially hard on concerns that a slowdown in AI development could lead to a reuction in AI capital expenditure which has been the major factor driving their value to numerous record highs.
If this wasn’t enough of a challenge for stock traders to negotiate this week, sentiment remains on a knife edge ahead of the Federal Reserve (Fed) interest rate decision, which is due for release on Wednesday at 1900 BST. Economists and investors are divided on whether the Fed decides to hike rates for the first time in 2026 to stem the immediate threat from rising inflation or keep rates unchanged to allow policymakers to analyse another month of key data readings. As a rule, Fed rate hikes tend to weigh on technology/growth stocks in the US 100 index as it makes borrowing more expensive.
Whatever the Fed decides, the press conference, which commences at 1930 BST on Wednesday, could also be a volatility flashpoint for US 100 prices, as traders respond to Fed Chair Kevin Warsh’s comments on inflation and future rate moves into the end of 2026.
Technical Update: Decision Making Process Develops:
The technical picture for the US 100 index continues to reflect an uncertain sentiment backdrop, with the latest upside recovery failing at 30246 (August 17th high), still well below the June 1st all-time high at 30656. Some traders may view this price action as a weak test of the previous 30656 extreme, which could be a negative for future directional moves.
However, as the chart above shows, since mid‑August prices have traced out a period of sideways movement between 28873 (August 24th low) and 29749 (August 28th high). This type of more balanced activity may be viewed as a decision‑making process, with a closing breakout from the price range required to suggest where the next directional risks could lie.
Potential Support Levels:
With 28873 (August 24th low) potentially marking the lower extreme of the current sideways trading range, this level may be viewed as the first key support. Closing breaks below 28873, if seen, could develop the possibility of negative momentum reemerging.
Closing breaks below 28873 could suggest the decision‑making process has been resolved to the downside, resulting in further price weakness and tests of support at 27050 (July 29th low). Closing breaks below 27050 could open potential for moves toward 26714 (50% Fibonacci retracement of the March 31st to June 1st strength), even 25830 (61.8% retracement).
Potential Resistance Levels:
Currently the sideways price range still remains intact, with the upper extremes potentially marked by resistance at 29749 (August 28th high). Therefore, if this sideways activity is to be resolved in a positive way, it may be reflected by closes above 29749, which could lead to further attempts at price strength.
Closes above 29749, if seen, could lead to further price upside momentum to challenge the August 17th high at 30246. If this level were also broken on a closing basis, price moves could extend toward the June 1st all‑time high at 30656.
The material provided here has not been prepared accordance with legal requirements designed to promote the independence of investment research and as such is considered to be a marketing communication. Whilst it is not subject to any prohibition on dealing ahead of the dissemination of investment research, we will not seek to take any advantage before providing it to our clients.
Pepperstone doesn’t represent that the material provided here is accurate, current or complete, and therefore shouldn’t be relied upon as such. The information, whether from a third party or not, isn’t to be considered as a recommendation; or an offer to buy or sell; or the solicitation of an offer to buy or sell any security, financial product or instrument; or to participate in any particular trading strategy. It does not take into account readers’ financial situation or investment objectives. We advise any readers of this content to seek their own advice. Without the approval of Pepperstone, reproduction or redistribution of this information isn’t permitted. Oil (WTI) – No Rest From Unscheduled Headline Driven VolatilityFor Oil (WTI) traders, rarely does a day go by without a fresh headline hitting their screens about the constantly changing geopolitical situation in the Middle East which could generate further volatility for prices. Weekends can be particularly challenging with a lot of conflicting information for traders to digest and then assess to determine whether prices open near to Friday’s closing levels or gap higher or lower. This weekend was no exception.
Fighting has intensified and broadened across the Middle East region in recent days as Iran backed Houthi rebels step up drone attacks on Saudi Arabian energy infrastructure in an attempt to seal off an important oil pipeline toward the Red Sea, a supply channel that has reached its full capacity of around 7 million barrels per day while the Strait of Hormuz has remained closed to the majority of tanker traffic. Oil prices closed at 100.32 on Friday, but after news that Saudi Arabia kept this key pipeline shut as a precaution over the weekend, prices surged quickly on today’s open up to a high of 103.80 before cooling slightly back down to current levels around 102.80 at the time of writing (0745 BST).
Traders may have to remain nimble this week as the news flow from the Middle East intensifies again. A pivotal event for Oil prices could whether a meeting of top diplomats from the 6 member Gulf Co-operation Council with their Iranian counterpart eventually goes ahead. The meeting, an attempt by Oman and Iran to secure a temporary deal to allow tanker shipping to safely pass through the Strait of Hormuz, was initially scheduled for later today but was postponed at the last minute without any further details on when the meeting could next take place.
In this headline driven environment, taking a step back to assess the wider technical backdrop and identify some potentially important support and resistance levels that may have an influence on the speed and direction of future Oil (WTI) moves could be productive.
Technical Update: Can the Recent Upside Acceleration Continue?
Oil (WTI) has experienced a clear increase in price volatility in recent weeks, with geopolitical news continuing to drive investor sentiment. This prompted a 30% rise in prices from the August 26th low of 80.32 up to the September 11th high at 104.72, before falling back to close the week at 100.32
It’s possible that Friday’s setback could merely have been an attempt to unwind short‑term upside extremes into the weekend and prices may resume their push to higher levels again, however it could also mark a top to the recent rally from which fresh downside could reemerge.
Of course, much will depend on future headlines from the US-Iran conflict. However, below we outline what may be the important levels to focus on over the coming week.
Potential Key Resistance Levels:
Having seen last Friday’s initial price strength capped by 104.72, which proved to be the session high, this could be the first key resistance level for traders to focus on. If the recent strength in Oil (WTI) prices is to resume, closing breaks above 104.72 may be required to achieve it.
Successful closing breaks above 104.72 could open scope for moves to 109.55, the May 18th high and if this level were also broken on a closing basis, 113.29, which is the April 30th high.
Potential Key Support Levels:
It’s too early to know for sure if Friday’s decline could be the start of a more prolonged phase of price weakness, and closing breaks below potential support levels may be required for this theme to develop further. As the chart below shows, the first support level for traders to focus on could be 95.34, which is the 38.2% Fibonacci retracement of the August 26th to September 11th high.
If closing breaks below 95.34 (38% retracement) are seen, it could lead to further price declines toward the next potential support at 92.46 (50% retracement), then 89.57 (61.8% level).
The material provided here has not been prepared accordance with legal requirements designed to promote the independence of investment research and as such is considered to be a marketing communication. Whilst it is not subject to any prohibition on dealing ahead of the dissemination of investment research, we will not seek to take any advantage before providing it to our clients.
Pepperstone doesn’t represent that the material provided here is accurate, current or complete, and therefore shouldn’t be relied upon as such. The information, whether from a third party or not, isn’t to be considered as a recommendation; or an offer to buy or sell; or the solicitation of an offer to buy or sell any security, financial product or instrument; or to participate in any particular trading strategy. It does not take into account readers’ financial situation or investment objectives. We advise any readers of this content to seek their own advice. Without the approval of Pepperstone, reproduction or redistribution of this information isn’t permitted. Gold – Volatility Alert as Key US Inflation Prints LoomGold prices have been choppy so far this week, initially reflecting potential trader unease at the possibility of a rate hike from the Federal Reserve (Fed) when they next meet to set US interest rates on Wednesday September 16th, less than 1 week from now. Higher interest rates tend to weigh on prices of precious metals like Gold that pay no interest or dividend and vice versa.
However, at the same time, its rebound from weekly lows may underlying the importance of the shiny metal to investors as a hedge against rising geopolitical turmoil in the Middle East and a surge in global bond yields. Gold opened the week at 4422 and then dropped 1.8% to a low of 4341 on Wednesday before quickly recovering back to current levels of 4427 again at the time of writing (0700 BST).
Looking forward, the next 48 hours could be pivotal for determining where Gold prices move next. While traders will continue to monitor the fast-moving situation in the Middle East, they may also be preparing for the release of 2 key US inflation reports. The outcome of these prints could shift market expectations further toward pricing a rate hike from the Fed at next week’s meeting, or may indicate another rate pause could be on the cards, depending on whether factory gate (PPI, Thursday 1330 BST), and more importantly consumer prices (CPI, Friday 1330 BST) trend higher, which may force the Fed into action, or are more benign, which could allow the Fed to keep interest rates unchanged for another month to consider the next round of key economic data releases.
Technical Update: Rally From 4320 So Far Fails to See Upside Momentum:
While Gold has seen a recovery develop following tests of support at 4320 (50% Fibonacci retracement July 17th to August 25th price strength), it has so far failed to attract sufficient trader buying interest to stage little more than a limited rally, with prices topping out at a high of 4443 (September 8th), well short of the first potential key resistance of 4511, the September 3rd high.
As the chart above shows, these two technical levels, support at 4320 (50% Fibonacci retracement) and resistance at 4511 (September 3rd high) could prove to be important points to monitor for Gold prices over the next 48 hours into the Friday close and then at the start of next week.
Potential Resistance Focus:
A successful close above the first potential resistance at 4511 (September 3rd high) may indicate risks are turning towards further upside momentum and tests of higher resistance levels over upcoming sessions.
If a closing break above 4511 materialises, it could lead to further price strength to challenge the next resistance point at 4697 (August 25th high), and even 4770 (50% Fibonacci retracement of January 29th to July 17th weakness). If the 4770 level were also to give way on a closing basis it could open potential for a continuation of the advance toward 4889 (April 17th high).
Potential Support Focus:
While the resistance level at 4511 remains intact, it is possible downside momentum might reemerge. This could lead to retests of the first potential support, identified above at 4320 (50% Fibonacci retracement).
Closing breaks below 4320 could increase potential for moves toward the next support at 4232 (68.2% retracement). A closing break below 4232 may then lead to further declines, shifting focus down toward the July 17th low at 3959.
The material provided here has not been prepared accordance with legal requirements designed to promote the independence of investment research and as such is considered to be a marketing communication. Whilst it is not subject to any prohibition on dealing ahead of the dissemination of investment research, we will not seek to take any advantage before providing it to our clients.
Pepperstone doesn’t represent that the material provided here is accurate, current or complete, and therefore shouldn’t be relied upon as such. The information, whether from a third party or not, isn’t to be considered as a recommendation; or an offer to buy or sell; or the solicitation of an offer to buy or sell any security, financial product or instrument; or to participate in any particular trading strategy. It does not take into account readers’ financial situation or investment objectives. We advise any readers of this content to seek their own advice. Without the approval of Pepperstone, reproduction or redistribution of this information isn’t permitted. Germany 40 – Preparing for ECB Rate Decision VolatilityJust under 2 weeks ago the Germany 40 index hit a new all-time high of 26630 on August 28th, however, since then prices have experienced a mild reversal back to the downside, with the index falling to a low of 25730 on Wednesday September 2nd before recovering slightly back to current levels around 25990 at the time of writing (0645 BST).
It seems sentiment towards some of the major German industrial corporates in the index may have been negatively impacted by the recent escalation of events in the Middle East, which is keeping energy costs elevated and may reduce margins and undermine future earnings.
Not only that, inflation in Germany, and more importantly the wider Eurozone, recently hit multi-year highs which has convinced many traders that the ECB may decide to raise interest rates again when they announce their next decision on Thursday at 1315 BST. Higher ECB interest rates tend to weigh on risk sentiment towards European stocks and vice versa.
Whether this is the case remains to be seen, but traders may also want to hear what ECB President Christine Lagarde says in the press conference (Thursday, 1345 BST) about the chances of future rate hikes moving into the end of 2026 and early 2027. Any hint at an increased potential for further ECB rate hikes to regain control of inflation could see the Germany 40 push down to create new September lows, while more dovish comments could lead to a relief rally back up towards recent highs.
Technical Update: Corrective Themes Building?:
Having posted a new all‑time high at 26630 on August 28th, the Germany 40 index has entered a corrective price phase, possibly as a reaction to what may have been over‑extended upside conditions.
However, ahead of the ECB rate decision and press conference on Thursday, traders could be attempting to establish whether this recent decline may develop into a more extended downside move, or, as has often been the case recently, price weakness proves limited before an uptrend pattern resumes.
Moving across the remainder of this week, establishing the potentially important support and resistance levels that could influence trader decision making may be useful in case Germany 40 price volatility increases into the Friday close.
Potential Resistance Levels:
While last week did see a recovery in price, it remained below what may prove to be the first potential resistance level at 26184 (the declining Bollinger mid‑average). In technical analysis, a declining mid‑average can suggest price activity is developing within a downtrend. Therefore for the Germany 40 a closing break above this mid-average may be required to indicate risks are turning back toward the upside again.
A close above 26184 could be seen as more constructive from a technical outlook and may shift the attention of traders back toward the August 28th highs at 26630 again.
A break and close above 26630 could open the way for moves toward 26962 (38.2% extension of the late‑August sell‑off).
Possible Support Levels:
While resistance at 26184 continues to cap Germany 40 prices on a closing basis, it could leave open the possibility of slowing upside momentum. If this is the case, the first support may be 25609 (38.2% retracement of the June 11th to August 28th strength).
As the chart above highlights, closing breaks below 25609 could shift focus toward the next potential support at 25294 (50% Fibonacci retracement). Closing breaks below 25294, if seen, could then open the way for declines toward 24976 (61.8% level).
The material provided here has not been prepared accordance with legal requirements designed to promote the independence of investment research and as such is considered to be a marketing communication. Whilst it is not subject to any prohibition on dealing ahead of the dissemination of investment research, we will not seek to take any advantage before providing it to our clients.
Pepperstone doesn’t represent that the material provided here is accurate, current or complete, and therefore shouldn’t be relied upon as such. The information, whether from a third party or not, isn’t to be considered as a recommendation; or an offer to buy or sell; or the solicitation of an offer to buy or sell any security, financial product or instrument; or to participate in any particular trading strategy. It does not take into account readers’ financial situation or investment objectives. We advise any readers of this content to seek their own advice. Without the approval of Pepperstone, reproduction or redistribution of this information isn’t permitted. USDJPY – More Volatility Incoming For The Week Ahead?USDJPY volatility has been generating many of the headlines in the G10 FX space in recent days as traders try and work out the reasons for some of this popular currency pair’s unusual price action and whether recent moves are sustainable.
On Wednesday last week, prices briefly hit a 1 month high of 160.39 before reversing quickly to touch a low of 155.29 just 48 hours later, eventually closing at 156.22 on Friday. Initial rumours suggested the drop could have been caused by further intervention or a rate check by Japanese authorities, which may have seemed a sensible explanation given the speed of the reversal, but no evidence could be found to back up this theory.
Traders then shifted their focus to the possibility of the Bank of Japan (BoJ) hiking interest rates again when they next meet on September 17th and potentially indicating an openness to be more aggressive, hiking rates at a faster pace in the future, a move supported by comments made by BoJ board member Takata last week. With the Federal Reserve announcing their latest decision on interest rates a day before on September 16th, it could open the possibly for a significant shift in interest rate differentials that may have a more lasting impact on USDJPY price trends.
Perhaps, the biggest outlier theory was the suggestion that the rise in Japan government bond yields to multi-year highs could lead Japanese funds to reallocate/repatriate capital back into domestic debt markets and out of US, UK, European and Australian markets, something that if it happened could lead to sustained demand for JPY against the USD.
While it is too early to tell which, if any of these reasons, may dominate USDJPY price action moving across the remainder of September, it may be prudent for traders to reassess the technical backdrop just in case things start to become more volatile.
Technical Update: USDJPY – Head and Shoulders Reversal Forming?
Between the April 2025 low (138.89) and July 2026 high (163.99), USDJPY experienced a consistent period of price strength which resulted in a gain of over 18%. However, since the July 2026 high, trader sentiment has been dominated by both the threat and reality of Bank of Japan intervention, which has helped to prompt the recent weakness in price.
However, from a technical perspective, what could be more significant is that recent price activity may be developing a potentially negative Head and Shoulders reversal. In technical analysis, this type of move would need to be confirmed by a close below the ‘neckline’ of the Head and Shoulders, which in the case of USDJPY appears to stand at 155.29 (trendline connecting recent lows).
What is a Head and Shoulders Top?
A bearish Head and Shoulders pattern is a technical chart formation signalling a potential reversal from an uptrend to a downtrend, confirmed when the price of an asset closes below the neckline support.
As we can see in the chart below, the pattern consists of three peaks following an uptrend:
Left Shoulder: Price rises to a peak and then declines to form a trough. In the case of USDJPY, this could be marked by the 160.46, March 2026 high.
Head: Price rallies higher than the left shoulder, forming the tallest peak of the pattern, then falls again. This could be marked by the 163.99, July 2026 USDJPY high.
Right Shoulder: Price rises once more after formation of the Head, but this strength fails to reach the previous high, forming a lower peak like the left shoulder. As the chart shows, this could be marked by the 160.39, August 2026 high.
Neckline: A support line connecting the lows between the shoulders and head. It can be horizontal, upward‑sloping, or downward‑sloping, and serves as the critical level for confirming the reversal. As noted above, this neckline may now stand at 155.29 (September 4th low) for USDJPY.
What Could a Head and Shoulders Top Mean for USDJPY?
The Head and Shoulders pattern is a potential reversal of price strength, although a confirmed neckline closing break must be seen to complete the reversal.
As such, traders could now be watching how the potential neckline support at 155.29 is defended on a closing basis. Closing breaks below 155.29 could suggest the risks of further downside momentum may be starting to reemerge.
While not a guarantee of price weakness, closes below 155.29 could lead to declines and a retracement of the April 2025 to July 2026 strength. This could open further price weakness toward 151.96/152.09 (50% retracement of April 2025 to July 2026 strength and January 2026 low) and, if this level were also to give way, even to 149.12 (61.8% retracement).
What Might End the Threat of the Head and Shoulders Top?
If a Head and Shoulders pattern isn’t forming within USDJPY, how the potential resistance levels are defended on a closing basis may need to be monitored over the coming week.
The initial resistance levels could sit at 157.29 (38.2% retracement of August to September 2026 weakness) and then 158.48 (61.8% level). However, it could be said that only closing breaks above 160.39 (Right Shoulder) may suggest risks could be turning back up toward fresh price strength, potentially leading to tests of 163.99 (July 2026 high).
The material provided here has not been prepared accordance with legal requirements designed to promote the independence of investment research and as such is considered to be a marketing communication. Whilst it is not subject to any prohibition on dealing ahead of the dissemination of investment research, we will not seek to take any advantage before providing it to our clients.
Pepperstone doesn’t represent that the material provided here is accurate, current or complete, and therefore shouldn’t be relied upon as such. The information, whether from a third party or not, isn’t to be considered as a recommendation; or an offer to buy or sell; or the solicitation of an offer to buy or sell any security, financial product or instrument; or to participate in any particular trading strategy. It does not take into account readers’ financial situation or investment objectives. We advise any readers of this content to seek their own advice. Without the approval of Pepperstone, reproduction or redistribution of this information isn’t permitted. US 500 – Preparing For Payrolls VolatilityYesterday the US 500 index rallied 0.3%, breaking a losing streak that had extended to 3 days immediately following the comments made by Federal Reserve Chair Kevin Warsh from the Jackson Hole on Friday, that were deemed to be more hawkish than many traders had been expecting and positioning for.
Interestingly, the 3-day decline held against a potentially important technical level, (more detail in technical section below) with traders seemingly happy to buy the dip while US corporate earnings remain solid and the oil price drops back slightly from 6-week highs.
However, despite the rebound in prices from their lows around 7615, trader uncertainty remains regarding the unstable situation in the Middle East, the impact of rising inflation on Fed interest rate policy and the outcome of this Friday’s US Non-farm Payrolls release (1330 BST). All of which has combined to help keep volatility elevated moving towards the weekend.
Looking forward to Friday’s US jobs report, while the headline number is often volatile, sentiment and positioning in the US 500 may be influenced by whether the unemployment rate moves above or below its current level of 4.1% and by the relative strength of average hourly earnings. Any deviation from market expectations may impact the decision making of Fed policymakers when they meet on September 16th to decide their next rate move. This could mean the payrolls outcome may have direct implications for the short-term direction of the US 500 back up towards all-time highs at 7817 (August 13th), or perhaps down towards new lows below 7615.
Technical Update: Price Weakness Finding Support at 38.2% Fibonacci Retracement Level
Having posted a new all‑time high at 7817 (August 13th), the US 500 index has entered a period of price consolidation. This type of activity is often seen after a strong advance, acting as a natural reaction to what were perhaps over‑extended upside conditions.
The challenge for traders in this environment may be attempting to determine whether the latest price weakness is, as has been the case previously, a limited downside correction from which fresh strength can reemerge, or if it represents a more meaningful negative sentiment shift that could lead to further deeper declines. For the upcoming sessions into the Friday close it could be useful to identify potential key support and resistance levels that may play an important role in shaping the next directional themes.
Potential Support Levels:
Recent declines in the US 500 on Tuesday and Wednesday this week have been held by what may be seen as important support at 7615 (38.2% retracement of the July 29th to August 13th upside). This could represent the first key level for traders to focus on over the next 48 hours.
Closing breaks below 7615, while not a guarantee of further declines, could trigger a deeper retracement of the price strength developing from the July 29th low. Breaks of 7615 could open scope toward 7534 (50% Fibonacci retracement), and possibly then 7492, (deeper 61.8% level).
Potential Resistance Levels:
While support at 7615 (38% retracement) remains intact on a closing basis, fresh attempts to push back towards the upside could emerge. In this scenario, the focus for traders may be on potential resistance at 7708 (Bollinger mid‑average).
Closing breaks above 7708 could lead to further price strength to challenge the August 28th high at 7771 and, if this level were also to give way, back to 7817 (August 13th high).
The material provided here has not been prepared accordance with legal requirements designed to promote the independence of investment research and as such is considered to be a marketing communication. Whilst it is not subject to any prohibition on dealing ahead of the dissemination of investment research, we will not seek to take any advantage before providing it to our clients.
Pepperstone doesn’t represent that the material provided here is accurate, current or complete, and therefore shouldn’t be relied upon as such. The information, whether from a third party or not, isn’t to be considered as a recommendation; or an offer to buy or sell; or the solicitation of an offer to buy or sell any security, financial product or instrument; or to participate in any particular trading strategy. It does not take into account readers’ financial situation or investment objectives. We advise any readers of this content to seek their own advice. Without the approval of Pepperstone, reproduction or redistribution of this information isn’t permitted.
Bitcoin – Is the Short Term Top in Place?The cryptocurrency market exploded back into life at the back end of August, taking Bitcoin quickly out of a drab summer trading range between 57699 (July 1st low) and 67258 (July 22nd high), adding 24% to its price in just 2 weeks in a move which achieved a 3 month high at 81554 before running into a wall of profit taking ahead of some important technical levels, more on this in the update below.
Now, with the Bitcoin price back trading around 77500 again at the time of writing (0645 BST), as general risk sentiment cools at the start of September due to surging global yields, an escalation of the Iran conflict, alongside worries about inflation and the potential for a Fed rate hike in September, the question Bitcoin traders could be asking themselves is, where next for the world’s biggest cryptocurrency?
Looking forward, much could depend on the assessment of the short-term technical outlook and how the price of Bitcoin performs when potentially important support or resistance levels are tested or even broken.
Technical Update: Why 82827-83156 May Be a Key Resistance Focus:
In true Bitcoin style, the last two weeks of August caught many traders off‑guard, as a sharp 30.5% rally developed from the August 14th low at 62458 up to the August 28th high of 81554. The sheer speed of this unwinding of bearish positioning left many traders racing to catch up.
However, as the weekly chart above shows, the latest price strength has approached what may prove to be a key resistance zone between 82827-83156 (the May 2026 recovery high and the 38.2% retracement of the October 2025 to July 2026 decline).
Potential Resistance Focus:
In technical analysis, a last recovery high and failure point of a previous downtrend may often be monitored closely by traders as a key resistance level. For Bitcoin, the May 2026 high stands at 82827. The fact this point is also close to 83156 (38% retracement) adds to the potential importance of the 82827-83156 zone as a resistance focus. If Bitcoin is to attempt further upside, it could well be closes above 82827-83156 that are required to suggest it.
As the above weekly chart shows, closing breaks above 82827-83156, could shift focus to 91,068 (50% Fibonacci retracement). Closes above 91,068, might open the way for moves toward 98,979 (61.8% Fibonacci level).
Potential Support Focus:
While the 82827-83156 resistance zone continues to cap prices a fresh sell‑off is still possible. In this scenario the focus for traders may shift to 76329 which is the September 1st low as the first key support level. Closes below 76329, while not guaranteeing further weakness, could lead to further declines.
As the daily chart above shows, closes below 76329 could open potential for moves toward the next support at 74340 (38.2% retracement) and, if this level also gives way, on toward 72087 (50% retracement).
The material provided here has not been prepared accordance with legal requirements designed to promote the independence of investment research and as such is considered to be a marketing communication. Whilst it is not subject to any prohibition on dealing ahead of the dissemination of investment research, we will not seek to take any advantage before providing it to our clients.
Pepperstone doesn’t represent that the material provided here is accurate, current or complete, and therefore shouldn’t be relied upon as such. The information, whether from a third party or not, isn’t to be considered as a recommendation; or an offer to buy or sell; or the solicitation of an offer to buy or sell any security, financial product or instrument; or to participate in any particular trading strategy. It does not take into account readers’ financial situation or investment objectives. We advise any readers of this content to seek their own advice. Without the approval of Pepperstone, reproduction or redistribution of this information isn’t permitted. EURUSD – Event Risk to Drive VolatilityEURUSD’s recent upward trajectory, which had seen it trade from a low of 1.1353 on July 28th up to a high of 1.1711 on August 21st came to an abrupt halt last Friday when Fed Chair Kevin Warsh was deemed to be more hawkish than expected in delivering his keynote speech from the Fed’s Jackson Hole symposium. In reiterating his commitment to bring inflation back down towards the US central bank’s 2% target he fuelled a fresh wave of speculation that the Fed could hike interest rates again when they next meet in mid-September.
However, while these comments led to surge in the US dollar (USD) against the EUR late on Friday, helping EURUSD to post a low at 1.1577, a level that was retested and held yesterday morning, there is still some uncertainty about the interest rate outlook for both the ECB and Fed, given the on-going conflict in the Middle East and important economic data that is due for release across the remainder of this week. All of which has the potential to increase volatility for this popular currency pair.
Looking forward, the first of these events, preliminary Eurozone inflation, is due for release later today at 1000 BST. The outcome of this inflation reading, which is anticipated to be close to multi-year highs due to rising energy costs, could clarify whether the ECB decide to hike interest rates again at their meeting on September 10th. It may also force policymakers to consider one further rate hike before the end of 2026, something which could impact EURUSD pricing.
Traders may alo be anticipating what the latest series of updates on the health of the US labour market could mean for EURUSD volatility. JOLTs Job Openings is released later today at 1500 BST; ADP Private Sector Payrolls are tomorrow at 1315 BST and then it’s the turn of the all-important Non-farm Payrolls on Friday at 1330 BST. After a weaker reading last month, FX traders are becoming very sensitive the direction of the US jobs market as, if below expectations, it could keep Fed interest rates on hold, or if above expectations it could help seal a hike on September 16th. Either way, the price of EURUSD, currently trading around 1.1605 at the time of writing (0630 BST), could be vastly different come the Friday close.
Technical Update: Limited Reaction in Uptrend or Negative Sentiment Shift?:
Last week did see EURUSD weakness emerge after a run of recent price strength. However, as the chart below shows, from a technical outlook this decline has developed following tests of potential resistance at 1.1704, a level equal to the 50% Fibonacci retracement of the January 27th to June 24th price weakness. This type of Fibonacci retracement level can be a key focus for traders, so perhaps it isn’t too much of a surprise that the latest setback has materialised.
Looking to the week ahead, the question may be whether the current sell‑off extends further, or if it proves to be a limited correction within a possible uptrend from which fresh price strength can develop again.
Identifying and then monitoring how important potential support and resistance levels are defended on a closing basis may offer clues to where the next directional themes could lie for this popular FX pair.
Potential Resistance Levels:
We have already outlined above that 1.1704 (50% retracement) may be the first key resistance level that needs to be broken on a closing basis to open scope for further price strength. However, there is possibly a closer level to monitor that stands at 1.1643 (half latest price weakness).
It may be prudent to watch how both the 1.1643 and 1.1704 levels are defended on a closing basis if tested over coming sessions.
If closing breaks above 1.1704 were to materialise, it could open for the way for an extension of recent price strength toward 1.1792, which is the higher 61.8% retracement. Breaks above this level could then see further upside toward the next resistance at 1.1849 (April 17th high).
Potential Support Levels:
On the downside, if further price weakness were to develop, 1.1575 (38.2% retracement of July 28th to August 21st price strength) may be an important level for traders to focus on. In technical analysis, closing breaks below a 38.2% retracement level can be an indication of increasing downside momentum.
[/image
A break below 1.1575 on a closing basis could lead to further declines toward the next potential support at 1.1533 (50% mid-point). If this level were also to give way on a closing basis, it could lead to continued price weakness toward 1.1491 (61.8% retracement).
The material provided here has not been prepared accordance with legal requirements designed to promote the independence of investment research and as such is considered to be a marketing communication. Whilst it is not subject to any prohibition on dealing ahead of the dissemination of investment research, we will not seek to take any advantage before providing it to our clients.
Pepperstone doesn’t represent that the material provided here is accurate, current or complete, and therefore shouldn’t be relied upon as such. The information, whether from a third party or not, isn’t to be considered as a recommendation; or an offer to buy or sell; or the solicitation of an offer to buy or sell any security, financial product or instrument; or to participate in any particular trading strategy. It does not take into account readers’ financial situation or investment objectives. We advise any readers of this content to seek their own advice. Without the approval of Pepperstone, reproduction or redistribution of this information isn’t permitted.
NVIDIA – Tonight’s Earnings in the SpotlightNVIDIA is the world’s biggest company by market capitalisation with a valuation of $5.16 trillion (August 25th), a considerable distance ahead of Apple in second place who are valued at $4.52 trillion. The sheer size of the company may force stock traders to closely monitor tonight’s quarterly revenue update, released after the market close.
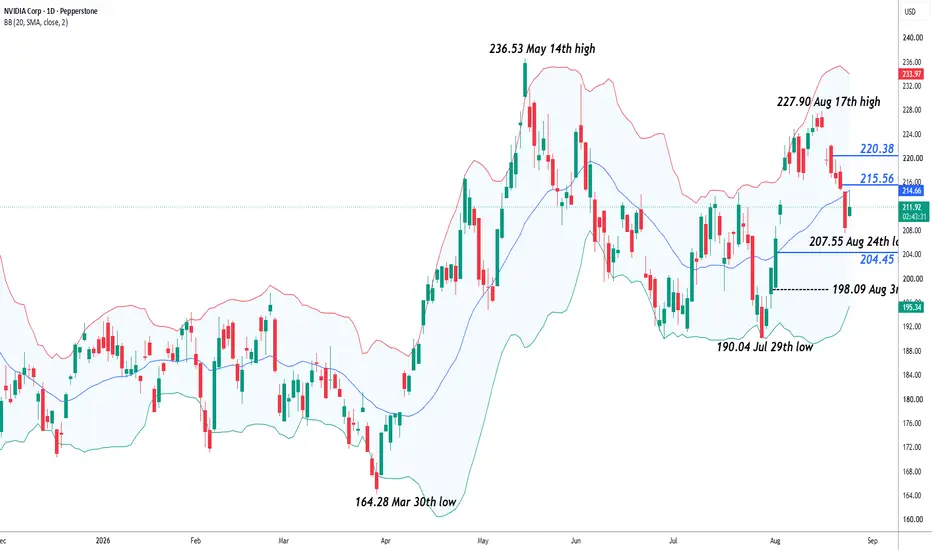
It may be worthwhile noting that as the release day for the company’s much anticipated Q2 earnings have been drawing closer its shares have been under pressure. In fact, before yesterday’s 2.15% rally, the NVIDIA share price had fallen for 7 consecutive sessions, taking the price from 227.90 (August 17th high) down to a low of 207.55 (August 24th low). A key reason for the decline may have been news out last week that NVIDIA’s biggest customers had been told of incoming price rises of 15% for the servers holding their AI chips which helped to weigh on sentiment.
Later tonight, the outcome of the actual earnings release and the earnings call with company executives could be a pivotal moment for the short-term direction of NVIDIA’s share price. Despite the recent uncertainty, expectations are still high for a doubling of revenue on the previous quarter, however traders may also be looking out for insights into the strength of future revenue, the impact of rising costs on margins and how executives see the threat of rising competition in the space.
Technical Update: Earnings to See Deeper Sell-Off Risks?
The latest NVIDIA earnings update, due to be released this evening after the New York close, is set to be an important sentiment driver for the share price and could be watched closely by traders.
Ahead of the release, it can often be useful to reassess the technical backdrop and identify potential key support and resistance levels that may influence the direction of the NVIDIA share price once the results are known.
Potential Key Support Levels
From the August 17th high (227.90) into the August 24th low (207.55), NVIDIA prices have fallen by nearly 9%. However, with a bounce developing during Tuesday’s price activity, it may now be Monday’s low at 207.55 that represents the first key support level. Traders’ initial focus following the earnings release may be on how well this support holds any future declines in price, as breaks below this level could result in further downside momentum.
As the chart above shows, if closes below 207.55 do materialise, focus may shift to the next possible support at 204.45 (61.8% retracement of the July 29th to August 17th strength). If this level were also to give way, the next support may then be 198.09 (August 3rd low), possibly further if that in turn is breached.
Potential Key Resistance Levels
As impressive as Tuesday’s rally may have appeared, price strength remained below a possible resistance level at 215.56 (38.2% retracement of the August 17th to 24th decline) before activity turned lower again into Tuesday’s close. This development could identify the 215.56 level as the first key short term resistance to monitor.
As the chart above shows, if a more sustained period of strength is to develop, successful closes above 215.56 may be needed to shift momentum toward higher levels. Such moves, if seen, could open the way for further upside moves toward 220.38 (61.8% retracement), and possibly then 227.90 (August 17th high).
The material provided here has not been prepared accordance with legal requirements designed to promote the independence of investment research and as such is considered to be a marketing communication. Whilst it is not subject to any prohibition on dealing ahead of the dissemination of investment research, we will not seek to take any advantage before providing it to our clients.
Pepperstone doesn’t represent that the material provided here is accurate, current or complete, and therefore shouldn’t be relied upon as such. The information, whether from a third party or not, isn’t to be considered as a recommendation; or an offer to buy or sell; or the solicitation of an offer to buy or sell any security, financial product or instrument; or to participate in any particular trading strategy. It does not take into account readers’ financial situation or investment objectives. We advise any readers of this content to seek their own advice. Without the approval of Pepperstone, reproduction or redistribution of this information isn’t permitted.
US 100 – Event Risk Keeping Volatility ElevatedIt’s a rarity for a week to go by in financial markets without technology stocks that dominate the US 100 index, grabbing the headlines in some form and it seems that this week is no exception. Sentiment and prices dipped early on Monday after Alibaba raised $10 billion in Hong Kong’s biggest ever secondary share sale to help fund its goal of being a global AI leader. This brought back concerns about the size of AI capital expenditure to the fore which saw chipmakers within the US 100 fall and led the index to drop from its initial highs around 29404 down to a low of 28873 before some dip buying stemmed the decline.
Traders are already on edge this week as it is, with Nvidia, the AI bellwether and world’s most valuable company, due to release its latest results after the close on Wednesday. Nvidia carries the biggest weighting in the US 100 and option markets are currently pricing in the chance of a 4.6% move in the stock post results according to Bloomberg, a move that if it happened could have a significant impact on US 100 index volatility.
Not only that but traders are also monitoring the response from Iran to the US switching its approach from missile strikes to a strategy of economic isolation to potentially bring some form of resolution to the Middle East conflict. How Tehran responds could also be an important factor influencing sentiment towards US indices.
Then finally on Friday, Fed Chair Kevin Warsh is due to deliver his keynote speech from the Fed’s Jackson Hole Symposium at 1500 BST. US 100 traders may be influenced by his views on US government finances, surging bond yields and central bank independence. Any updates he provides on interest rate policy could also be of pivotal importance given the uncertainty about what US policymakers may decide when they next meet on September 16th.
Technical Update: 29039 The First Key Support Focus?
While the period of price strength seen in the US 100 index between the July 29th low at 27050 and the August 17th high of 30246 was an impressive move, it appears the upside momentum may have failed against a potentially strong resistance band from which price weakness emerged last week.
This resistance band stands between 30246 all the way up to 30776 and equates to a series of previous failure highs posted between June 3rd and August 17th. Traders may view this series of highs as a strong barrier to further upside and could well be an important resistance area to monitor.
On the downside, the first key support focus could be 29039. This level is equal to the 38.2% Fibonacci retracement of the July 29th to August 17th strength. While this level was tested on Monday, it held on a closing basis, adding to its potential as an important support to watch in the short term.
Potential Resistance Levels:
While the previous cluster of highs between 30246 and 30776 may be the key resistance range, there could be a lower level for traders to monitor at 29580 which is equal to half of the latest decline. Closing breaks above 29580 could increase potential for a more sustained retest of the August 17th peak at 30246, possibly higher.
However, as outlined earlier in the technical update, for upside momentum to be reestablished it may take closes above the June 3rd high at 30776 to confirm potential for further gains toward 32212 (38.2% Fibonacci extension of the June 3rd to July 29th decline), then 33102 (61.8% extension).
Potential Support Levels:
Currently, the first potential support level at 29039 (38.2% retracement) is still holding the current phase of weakness and closes below this level may be necessary to indicate that risks are turning toward renewed declines.
Closing breaks below 29039 could lead to further downside momentum, opening scope toward 28551 (50% retracement), and then possibly the deeper 61.8% retracement at 28255.
The material provided here has not been prepared accordance with legal requirements designed to promote the independence of investment research and as such is considered to be a marketing communication. Whilst it is not subject to any prohibition on dealing ahead of the dissemination of investment research, we will not seek to take any advantage before providing it to our clients.
Pepperstone doesn’t represent that the material provided here is accurate, current or complete, and therefore shouldn’t be relied upon as such. The information, whether from a third party or not, isn’t to be considered as a recommendation; or an offer to buy or sell; or the solicitation of an offer to buy or sell any security, financial product or instrument; or to participate in any particular trading strategy. It does not take into account readers’ financial situation or investment objectives. We advise any readers of this content to seek their own advice. Without the approval of Pepperstone, reproduction or redistribution of this information isn’t permitted. Gold – Room for Extension or a Potential Short Term Top?At the start of August Gold traders received official confirmation that global central banks led by China’s PBOC remained buyers of Gold when prices dipped down below 4000 in mid-July. This news, coupled with a cooling of Federal Reserve rate hike expectations, helped support a technical breakout above 1 month range highs at 4166 (July 22nd high) on August 5th.
While the up move initially took a brief pause around the 4450 area to absorb a wave of profit taking, last week’s surprise intervention by the US Treasury in the bond market to stem a troublesome rise in yields had the knock-on effect of driving down the US dollar. This in turn helped make Gold, which is priced in the currency more appealing to global investors, helping push Gold prices up to 3-month highs at 4632 on Friday, before drifting off to close the week at 4605.
Looking forward, with Gold jumping 0.8% to 4642 on the Monday open, traders may be keen to hear further details of new fiscal initiatives to address soaring government borrowing costs that US Treasury Secretary Scott Bessant teased markets with at the back end of last week. They could also be preparing for the keynote speech from Fed Chair Kevin Warsh which is due to be delivered during the Fed’s Jackson Hole Symposium on Friday (1500 BST). Any further details he may reveal regarding whether policymakers could hike interest rates in mid-September may play a big role in determining if Gold prices push up to new highs or retrace back down to lower levels.
Given that the initial move above 4166 and then 4450 was supported by the technical backdrop, taking time to review the current technical update below and take stock of potential key support and resistance levels, may be helpful for setting risk and reward parameters across the next 5 trading days.
Technical Update: Could a Resistance Break Open Scope to Higher Levels?
Recovery themes have dominated activity for Gold across July and August, with the popular shiny metal staging an 18% rebound after a prolonged phase of weakness between the January 29th high at 5598 and the June 30th low of 3943. This on-going recovery could be encouraging for Gold bulls, especially as prices closed on Friday above what might have been expected to be an important resistance level.
As the chart above shows, the latest activity in Gold has seen a break above 4573, a level equal to the 38.2% Fibonacci retracement of the entire January to June decline.
Potential Resistance Focus:
The successful close above resistance at 4537 (38.2% retracement) could open the way for further attempts at price strength over upcoming sessions. Within technical analysis, closes above a 38.2% Fibonacci retracement level can shift the focus for traders to identifying higher resistance points that could now be tested.
In this scenario, traders may now be looking to the 4770/74 area, which contains the 50% retracement and May 12th high, as the next potential resistance focus. If this range is broken on a closing basis, it may open the possibility for tests of 4889 (April 17th high), and then 4966 (61.8% Fibonacci level).
Potential Support Focus:
Of course, a close above a 38.2% retracement level isn’t a guarantee of further price strength, so it remains prudent to monitor possible support levels in case sentiment turns down again. As such, 4488 (half of last week’s strength) may be viewed as the first key support. Closing breaks below this level could signal the potential for further Gold price weakness.
If 4488 were breached on a closing basis, downside risks could turn toward 4385 which is the 38.2% retracement of the rally from the June 30th low (3943) into the latest high on August 24th (4657). A closing break below 4385 might then lead to further declines, shifting focus for moves back down toward 4301 (50% level).
The material provided here has not been prepared accordance with legal requirements designed to promote the independence of investment research and as such is considered to be a marketing communication. Whilst it is not subject to any prohibition on dealing ahead of the dissemination of investment research, we will not seek to take any advantage before providing it to our clients.
Pepperstone doesn’t represent that the material provided here is accurate, current or complete, and therefore shouldn’t be relied upon as such. The information, whether from a third party or not, isn’t to be considered as a recommendation; or an offer to buy or sell; or the solicitation of an offer to buy or sell any security, financial product or instrument; or to participate in any particular trading strategy. It does not take into account readers’ financial situation or investment objectives. We advise any readers of this content to seek their own advice. Without the approval of Pepperstone, reproduction or redistribution of this information isn’t permitted.
Germany 40 – Facing a Potential August Sentiment CrisisThe strength and longevity of the recent surge to new all-time highs at 26595 (August 12th) in the Germany 40 has been called into question this week as bullish sentiment toward the index has been hit hard by a spike in global bond yields which has reflected growing concerns amongst traders regarding inflation risks at a time when the situation between the US and Iran in the Middle East seems to be deteriorating again.
Throw in worries about the increased borrowing by several key companies to fund their artificial intelligence build outs alongside a fresh wobble in demand for chipmaker stocks, and it’s perhaps easier to understand why after opening on Monday at 26495, the Germany 40 has dropped down to test some potentially important technical levels around the 26000 level at the time of writing (0645 BST). More on this in the technical update below.
Looking forward, while traders may be keeping a close watch on events in Iran and the direction of global bond yields, which eased back from their recent highs yesterday, sentiment toward the Germany 40 index into the weekly close could also be impacted by the release of the latest preliminary PMI surveys on Friday for Germany at 0815 BST and the Eurozone at 0900 BST. Readings above 50 signify economic expansion, while below 50 suggest economic contraction. Any indication from these surveys that economic growth may be starting to stall again moving through Q3 could weigh on index prices, while stronger data could be taken more positively.
Technical Update: Failure at Resistance But Watching Support:
So far this week the Germany 40 index has seen selling pressure develop to reverse recent price strength and prompt a setback. Interestingly, from a technical perspective, as the chart below shows, this setback has materialised after consistent failure to close above what may be viewed as a key resistance at 26451. This level is equal to the 38.2% Fibonacci extension of the sell‑off seen between 25942 (July 6th high) and 24617 (July 17th low).
Moving forward into early next week, traders could now be wondering whether the current price weakness may develop into a more extended phase of declines or could simply be a limited correction within an ongoing uptrend. At such a pivotal time, identifying potentially important support and resistance levels that may prove instrumental in determining the next directional themes for the Germany 40 index, may be an invaluable aid to decision making.
Potential Resistance Levels:
As suggested above, the 38.2% Fibonacci extension level at 26451 could represent the first key resistance, especially given it capped prices and helped to establish this week’s latest declines. As such, closing breaks above 26451 may now be required to open the way for challenges of higher resistance points.
A close above 26451 could shift attention toward the next resistance level at 26763 (61.8% extension). A break above 26763 could then open the way for moves toward 27269 (100% extension).
Possible Support Levels:
While resistance at 26451 continues to cap Germany 40 prices on a closing basis, it could leave open the possibility of slowing upside momentum. If this is the case, the first support may be 26037, which is the current level of the Bollinger mid‑average.
As the chart highlights, closing breaks below 26037 could shift focus toward the next potential support at 25846 (38.2% Fibonacci retracement). Closes below 25846, if seen, could then open the way for declines to 25613 (50% retracement), and even 25380 (61.8% level).
The material provided here has not been prepared accordance with legal requirements designed to promote the independence of investment research and as such is considered to be a marketing communication. Whilst it is not subject to any prohibition on dealing ahead of the dissemination of investment research, we will not seek to take any advantage before providing it to our clients.
Pepperstone doesn’t represent that the material provided here is accurate, current or complete, and therefore shouldn’t be relied upon as such. The information, whether from a third party or not, isn’t to be considered as a recommendation; or an offer to buy or sell; or the solicitation of an offer to buy or sell any security, financial product or instrument; or to participate in any particular trading strategy. It does not take into account readers’ financial situation or investment objectives. We advise any readers of this content to seek their own advice. Without the approval of Pepperstone, reproduction or redistribution of this information isn’t permitted. US 30 Facing Sentiment Challenge of US Retailer EarningsRecent US data readings may be starting to show the US consumer could be starting to feel the pressure of higher prices and Iran conflict fatigue, with sentiment starting to sag again after a brief rebound and retail sales on Friday showing their first drop in 9 months. This throws the budget health and spending habits of US households back into the spotlight at an important time for traders of the US 30 index, just as some of the biggest US retailers are due to release their Q2 results.
While only Home Depot, who reports later today (before open) and Walmart, who reports on Thursday (before open) are included in the US 30, meaning moves in their share price post results can have a direct impact on the path of the broader index, the sentiment impact of Target and Lowe’s earnings on Wednesday (before open) could also be a critical factor influencing how the US 30 performs into the Friday close.
From these earnings releases, traders could be looking to gain further clarity regarding whether US households are shifting spending towards essentials as energy costs remain elevated, as well as if higher borrowing costs are slowing down or delaying decisions on home improvement purchases. Comments from board executives providing an update on future revenue and the impact of higher costs on margins may also be a significant factor.
Currently, the US 30 sits around 2.5% or 1400 points below (0645 BST, 53424) its all-time high of 54792 registered on August 5th, and all of these events this week could have a pivotal impact on whether that high faces a fresh challenge, or the pullback deepens back down towards more significant technical levels (See technical update below)
Technical Update: Searching for Support as Price Correction Seen
Having successfully posted a new all‑time high at 54792 on August 5th, the US 30 index has entered a correction phase possibly as a reaction to the recent strength. Importantly, as the chart below shows, this correction materialised following a test of what might have been anticipated to be a resistance focus at 54539, which is the 61.8% Fibonacci extension of the price sell-off seen between July 7th (53407) and July 29th (51499).
Having failed to close above the 54539 Fibonacci extension level in early August, traders may be attempting to establish whether, as has been the case previously, the recent price weakness is a limited move before fresh strength re-emerges, or if this time, it leads to a more extended downside phase. In this type of situation, with a series of important macro events on the horizon, being aware of potential key support and resistance levels may prove beneficial to assist decision making in the days ahead.
Potential Support Levels:
Having previously seen a positive pattern of higher highs and higher price lows, it may prove to be the rising Bollinger mid‑average that reflects the first key support level. This currently stands at 53177 and could well be the initial focus for traders if further downside emerges. Closing breaks below 53177 may indicate that risks could be shifting toward further price declines and tests of deeper support levels.
Closes below 53177 could shift the focus for traders to the next potential support at 52852 (38.2% Fibonacci retracement) and if this level in turn gives way, the move could extend down toward 52267 (50% Fibonacci retracement).
Potential Resistance Levels:
As the chart below shows, the broader technical structure still reflects a positive pattern of higher highs and higher lows known as an uptrend condition. So, while support at 53177 remains intact on a closing basis, fresh positive momentum could re-emerge, shifting focus back to the important 54539/54792 resistance zone (61.8% extension and August 5th high) identified earlier.
Closing breaks above resistance at 54539/54792 could open the way for further upside toward 55251 (100% extension) and, if that also gives way, even toward 55960 (138.2% extension).
The material provided here has not been prepared accordance with legal requirements designed to promote the independence of investment research and as such is considered to be a marketing communication. Whilst it is not subject to any prohibition on dealing ahead of the dissemination of investment research, we will not seek to take any advantage before providing it to our clients.
Pepperstone doesn’t represent that the material provided here is accurate, current or complete, and therefore shouldn’t be relied upon as such. The information, whether from a third party or not, isn’t to be considered as a recommendation; or an offer to buy or sell; or the solicitation of an offer to buy or sell any security, financial product or instrument; or to participate in any particular trading strategy. It does not take into account readers’ financial situation or investment objectives. We advise any readers of this content to seek their own advice. Without the approval of Pepperstone, reproduction or redistribution of this information isn’t permitted.
GBPUSD – UK Data Springs into FocusGBPUSD traded at its highest level since early May on Friday at 1.3562, a gain of 2% from its most recent correction low posted on July 28th at 1.3273. While it eventually eased back down to close the week at 1.3533, it has edged higher again on this morning’s open to trade at 1.3555 at the time of writing (0730 BST).
Delving more into the details, the move higher in GBPUSD may predominantly have been assisted by a broadly weaker dollar (USD) as traders scaled back their expectations for a Federal Reserve interest rate hike in September following a key 7 day period in which US jobs data disappointed (Aug 7th), inflation (CPI) eased unexpectedly and retail sales dropped dramatically, which could be an early sign that consumers are starting to pull back on spending due to higher prices.
Looking forward, the emphasis may shift from the US to the UK with 3 important pieces of data due to be released, all of which have the potential to increase GBPUSD volatility. First up on Tuesday at 0700 BST is UK employment data, where traders may be looking to see if the unemployment rate has stabilised after hitting a multi-month high earlier in 2026. Next up is the latest CPI release on Wednesday at 0700 BST. Traders are expecting the rate to increase again after a surprise fall the previous month, so anything else could be a surprise. Then finally on Friday it’s the UK retail sales report at 0700 BST and coming on the back of a strong economic growth reading for Q2 last week, FX traders may be monitoring the details of this release to see if the positivity can continue with UK consumers maintaining their early summer spending or, like their US counterparts, they have started to cut back which could have negative implications for growth at the start of Q3.
Throw into the mix, uncertainty regarding the flow of Middle East oil supplies and the status of talks between Washington and Tehran and there is lots for GBPUSD traders to consider moving across the next 5 days.
Technical Update: Latest Recovery Back to Important Resistance:
Since the June 24th low was posted in GBPUSD at 1.3140, when political uncertainty over Keir Starmer’s resignation gripped UK market sentiment, stability within price activity appears to have returned. This saw a strong recovery materialise into the July 15th high at 1.3558 which now may have become the immediate resistance focus for the week ahead.
This argument appears to have been strengthened by the fact that last Friday’s price strength was capped by this level, prompting a setback into the close. Traders could potentially view this 1.3558 high as a key level for the coming week and how it is defended on a closing basis could indicate where the next directional themes may lie for GBPUSD.
Potential Resistance Levels:
After the sell‑off following tests of the potential resistance at 1.3558 (July monthly high) on Friday, it may appear this level could have established itself as an important focal point for the week ahead. How 1.3558 is defended on a closing basis this week could be instrumental in determining the direction of future GBPUSD price moves.
If 1.3558 were to give way on a closing basis, traders may shift their focus on to 1.3658, which is the May 1st session high, as the next resistance. If this level were also breached, upside momentum may continue toward 1.3733, the February 4th high.
Potential Support Levels:
Of course, the resistance at 1.3558 currently remains intact and while this continues, the risks are that price action could turn lower again. If this is the case, traders may be attempting to establish key support levels that, if broken, could see downside momentum emerge again.
If further downside is to be seen, it may be closing breaks below 1.3475 (last week’s low), that triggers it. Such a move could extend any declines, shifting the focus toward 1.3451 (38.2% Fibonacci retracement) and then possibly 1.3417 (50% Fibonacci retracement).
The material provided here has not been prepared accordance with legal requirements designed to promote the independence of investment research and as such is considered to be a marketing communication. Whilst it is not subject to any prohibition on dealing ahead of the dissemination of investment research, we will not seek to take any advantage before providing it to our clients.
Pepperstone doesn’t represent that the material provided here is accurate, current or complete, and therefore shouldn’t be relied upon as such. The information, whether from a third party or not, isn’t to be considered as a recommendation; or an offer to buy or sell; or the solicitation of an offer to buy or sell any security, financial product or instrument; or to participate in any particular trading strategy. It does not take into account readers’ financial situation or investment objectives. We advise any readers of this content to seek their own advice. Without the approval of Pepperstone, reproduction or redistribution of this information isn’t permitted.
USDJPY – Squeeze Testing Resolve of Japanese AuthoritiesAfter a short but sustained period of intervention, or in the recent case of USDJPY, joint intervention by Japanese and US authorities to strengthen the Japanese Yen (JPY) against the US Dollar (USD), which created a sharp down move from multi-decade highs at 163.95 on July 28th to a low of 155.23 on August 3rd the popular currency pair is back trading at 159.35 again at the time of writing (0645 BST).
Intervention to impact a currency pair can be effective in the short term as it puts traders on notice that one-sided moves will not be tolerated. However, once the dust has settled if the macro backdrop hasn’t changed, such as the market perception of the speed of interest rate hikes from the Bank of Japan (BoJ) or the policy decisions of Japanese PM Sanae Takaichi’s government to help stimulate economic growth remain in place, the USDJPY currency pair may resume its uptrend, testing the resolve of Japanese authorities once again.
In terms of interest rate differential which drive currency moves, an anti-climatic US CPI reading yesterday has seen market expectations for a Fed hike in September ease slightly, while a stronger than expected Japanese factory gate inflation (PPI) reading this morning, has seen expectations for a BoJ hike increase. This hasn’t created much of an immediate impact on the price of USDJPY, but it could suggest that the currency pair is entering a crucial period for traders where the next directional move may be established. Against this backdrop, it can be helpful to reassess the technical outlook.
Technical Update: Limited Recovery or Positive Sentiment Shift?
Following the co‑ordinated USDJPY intervention into early August, a move that tested potential long-term support at 155.03 (May 6th low), a phase of price strength has materialised. This recovery is perhaps not too surprising given the speed and extent of the initial decline, but traders could be wondering whether this latest strength represents a fresh positive sentiment shift that could lead to a more sustained rally or is simply a limited recovery before fresh weakness reemerges.
The answer to this important question could have longer‑term implications for USDJPY, and traders could find it useful to identify potential key support and resistance levels to gauge where directional themes may develop from.
Potential Resistance Levels:
It could be argued that the immediate resistance at 158.61 (38% retracement) has already given way on a closing basis, leading to further price strength this week. The focus could now shift to higher resistance points, with closing breaks above these levels required to open the possibility of further upside moves materialising.
Looking at the chart above, the next potential resistance could stand at 159.64 (50% retracement of July 23rd high to Aug 3rd low). Traders may be focused on how this level is defended on a closing basis to gauge if the current price strength has further to carry. Closing breaks above 159.64 could lead to renewed upside toward 160.69 (62% retracement), possibly further.
Potential Support Levels:
After the latest price strength, the 50% retracement resistance at 159.64 remains intact on a closing basis, and while this continues to hold, risks may turn back to the downside again. If this is the case and a sell‑off develops, closing breaks below potential support at 157.87, a level equal to the 38.2% retracement of the latest price strength, may be required.
A closing break below 157.87 could lead to fresh downside momentum, shifting focus to the next potential support at 157.36 (50% retracement), then 156.86 (62% retracement), and possibly further to test the long‑term support zone at 155.03/155.23 (May 6th and August 3rd lows).
The material provided here has not been prepared accordance with legal requirements designed to promote the independence of investment research and as such is considered to be a marketing communication. Whilst it is not subject to any prohibition on dealing ahead of the dissemination of investment research, we will not seek to take any advantage before providing it to our clients.
Pepperstone doesn’t represent that the material provided here is accurate, current or complete, and therefore shouldn’t be relied upon as such. The information, whether from a third party or not, isn’t to be considered as a recommendation; or an offer to buy or sell; or the solicitation of an offer to buy or sell any security, financial product or instrument; or to participate in any particular trading strategy. It does not take into account readers’ financial situation or investment objectives. We advise any readers of this content to seek their own advice. Without the approval of Pepperstone, reproduction or redistribution of this information isn’t permitted.
US 500 – Too Soon to Talk About 8000?The US 500 index faced significant challenges moving into the end of July with Washington and Tehran trading missile strikes, the Strait of Hormuz shut to oil tanker traffic, potential for incoming Fed rate hikes and investors concerned that the AI trade was ready to reverse its meteoric rise as chipmakers came under increased scrutiny.
However, despite all the negative headlines, the index held around 7300 and moving into the first week of August the sentiment backdrop started to improve, forcing traders to recalibrate positioning accordingly, especially once the US 500 broke above its previous all-time high at 7625 from June 2nd and then gathered upside momentum helped along by solid Q2 earnings, a pause to tit for tat strikes in the Middle East and a weaker than expected US jobs report on Friday, which saw markets scale back pricing for a September Fed rate hike from roughly a 65% to a 45% chance (Bloomberg).
This new trading week has started slowly, with prices fluctuating either side of Monday’s opening levels around 7752. Traders may be keeping a close watch on events in the Middle East and readying themselves for the possibility of an announcement confirming the reopening of the Strait of Hormuz or disappointment as the US responds to Iranian requests for reparations, while at the same time preparing for the latest series of US inflation releases for July (CPI: Wednesday, 1330 BST 1330, PPI: Thursday, 1330 BST), that could ultimately decide whether the Fed hikes interest rates in September or waits until later in the year.
Right now, it may be too early to discuss a serious challenge of the psychological 8000 level, however by the end of the week it’s possible that the outlook may have changed dramatically.
Technical Update: Price Strength Held by Extension Resistance
The important technical development in the US 500 index last week was the successful closing break above what might have been expected to continue acting as strong resistance level at 7625 (June 2nd previous all‑time high). This activity appeared to end the recent sideways range to the upside, something traders may have anticipated could lead to further price strength.
While the initial reaction to the break of 7625 could be described as positive for the index, the chart above shows that price strength has so far been held by what could be viewed as the next key resistance at 7780 (38.2% Fibonacci extension). Traders may now be wondering whether further price strength could emerge to breach the 7780 level, or if it may continue to cap gains and ultimately lead to price weakness developing again. In this situation, being aware of the key support and resistance levels may help guide decision making.
Potential Resistance Levels:
The 38.2% extension level at 7780 has already been identified as the first potential key resistance, and this argument appears to have been strengthened further by the fact that this level capped gains again on Monday. Therefore, if risks are to turn toward further price strength, it may be closing breaks above 7780 that lead to it.
If the 7780 level is broken on a closing basis, it could open the way for further price strength toward 7874 (61.8% Fibonacci extension), possibly even 8000/8024 (psychological number and higher 100% extension).
Potential Support Levels:
While the resistance at 7780 continues to hold on a closing basis, it’s possible that price weakness may emerge again. If that’s the case, trader focus could be directed toward a first potential support at 7699 (August 6th low).
Closing breaks below the 7699 level could trigger a deeper retracement of the strength developing from the July 29th low, with scope toward 7603 (38.2% Fibonacci retracement) and possibly then 7484 (62% retracement).
The material provided here has not been prepared accordance with legal requirements designed to promote the independence of investment research and as such is considered to be a marketing communication. Whilst it is not subject to any prohibition on dealing ahead of the dissemination of investment research, we will not seek to take any advantage before providing it to our clients.
Pepperstone doesn’t represent that the material provided here is accurate, current or complete, and therefore shouldn’t be relied upon as such. The information, whether from a third party or not, isn’t to be considered as a recommendation; or an offer to buy or sell; or the solicitation of an offer to buy or sell any security, financial product or instrument; or to participate in any particular trading strategy. It does not take into account readers’ financial situation or investment objectives. We advise any readers of this content to seek their own advice. Without the approval of Pepperstone, reproduction or redistribution of this information isn’t permitted. Gold – Positive Reversal or Limited Recovery?In the world of financial markets, traders can become exposed to short term periods of volatility where bigger directional moves occur when they are least expected. Gold experienced one of these types of situations last week, when after being stuck in a choppy sideways range for a month between lows at 3959 from July 17th, and highs at 4166 from July 22nd, prices spiked 6.5% during a 3-day period starting early on Wednesday, eventually printing a high of 4372 on Friday, before closing at 4341.
Interestingly, the move higher seemed to be driven more by trader positioning and a technical breakout (more on this in Technical update below), than by a potential deescalation of the US-Iran conflict and some pairing back of Federal Reserve interest rate hike bets after a weaker than expected US jobs report on Friday.
Looking forward, the strength of the breakout may be put to the test at the start of this new week, with traders still waiting for officials from Iran and Oman to confirm the opening of a safe path for shipping through the Strait at Hormuz, while Iranian backed Houthi rebels continue to strike energy infrastructure in the Middle East region.
Also important for Gold traders to monitor, could be the latest US CPI release which is due on Wednesday at 1330 BST. While last month’s reading produced a more benign print, this latest update for July is expected to show consumer prices moving higher again as the Iran conflict drags on, which if true, could see markets increase their expectations for the Fed to hike interest rates in September again. Something that could weigh on Gold which doesn’t pay interest or a dividend.
If last week saw a surprise breakout for Gold, staying alert to the outcome of these events and the technical section outlined below could help traders to be more prepared for fresh upside acceleration, or a wave of profit taking which may see prices drop down to lower levels.
Technical Update: Positive Reversal or Limited Recovery?
Our recent technical focus for Gold had been on the development of a more balanced sideways range between support offered by the June 30th low at 3943 and retracement resistance at 4188, where we suggested a closing breakout of either side may be required to indicate the next directional themes. As the chart below shows, it was last week’s price strength that saw a breakout to the upside, resulting in a sharp upwards move to higher levels above 4350.
This activity could leave traders attempting to establish whether this latest upside move reflects a positive sentiment shift that could lead to further gains, or as has been the case in the past, is simply a limited phase of recovery before fresh declines reemerge. In this environment, taking time to reassess potential key support and resistance levels after such aggressive price activity may prove to be beneficial.
Potential Resistance Focus:
The successful break above resistance at the 4188 level resulted in further price strength into the end of last week, taking Gold to levels last seen on June 17th at 4382. It’s possible that this level may be the immediate resistance focus for traders to start the new week. How this level is defended on a closing basis could be a strong gauge of whether the latest upside momentum may continue.
If Gold were to close above 4382, traders may begin to focus on the possibility for a recovery toward 4514 (38.2% retracement). With, closing breaks above 4514 opening potential for a further price extension to 4595 (May 29th high), even 4688 (50% retracement).
Potential Support Focus:
While the resistance at 4382 (June 17th high) remains intact on a closing basis, traders may consider whether the latest upside is simply an unwinding of recent downside extremes and therefore limited in nature. If this is the case, fresh price weakness could be seen to test the first possible important support at 4209 (38.2% retracement).
If 4209 were breached on a closing basis, downside risks could turn toward the next potential support level at 4109 (61.8% retracement). A closing break below 4109 might then lead to further price declines, with the focus shifting toward the 3943/3959 area again (June 30th and July 17th lows).
The material provided here has not been prepared accordance with legal requirements designed to promote the independence of investment research and as such is considered to be a marketing communication. Whilst it is not subject to any prohibition on dealing ahead of the dissemination of investment research, we will not seek to take any advantage before providing it to our clients.
Pepperstone doesn’t represent that the material provided here is accurate, current or complete, and therefore shouldn’t be relied upon as such. The information, whether from a third party or not, isn’t to be considered as a recommendation; or an offer to buy or sell; or the solicitation of an offer to buy or sell any security, financial product or instrument; or to participate in any particular trading strategy. It does not take into account readers’ financial situation or investment objectives. We advise any readers of this content to seek their own advice. Without the approval of Pepperstone, reproduction or redistribution of this information isn’t permitted.
Oil (WTI) - Race Lower Pauses at 1 Month LowThe price of Oil (WTI) remains front and centre in the headlines and this is perhaps understandable considering its impact on the direction of many other tradable markets due to its influence over the wider inflation dynamic.
Earlier in the week prices were moving aggressively lower after President Trump announced over the weekend that he was putting a hold on plans for further missile strikes on Iran to allow for the possibility of an agreement to be reached between Washington, Tehran and Oman to reopen the Strait of Hormuz, the crucial supply line for Middle East oil. This initially saw Oil drop quickly from its Friday close at 86.38, with a gap open on Monday at 79.75 which then continued down to print a 1-month low yesterday at 74.553.
However, despite Iran confirming overnight that it had reached an agreement with Oman on a proposed temporary shipping route through the Strait of Hormuz, Oil prices have remained stuck around $75 at the time of writing (75.21 0645 BST). This may be because traders are waiting for Washington, more specifically President Trump to provide his comments on the deal.
Looking forward, ahead of such an event and with the recent lows from early July at 67.551 (July 2nd) back within reach, it may be a good time to revisit the technical backdrop to determine if Oil prices could break to new lows or are moving into an important long term support zone that could attract fresh buying opportunities.
Technical Update: Using Bollinger Bands to Gauge Price Volatility:
Oil (WTI) has seen a clear increase in price volatility of late, with geo‑political news driving investor sentiment. This helped fuel a 39% rise between the July 2nd low at 67.551 and the July 23rd high at 94.108, before a sharp sell‑off developed within the last 10 trading days.
This type of activity can often be difficult for traders to navigate, but studying support and resistance levels alongside technical indicators can help judge where directional risks may lie.
One indicator that can be particularly useful in this type of environment is Bollinger Bands, which measures price volatility and helps indicate when risks may be turning toward more sustained moves in the direction of the prevailing trend.
Below, we look at historical Oil (WTI) data to show how Bollinger Bands could have helped traders identify trending conditions at the time, and what the bands may now be suggesting for Oil.
Bollinger Bands Within an Uptrend:
There are three lines to monitor within Bollinger Bands: the mid‑average, the upper band, and the lower band. The slope of the mid‑average indicates trend direction — rising suggests an uptrend, falling a downtrend, and a flat mid‑average indicates a neutral, sideways trend.
In Oil (WTI) as shown on the chart below, between the February 17th low and April 7th high, the mid‑average was rising throughout, indicating an uptrend. This suggested that traders could expect periods of price strength, with only limited corrections before fresh attempts at the upside re‑emerged.
During this time, the bands also indicated how aggressive the trend might be. In an environment of increasing price volatility, the bands widen while the mid‑average rises, suggesting price could accelerate higher and further, as long as volatility remained high and the bands continue to widen.
For Oil, when volatility steadied in late March/early April, both bands continued to rise but in parallel with the mid‑average. This was still an uptrend, as the average was moving higher, but with the bands moving parallel to each other, it suggested a less aggressive uptrend signal, but still an uptrend.
Only when the bands began to narrow and the support offered by the mid‑average was broken on a closing basis, did risks shift toward consolidation or setback in price.
Bollinger Bands Within a Downtrend:
Turning to a downtrend, such as the period in Oil (WTI) between May 18th and July 2nd we can see Bollinger Bands behaved differently (see chart below).
As soon as the mid‑average turned lower, it signalled a downtrend, and while resistance at the falling mid‑average remained intact, further price weakness was the risk. This was not an aggressive period of expanding negative volatility, as the bands didn’t widen, but they still indicated risks toward lower price levels while the mid‑average resistance remained intact and the bands fell in parallel to the average. It was closing breaks above the mid-average that eventually suggested the downtrend was over.
Bollinger Bands Within a Sideways Range – Oil (WTI) Now?
When the mid‑average of Bollinger bands is flat, it often signals more balanced, sideways themes for price. This is especially true when the upper and lower bands are also flat and moving parallel to the mid‑average. This indicates stable volatility, with price likely to move between the upper‑band resistance and lower‑band support.
This appears to be the current set‑up for Oil (WTI), suggesting that after the recent price volatility, a sideways range may now be forming. If so, support could stand at the lower band (70.409) and resistance at the upper band (92.257), with potential for this range to extend further.
An end to these balanced themes would require the mid‑average to either turn higher for a new uptrend, or lower for a new downtrend, followed by both bands turning in the direction of the emerging trend. Only then would a more sustained period of directional movement be possible, with any widening of the bands opening the possibility of a more sustained price move.
Possible Short Term Support/Resistance Levels:
While Oil prices may remain within a wide range defined by the Bollinger Bands, there are still potentially important key support levels to monitor. The first focus is at 74.553, equal to Wednesday’s session low, and if this gives way, attention could shift to 71.063, the July 10th session extreme. A closing break below 71.063 might then expose the 70.409 lower Bollinger band and range‑lower extremes.
To the upside, focus could now be on 81.833, the Bollinger mid‑average, as the first key resistance. Closing breaks above 81.821 could potentially lead to further price strength. If such moves develop, it could open tests of 86.510, the July 31st high, and if this level is broken on a closing basis, on toward 92.257, the upper Bollinger band and upper extremes of the sideways range.
The material provided here has not been prepared accordance with legal requirements designed to promote the independence of investment research and as such is considered to be a marketing communication. Whilst it is not subject to any prohibition on dealing ahead of the dissemination of investment research, we will not seek to take any advantage before providing it to our clients.
Pepperstone doesn’t represent that the material provided here is accurate, current or complete, and therefore shouldn’t be relied upon as such. The information, whether from a third party or not, isn’t to be considered as a recommendation; or an offer to buy or sell; or the solicitation of an offer to buy or sell any security, financial product or instrument; or to participate in any particular trading strategy. It does not take into account readers’ financial situation or investment objectives. We advise any readers of this content to seek their own advice. Without the approval of Pepperstone, reproduction or redistribution of this information isn’t permitted.
USDJPY – Reassessing the Landscape Post Joint InterventionThe major FX pairs may have lacked the volatility of other asset classes in recent weeks, with traders hampered by converging interest rate expectations for the next moves by the world’s biggest central banks across the remainder of 2026.
However, for USDJPY things sparked into life on Thursday last week once the Federal Reserve rate decision from the evening before was in the rear-view mirror. A renewed push up towards the 164.00 level and multi decade highs was met with a coordinated response from US and Japanese authorities to strengthen the Japanese Yen (JPY), a move which initially took USDJPY down below 158.00. Then on Friday, after the Bank of Japan’s decision to keep rates unchanged for another month was announced, a second round of intervention was unleashed which capped the USDJPY rebound below 160.00 and ensured a close at 157.65, a weekly decline of 3.8%.
Moving forward to the new week, the selling initially continued when Japanese finance minister Satsuki Katatama confirmed the joint US-Japan intervention campaign early on Monday morning. This took the popular currency pair down to 3-month lows at 155.23 before fresh dip buying pushed prices back up to current levels around 157.66 (0645 BST). The numbers suggested to be involved are mind blowing, with Tokyo rumoured to have spent over $55 billion on its own propping up its beleaguered currency (Bloomberg).
Now, the challenge for traders is to judge what comes next, which could be tough given the uncertainty of whether further intervention is still a possibility. In this type of environment, a reassessment of the important technical support and resistance levels that could impact the direction of USDJPY prices moving forward could be a useful first step to take, especially as the down move stopped only 20 pips from the 155.03 level which is the low from May 6th (more on this below).
Technical Update: Intervention Sees Tests of Long Term Support:
Last week’s co‑ordinated intervention created increased USDJPY volatility, resulting in a sharp decline in price. This weakness, initially extended further to the downside on Monday, approaching a potential long‑term support focus for traders between 155.03/154.78.
As highlighted by the weekly chart above, this potential 155.03/154.78 support zone corresponds to a combination of the May 2026 low and the 38.2% Fibonacci retracement of the entire April 2025 to July 2026 phase of price strength.
After what has already been a sharp sell‑off over a relatively short period of time, traders may now be assessing whether this decline could extend further to break below support, or if a deeper recovery could establish itself. To help gauge the reaction it may be useful to identify and assess what could be the important support and resistance levels to monitor.
Potential Support Levels:
After an earlier intervention by Japanese authorities in late April, it was the low at 155.03 from May 6th that proved to be an important support, from which an extended phase of price strength emerged.
Within technical analysis, a last correction low posted nearly three months earlier, such as the 155.03 May 6th extreme, may draw the attention of traders.
When taken with the proximity of the long‑term 38.2% retracement at 154.78 this could identify the 155.03/154.78 area as the first key support zone.
A closing break below 155.03/154.78 could lead to renewed downside momentum, shifting focus to the next potential support between 152.09/151.96 (January 2026 price low and 50% retracement), and possibly further if this in turn gives way.
Potential Resistance Levels:
To gauge key resistance levels, we could turn to the shorter‑term daily perspective shown below. The first resistance may prove to be 157.89 (Monday’s high), especially as at the time of writing (0645 BST) this level has capped Tuesday’s initial rally. Closing breaks above this previous failure high may now be required to open further attempts at price strength.
Closing breaks above 157.89 could see the focus shift to 158.61 (38.2% retracement), and if this level also gives way on a closing basis, on toward 159.64 (50% retracement).
The material provided here has not been prepared accordance with legal requirements designed to promote the independence of investment research and as such is considered to be a marketing communication. Whilst it is not subject to any prohibition on dealing ahead of the dissemination of investment research, we will not seek to take any advantage before providing it to our clients.
Pepperstone doesn’t represent that the material provided here is accurate, current or complete, and therefore shouldn’t be relied upon as such. The information, whether from a third party or not, isn’t to be considered as a recommendation; or an offer to buy or sell; or the solicitation of an offer to buy or sell any security, financial product or instrument; or to participate in any particular trading strategy. It does not take into account readers’ financial situation or investment objectives. We advise any readers of this content to seek their own advice. Without the approval of Pepperstone, reproduction or redistribution of this information isn’t permitted. US 100 – Sentiment Direction Remains on a Knife EdgeIt’s been a wild 2-week period for technology stocks in the US 100 index, which has taken prices on a 13% ride from 29178 (July 21st high) down to 27050 (July 29th low) and back up to 28500 again (Current levels 0700 BST). The down move was led by growing concerns regarding the size of AI capital expenditure being made by Magnificent Seven companies and a bout of panic selling in previously high-flying chipmaker stocks, while prices were given a major boost off the lows late last week on the back of impressive Microsoft and Amazon earnings which helped to throw everything into reverse, and potentially leave sentiment toward the US 100 on a knife edge to start August.
Looking forward in the short term, the focus for traders could be in several key areas. Events in the Middle East may continue to impact sentiment after President Trump announced on Sunday that he had postponed the latest round of planned attacks to restart talks with Iran possibly as early as later today (Bloomberg). Earnings from Palantir Technologies tonight (after close) and then Advanced Micro Devices (AMD) tomorrow (after close), could also be key volatility drivers.
Then there are the latest updates on the health of the US labour market to consider, with the JOLTs Job Openings survey on Tuesday (1500 BST), ADP Private Sector Payrolls on Wednesday (1315 BST) and the all-important Non-farm Payrolls report on Friday (1330 BST) which could generate some important index moving headlines. Traders are sensitive to the real possibility of an interest rate hike from the Federal Reserve at their next meeting in September, and while policymakers could be swayed to postpone hikes if the jobs market is weakening and unemployment rate rising, a resilient series of readings could help solidify their decision to hike. Either way, US 100 volatility could remain elevated across the next 5 trading days.
Technical Update: Limited Bounce or Positive Sentiment Shift?
Since printing the June 22nd recovery high at 30680, the US 100 index has experienced a negative phase of sentiment, which registered a 12% decline into last week’s low at 27050. A move that may have been accelerated by the closing break below a potential support area at 28206/28209 which marked the June 9th and July 17th lows.
As a counter move to this weakness, last Thursday and Friday did see a strong recovery reemerge and traders may now be wondering where the next directional risks lay, especially as the recovery move still remains below what might be anticipated as a resistance focus between 28749/28767 (see chart above), an area equal to the 61.8% Fibonacci retracement of the July 10th to July 29th decline and the declining Bollinger mid-average.
Does this mean risks are developing for a more prolonged phase of price strength or is the latest recovery a limited move before fresh weakness is seen again to extend what could be described as a downtrend pattern?
Being aware of the potential key support and resistance levels may help to answer this question.
Potential Resistance Levels:
Following Thursday and Friday’s recovery the 28749/28767 zone may appear to be the first key resistance focus this week. How 28749/28767 is defended on a closing basis could determine whether further price strength emerges to challenge higher resistance levels.
Closing breaks above 28749/28767 could see risks shift toward further price strength to test the next resistance at 29178, which is the July 21st session high, and if this is also breached, on toward 29850, the July 10th upside extreme.
Potential Support Levels:
While the 28749/28767 resistance area remains intact on a closing basis it is possible that there could be further attempts to resume price declines, which could keep the pattern of lower price highs and lower price lows in place. If this is the case, focus could shift to 27812, a level equal to half of last week’s rally, as the first key support focus.
While not a guarantee of continued price declines, closing breaks below 27812 could lead to further downside momentum. Such moves, if seen, might open scope toward 27050, which is the July 29th session low, and then the deeper 50% retracement at 26753.
The material provided here has not been prepared accordance with legal requirements designed to promote the independence of investment research and as such is considered to be a marketing communication. Whilst it is not subject to any prohibition on dealing ahead of the dissemination of investment research, we will not seek to take any advantage before providing it to our clients.
Pepperstone doesn’t represent that the material provided here is accurate, current or complete, and therefore shouldn’t be relied upon as such. The information, whether from a third party or not, isn’t to be considered as a recommendation; or an offer to buy or sell; or the solicitation of an offer to buy or sell any security, financial product or instrument; or to participate in any particular trading strategy. It does not take into account readers’ financial situation or investment objectives. We advise any readers of this content to seek their own advice. Without the approval of Pepperstone, reproduction or redistribution of this information isn’t permitted.
Gold To Face Trial By FedGold prices derived an initial benefit early on Monday from the pause in fighting between Washington and Tehran, however the rally up to a high of 4116 was short lived as traders started to prepare for the outcome of tonight’s Federal Reserve interest rate decision at 1900 BST. The uncertainty surrounding whether the world’s most powerful and influential central bank will hike rates by 25bps (0.25%) to help combat the threat of inflation has weighed on Gold, which doesn’t pay any interest or dividend, taking the price back lower down to current levels around 4030 at the time of writing (0645 BST). Now, with around 40% chance of a rate hike priced in by market participants (Bloomberg), the release of the actual Fed decision could bring with it the possibility of a serious increase in volatility.
Even if the decision is to keep rates unchanged, the comments of Fed Chair Kevin Warsh in the press conference which starts at 1930 BST could have the potential to send Gold down to test range lows at 3943 (July 30th low) or up toward range highs at 4188 (38.2% Fibonacci retracement). Traders may be influenced by whether his commentary is seen as more hawkish, accepting the challenge to reinforce his inflation fighting credentials, or if he goes a step further and flags rate hikes later in 2026, something which could be a negative for Gold prices. While, on the flip side, a more dovish commentary leaning toward a more ‘wait and see’ stance on rate moves and inflation, after the tamer than expected US June CPI reading, could be taken as more positive for Gold prices.
Either way, ahead of such a pivotal event, keeping updated on the important technical outlook and levels could be helpful to assess market positioning and momentum, as well as future trade planning.
Technical Update: Can Fed Reaction Lead to a Range Breakout?
While Gold prices did see a recovery after the June 30th session low at 3943 was posted, as the chart below shows, this price strength was held and reversed by resistance at 4188 (38.2% retracement). Activity since that point has formed a choppy sideways range, with 4188 marking the upper resistance level and 3943, the lower support.
As we near the important events this evening, traders may be wondering if the potential for increased price volatility after the Fed rate announcement and press conference could lead to a closing breakout from the current 3943 to 4188 range. In this situation, being aware of key support and resistance levels may prove beneficial.
Potential Support Focus:
The June 30th low at 3943 may be the key support level for Gold this week, given that it’s the potential lower limit of the current choppy sideways range. Having seen a recovery develop from this level, how support at 3943 is defended on a closing basis may be important for determining the future direction of Gold. Closing breaks below 3943, if seen, could lead to further price weakness.
If 3943 is breached on a closing basis, downside risks could turn toward the next support at 3887 (October 28th low). A closing break below 3887 might then lead to the potential of further price declines, with the focus shifting toward 3819 (October 2nd extreme), even 3628 (September 18th low).
Potential Resistance Focus:
While support at 3943 remains intact, the sideways range remains in place, and Gold may experience further attempts at recovery. In this scenario, the resistance at 4188 could be a key level for traders to monitor. This level represents the 38.2% Fibonacci retracement of the May 29th to June 30th decline and has managed to cap rallies recently, however if Gold prices could close above 4188, it may lead to fresh upside momentum materialising.
Closes above 4188, may open risks for further recovery attempts toward 4263 (50% retracement). Closing breaks above 4263 could then open the way for the Gold price to extend toward 4329 (61.8% retracement).
The material provided here has not been prepared accordance with legal requirements designed to promote the independence of investment research and as such is considered to be a marketing communication. Whilst it is not subject to any prohibition on dealing ahead of the dissemination of investment research, we will not seek to take any advantage before providing it to our clients.
Pepperstone doesn’t represent that the material provided here is accurate, current or complete, and therefore shouldn’t be relied upon as such. The information, whether from a third party or not, isn’t to be considered as a recommendation; or an offer to buy or sell; or the solicitation of an offer to buy or sell any security, financial product or instrument; or to participate in any particular trading strategy. It does not take into account readers’ financial situation or investment objectives. We advise any readers of this content to seek their own advice. Without the approval of Pepperstone, reproduction or redistribution of this information isn’t permitted.
Microsoft Next Up to Face Q2 Results TestA pause to recent hostilities between the US and Iran may have sparked a broad relief rally across multiple asset classes on Monday, but the challenges remain for technology stocks.
Looking forward, the next directional catalyst for the Microsoft share price could be when the company reports its latest earnings on Wednesday evening after the market close.
These results come at a critical time when traders are laser focused on the huge size of AI spending by technology giants, Microsoft, Meta, Amazon and Alphabet, which is eating up their cash reserves despite the fact it may be starting to yield revenue outperformance. For example, Alphabet, the first hyperscaler to report its results last week, saw cloud computing revenue soar by 82% but its share price dropped more than 5% the following day because it also announced a larger increase to its capital expenditure forecast for 2026.
Traders may be preparing to follow a similar playbook for the Microsoft earnings on Wednesday evening, especially given the fact concerns have risen throughout 2026, that the company may be falling behind its rivals in the AI space. Since hitting a high of 466.28 at the start of June, the Microsoft share price has been under pressure, culminating in a fall to a new low for the year at 347.19 on June 25th, although it has since recovered back to current levels around 389.
When assessing this earnings release, investors may be focused on judging the revenue performance of Microsoft’s Azure cloud computing business against expectations but could also be ready to make a judgement on updates provided to capital expenditure across the rest of 2026, cash flow and future revenue projections.
Technical Update: Choppy Conditions Ahead of the Earnings Release:
As we approach the all-important Microsoft earnings on Wednesday evening, it appears as if price activity is tracing out a more balanced range, between potential resistance at the 407.98 level (50% Fibonacci retracement of the June sell-off) and potential support at the 377.69 level (50% retracement of the latest price strength).
This sideways pattern is evident in the chart above, and traders may be wondering whether the possibility of increased volatility following the earnings release could result in a closing breakout from this range, which in turn could help to indicate where the next directional themes may lie.
Potential Resistance Levels:
We have suggested that 407.98 represents the broader upper range extreme, but there is possibly an earlier resistance focus for traders at 391.93, a level equal to half of the latest price decline, which managed to cap prices on a closing basis on Monday. Closes above 391.93, while not an outright positive trigger, may lead to further price strength to test the more important 407.98 level.
If closes are seen above 407.98 this week, it could lead to continued upside momentum in price, shifting focus to 421.90 (61.8% Fibonacci retracement). A closing break above this level could then open scope towards 434.09, which is the June 4th session high.
Potential Support Levels:
While resistance at 391.93 remains intact, it’s possible that fresh price weakness may still develop. If this is the case, focus could shift toward support at 377.69, which is the 50% retracement level and the lower extreme of the current range. Closes below 377.69, may suggest a negative sentiment shift which could result in further price declines.
A closing break below 377.69 may open scope for further downside pressure toward the next support at 370.92 (61.8% retracement level). A closing break below 370.92 could expose potential for moves toward 349.19, which is the June 25th session low.
The material provided here has not been prepared accordance with legal requirements designed to promote the independence of investment research and as such is considered to be a marketing communication. Whilst it is not subject to any prohibition on dealing ahead of the dissemination of investment research, we will not seek to take any advantage before providing it to our clients.
Pepperstone doesn’t represent that the material provided here is accurate, current or complete, and therefore shouldn’t be relied upon as such. The information, whether from a third party or not, isn’t to be considered as a recommendation; or an offer to buy or sell; or the solicitation of an offer to buy or sell any security, financial product or instrument; or to participate in any particular trading strategy. It does not take into account readers’ financial situation or investment objectives. We advise any readers of this content to seek their own advice. Without the approval of Pepperstone, reproduction or redistribution of this information isn’t permitted.
Crude (WTI) – Sharp Rally Then Gap Lower, Where Next?Last week, the relentless nature of US strikes on Iran in an attempt to degrade Tehran’s ability to attack shipping through the Strait of Hormuz and the retaliatory strikes on US bases and also regional allies, which resulted in the death of several US service personnel, consumed the attention of oil traders. It restricted the flow of Middle East supplies, forcing prices up from a low of 78.702 seen on Monday July 20th to a high of Thursday July 23rd at 94.108, testing important technical resistance in the process, more on this below.
However, then on Friday the backdrop changed, rumours of the possibility for mediated talks between the US and Iran started to circulate, pulling prices back lower again, to close the week at 91.106. Tensions eased further over the weekend with the US pausing strikes for 2 consecutive days, resulting in Tehran commenting it would also halt its retaliation, while also entering talks with officials from Oman in an attempt to resolve shipping issues through the Strait of Hormuz. These events combined to produce a gap open move lower in Oil (WTI) on Monday, which extended to touch a low of 83.649 before some fresh buyers were found taking prices back to 84.10 at time of writing (0730 BST).
Looking forward, the Iran conflict stands at a potential crossroads, with traders awaiting the next crucial news updates on whether the shift is toward deescalation and talks or a resumption of attacks. In this environment assessing the technical backdrop can prove to be useful for future trade planning.
Technical Update: A Question of Retracement Resistance Versus Retracement Support
With geo-political concerns increasing last week, the price of Crude Oil (WTI) rallied sharply, following what was a 43% decline seen between the March 9th high (119.45) and July 2nd low (67.551). As the chart below shows this latest phase of price strength tested what is potentially an important resistance level at 93.352. This is equal to the 50% Fibonacci retracement of the March/July decline.
Traders may be monitoring how this 93.352 resistance level is defended on a closing basis in an attempt to gauge if the current strength can continue to higher levels, or if it proves to be an important resistance, from which fresh declines may emerge again.
Potential Resistance Levels:
As stated above, it appears that the 93.352 retracement represents the first key resistance level this week and how it is defended on a closing basis may be the catalyst for the next directional move for Oil (WTI). Closing breaks above 93.352 could lead to a further period of price strength.
If closes are seen above 93.352 this week, it could shift focus towards 99.480, which is a level equal to the 61.8% Fibonacci retracement. A break above this level could open scope towards 109.551, the May 18th session high.
Potential Support Levels:
While the retracement resistance at 93.352 continues to cap prices on a closing basis the risk for a resumption of downside themes remains a possibility.
Weekend developments in the Middle East have already seen weakness reemerge to start the new week, with prices experiencing a gap lower at the 86.031 open and then an extended fall to a low of 83.649, before recovering.
This fall may mean the focus for traders could already be shifting to potential support at 84.055, which is the 38.2% Fibonacci retracement of the July price strength.
A closing break below 84.055 could open scope for further downside pressure toward the next support at 80.912 (50% retracement level). A closing break below 80.912 may then see the risks for an extension of the price weakness increase toward 77.770, which is the deeper 61.8% level.
The material provided here has not been prepared accordance with legal requirements designed to promote the independence of investment research and as such is considered to be a marketing communication. Whilst it is not subject to any prohibition on dealing ahead of the dissemination of investment research, we will not seek to take any advantage before providing it to our clients.
Pepperstone doesn’t represent that the material provided here is accurate, current or complete, and therefore shouldn’t be relied upon as such. The information, whether from a third party or not, isn’t to be considered as a recommendation; or an offer to buy or sell; or the solicitation of an offer to buy or sell any security, financial product or instrument; or to participate in any particular trading strategy. It does not take into account readers’ financial situation or investment objectives. We advise any readers of this content to seek their own advice. Without the approval of Pepperstone, reproduction or redistribution of this information isn’t permitted.