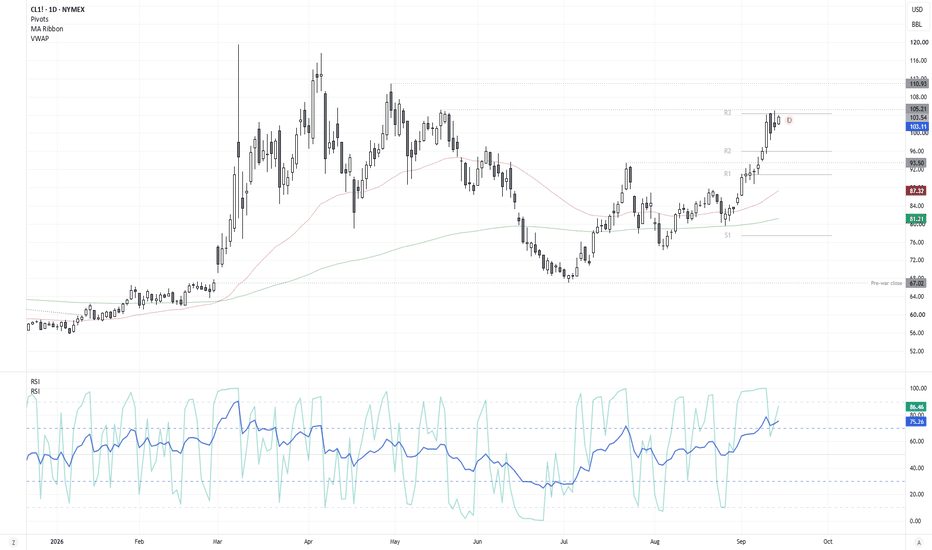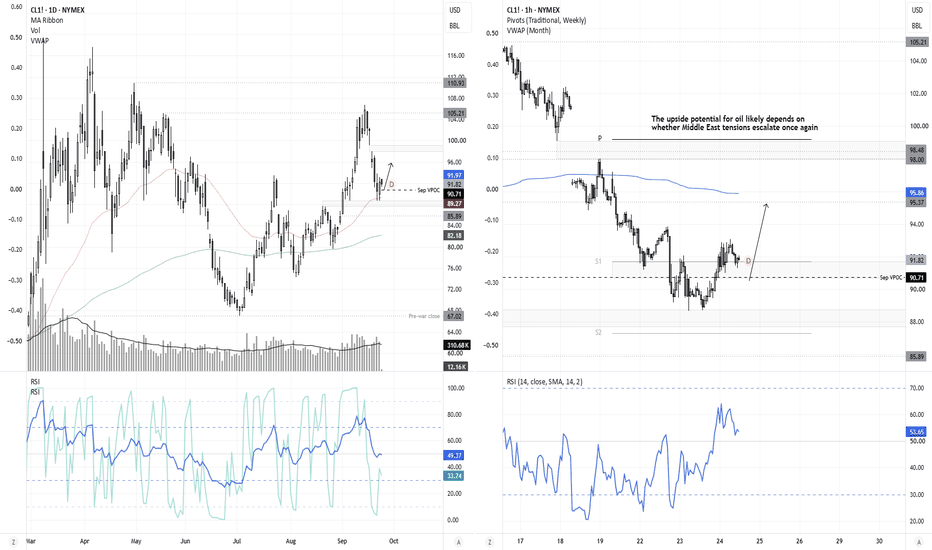
WTI Crude Ponders Potential BounceOn Tuesday 15 September, I warned that without a fresh catalyst, I was suspicious of crude oil breakouts. While WTI closed the day higher by the day’s close and at a 4-month high, it was short lived. And only marginally above the 105.21 high. And since then, we have clearly seen the bearish mean-reversion I sought.
But now I suspect the pullback has gone too far. Note the tweezer bottom on the daily chart around the 50-day EMA, and with both of those candles with above-average volume – it suggests bulls may be accumulating. And with prices now back above the September VPOC, dips may be favourable while prices remain above 88.67 swing low.
I have a conservative upside target around 96 for now – near the monthly VWAP. But if tensions in the Middle East return, then so does oil’s upside potential.
MS
StoneX Trading publications
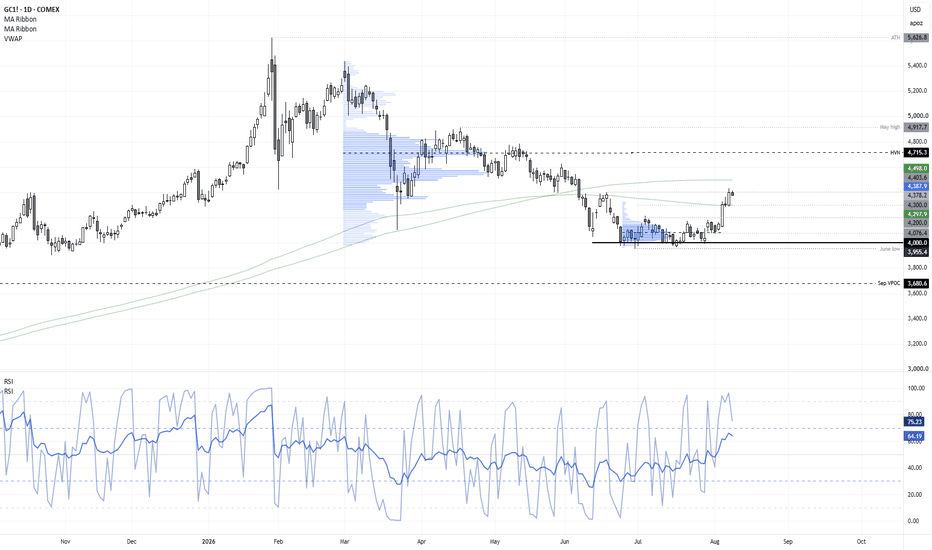
Gold Holds Firm as US Dollar Momentum Starts to FadeGold has retraced for a fourth week, with a small bullish hammer respecting the 50-week EMA and weekly VOPC showing demand around 4300. It also suggests bears are losing steam, given bearish volatility is waning. Note the bullish engulfing candle on the daily around the 50-day EMA.
Prices are now consolidating around the upper half of last week’s range. The near-term bias is to seek dips within last week’s range while prices hold above last week’s low, with 4500 and 5600 being possible upside targets.
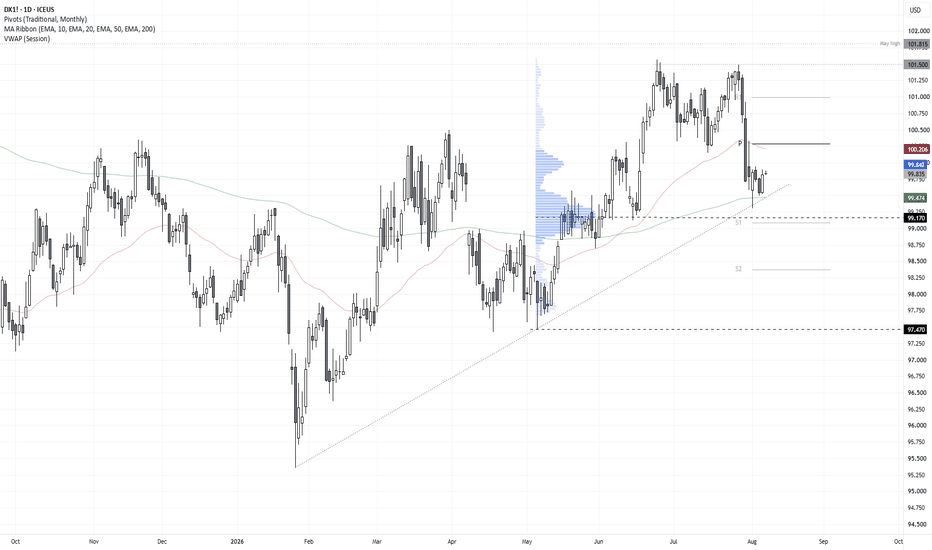
But one thing that has really caught my attention is how gold has remained supported despite the strength of the US dollar index. Given bullish momentum is waning on DXY, even a minor pullback on the dollar could benefit gold over the near term. A break beneath last week’s low invalidates my near-term bullish bias, or a sudden spike of bearish volatility could serve as an early warning sentiment has changed.
MS
Nikkei 225 Eyes 66k as Wall Street ReboundsThe daily chart shows a potential tweezer bottom at 63,733 - and a double bottom at the same level on the 4-hour chart. A potential falling wedge pattern is also forming, which can be a bullish continuation pattern which projects a target near its cycle highs, just below 70k. Also note support was found around the 100-day EMA and the RSI (2) reached oversold recently and is now moving higher to suggest a swing low may have formed.
While I am not fully convinced yet that a direct rally to 70k is on the cards, I do see potential for a rally over the near-term.
Wall Street rallied overnight, the the KOSPI 100 - which shares a stronger correlation with the Nikkei - is holding above support. If the KOSPI can take Wall Street's lead, the Nikkei could follow.
MS
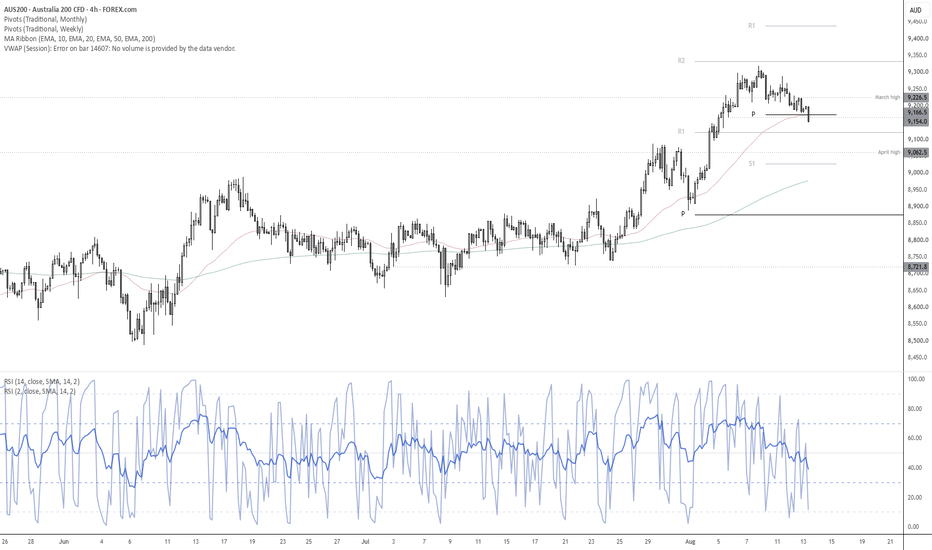
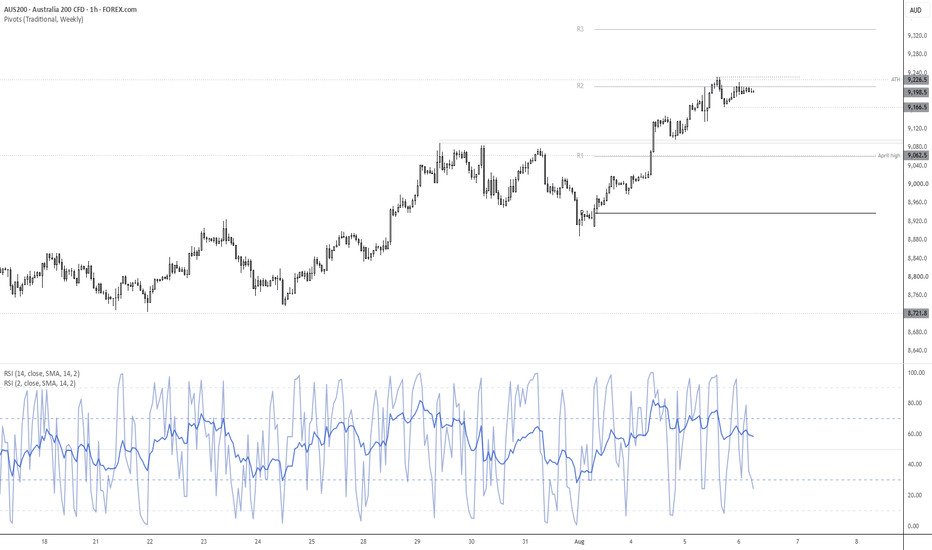
9100 In Sight for ASX 200 Bulls?While prices have effectively been flat this week, there are subtle clues that bullish setups may be building. Thursday’s bullish candle was accompanied by the highest volume in a month, while the daily increase in open interest was also unusually strong. Both point to solid demand for SPI 200 futures around the 50-day averages.
The 4-hour chart shows a bullish pinbar marking a higher low around 8960. As long as prices hold above that level, my bias is for a break above 9060 and a move towards the 9100–9125 resistance zone.
Should bulls receive a strong enough catalyst, the 9200–9224 zone could also come into view if the anticipated bounce extends far enough.
MS
USD/JPY Bears Pushing Their Luck?We’re coming up to five full days since USD/JPY began selling off. Or four days, if counting from the 367-pip selloff that could have been the MOF intervening — potentially taking advantage of the momentum of an already weakening USD/JPY.
The reason I highlight this is because bears are slowly losing steam. And with USD/JPY having fallen over 750 pips from last week’s high to yesterday’s low, I suspect bears may be pushing their luck by wading in around current levels.
Also note the lower wick on yesterday’s candle, which formed a bullish hammer. And with the January low not too far away, I think it is time to monitor this pair for a potential inflection point.
Should US PPI or CPI come in hot, it could rejuvenate bets of a Fed hike and help USD/JPY bounce.
This post is more about observational awareness than action. I just feel that chasing the bearish move this late could be pushing one’s luck.
MS
GBP/USD Rebounds on UK Data, but Bears Remain in ControlThe US dollar rebounded on Thursday thanks to hot producer prices and rising oil, which increased the odds of further Fed hikes. This saw GBP/USD form a decent bearish candle by the day’s close, after printing two small bearish reversal candles beforehand.
UK output data came in slightly hot and has helped GBP/USD rebound from yesterday’s lows. So I am now seeking evidence of a swing high on the intraday timeframes, while retaining a bearish bias as long as GBP/USD remains beneath this week’s high.
Note the monthly pivot point at 1.3548 as a potential resistance level. A break of today’s low and the 590-day RMA could open up a run towards the 1.3475 swing low. A break beneath there brings the 1.3451 high-volume node (HVN) and 200-day EMA into focus, ahead of the monthly pivot just above the 1.340 handle.
MS
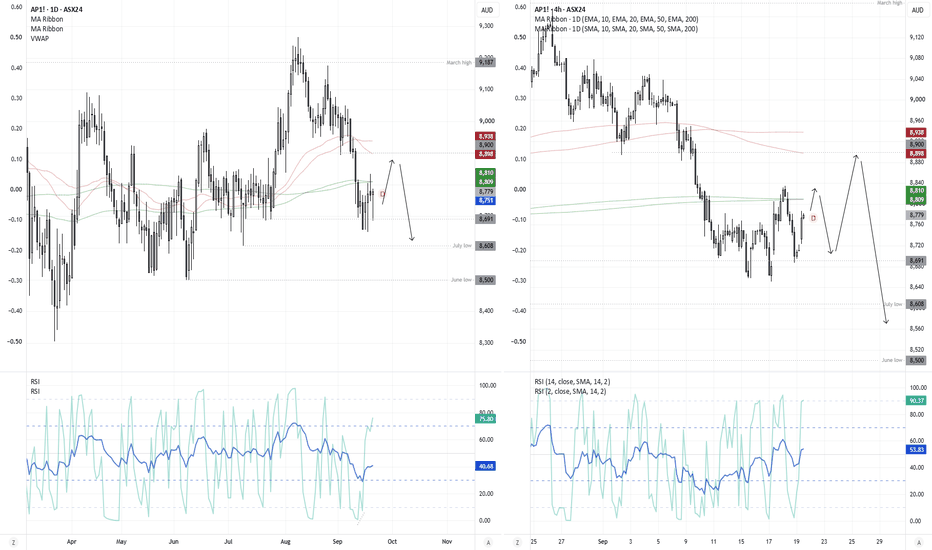
SPI 200 Bulls Tease Break of 200-day MAsAs we’ve already seen a sizeable selloff on the SPI 200 (ASX 200 futures chart), with support found around 8700, I’m seeking another leg higher.
But it is worth noting that corrective price behaviour can be more erratic and choppy than trending moves, like we saw during the selloff. Therefore, we’re not seeking large moves or looking to hang around longer than necessary.
Today’s low once again found support around 8700, while the 200-day SMA and EMA sit around 8810. And with the initial momentum of the day already fading, bears may be seeking to fade moves towards the 200-day averages or last week’s high for a short-term mean-reversion trade lower.
Beyond that, I fancy its chances of eventually breaking above last week’s high and at least closing the gap from the 8894 swing low.
So if we see a move lower ahead of a breakout of last week’s high, bulls could also seek dips while prices hold above this week’s opening gap, in anticipation of a breakout.
A move beneath gap support or Friday’s low makes bullish setups less appealing, while a break of last week’s low could open the way for a run towards the July low just above 8600. A break beneath that would then expose 8500.
MS
ASX 200 Headed for 8400?The ASX 200 has just suffered its worst week in six months, thanks to renewed bets on RBA and Fed hikes amid soaring oil prices and bond yields. We are only halfway through the month, yet it already seems likely the ASX will snap its five-month winning streak. Signs of a reversal were there, given August’s shooting star marked a failed attempt to hold above the prior record high.
Interestingly, the ASX is narrowly lower over the past 12 months despite a particularly volatile period. The fact we have seen such wild swings around record highs reminds me of the saying, “tops are a process, bottoms are an event”. It also makes me wonder whether we could be witnessing a much deeper pullback. The ASX could fall to 8400 and still remain within its one-year range, so from that angle such a move seems plausible under current conditions — unless a bullish catalyst arrives, of course.
That said, it is not uncommon to see prices retrace early in the week following a sell-off the week prior. That means bears may want to first see whether prices can recoup some of last week’s losses before rejoining the bearish move.
Ultimately, my bias remains bearish while prices remain below 9000, with 8400 the minimum downside target. The March low also comes into view on a break beneath it. Though I am not sure we will see a bounce back to 9000, traders may want to keep a close eye out for reversal signals on the daily chart or lower timeframes.
MS
CAC 40 Holds Support After Extended SelloffThe CAC has fallen just under 6% from its record high in around one month, and mostly in a straight line. The fact that August was a bearish outside month coupled with a bearish divergence suggests this pullback could have further to go.
However, perhaps it can bounce over the near term, given it is trying to form a base around its 200-day EMA and July low with a bullish divergence on the daily RSI (2).
But bulls may be treading a fine line to try and squeeze a decent reward to risk ratio at current levels. Ideally prices could pull back within this week’s range while holding above 8235 to increase the potential R/R. A break above Monday’s high invalidates the weekly pivot point and could assume a move towards the weekly R1, near the 8400 handle.
But with the monthly key reversal candle and dominant bearish momentum on the daily chart, bears may be seeking to reload and drive it beneath 8200. Note the June low sits around 8100 for a potential downside target.
MS
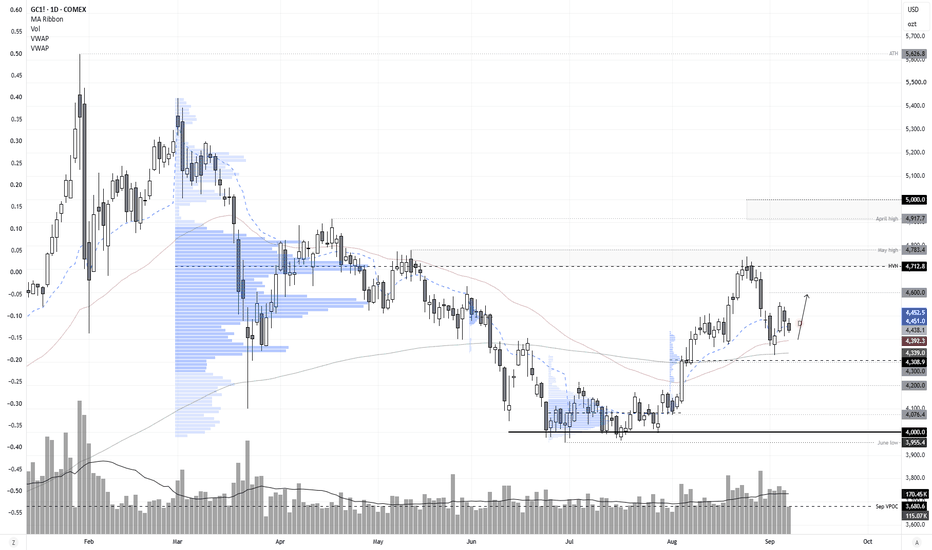
Gold Pulls Back Though Support May be at HandWe saw gold perform a solid bounce from its 200-day EMA on Wednesday and Thursday. Above-average volume suggests it was accompanied with bullish initiation as opposed to just short covering. While prices are retracing for a second day, volumes have dropped to suggest this is part of a minor retracement against that original 2-day bounce.
With the 50 and 20-day EMAs nearby for potential support, my short-term bias remains bullish while prices hold above Wednesday's low. 4600 is a potential upside target.
Keep in mind we have US PPI and CPI data on Thursday and Friday. If they come in hot and rekindle bets of Fed hikes, gold could struggle.
MS
AUD/JPY Pullback Takes Shape After Nine-Day RallyAUD/JPY rallied 4% from its post-intervention low before momentum turned sharply lower. Tuesday’s shooting star ended a nine-day winning streak, with selling accelerating on Wednesday.
I suspect USD/JPY has topped for the year, which adds to downside risks for AUD/JPY. However, continued strength in AUD/USD could limit the decline, making a clean rollover less certain.
AUD/JPY is holding above a cluster of support around 112.60, including several moving averages, last week’s VPOC and the weekly pivot. A higher low on the 4-hour chart hints at a bounce, though bears may use a move towards 113 or the weekly R1 pivot to seek fresh short opportunities.
MS
USD/JPY Volatility Rises on BOJ CommentsBOJ Member Takata has suggested that the BOJ could now decide on policy as a per-meeting basis, which has generated some excitement of a more aggressive hiking path. We still have ISM and NFP reports to go for the week, but I outline why I am still seeking evidence of a swing high on the USD/JPY daily chart.
MS
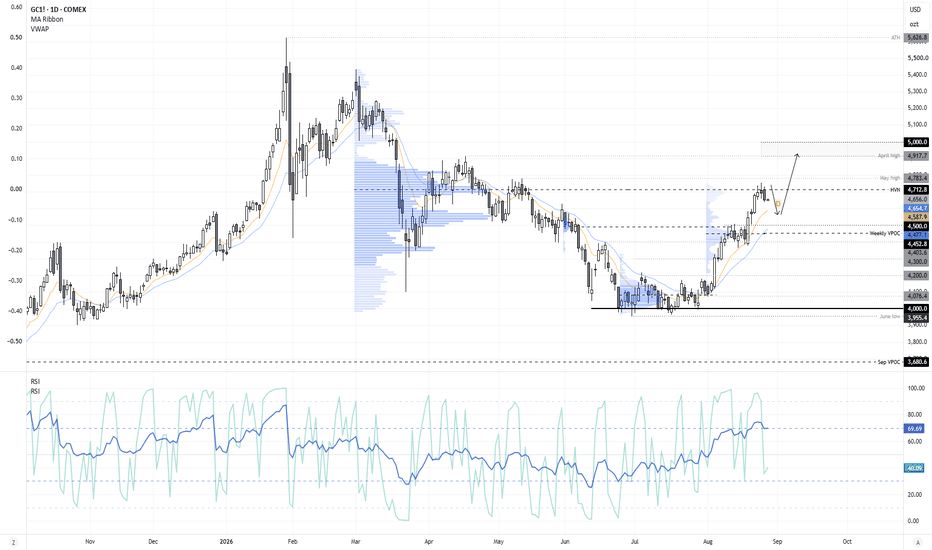
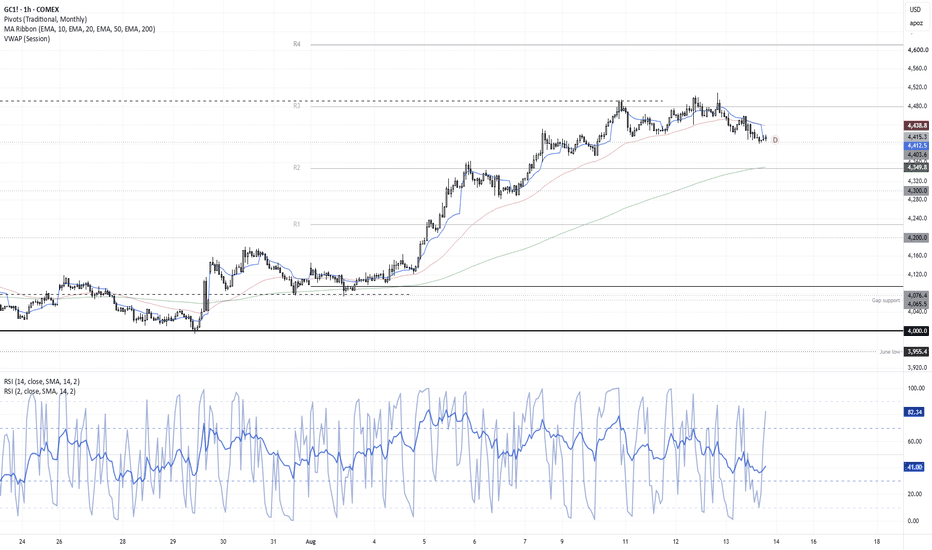
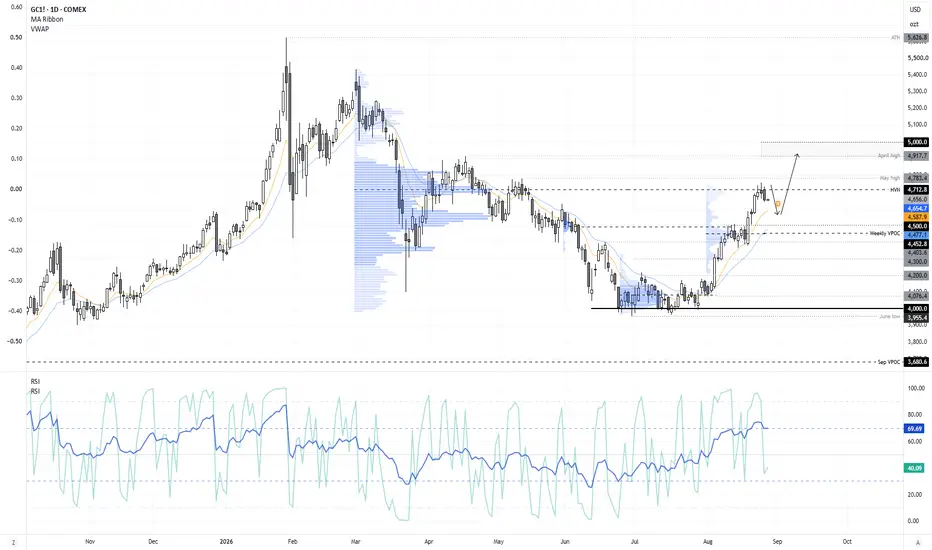
Gold Pullback Risk Builds Below 4,700 ResistanceGold futures have stalled around the 4,700 handle, with price also running into the 4,712.8 high-volume node and resistance just beneath the May high. Wednesday’s small bearish engulfing candle adds to the case for a near-term pullback, particularly with momentum looking stretched.
The RSI (14) reached overbought territory on Tuesday, while the faster RSI (2) formed a bearish divergence from its own overbought zone. That does not necessarily point to a major reversal, but it does suggest the latest leg higher may be losing momentum.
A shallow retracement remains my base case for now. The 10- and 20-day EMAs are the first areas to watch, while the 4,500 handle and weekly VPOC at 4,458 could provide stronger support if selling pressure builds. A move into that zone may also attract dip buyers given the strength of the broader trend.
Bears may therefore look to fade rallies back towards the May high, while bulls will want to see a clean break above that resistance before assuming the next leg higher is underway. If that happens, the 4,918 April high comes back into focus, followed by the psychological 5,000 handle.
MS
AUD/NZD Technical Analysis: Bearish Momentum Builds After Six-WeThe Australian dollar delivered a relatively subdued and mixed response to Australia’s latest employment report. AUD/USD barely moved once the initial volatility faded and was trading around 0.1% lower at the time of writing.
Price action across the crosses has been more revealing. The Aussie edged lower against the euro and continues to threaten a downside break against the British pound, while AUD/JPY and AUD/NZD are displaying the more interesting technical setups.
AUD/JPY has lost momentum following its strong rebound from the post-intervention low, with Tuesday’s shooting star ending a nine-day winning streak before selling accelerated on Wednesday. AUD/NZD is also showing signs of fatigue following its sharp six-week rally, leaving both crosses vulnerable to further downside over the near term.
MS
Bond Markets Have the Nasdaq on EdgeWith the 30-year Treasury yield rising to its highest level since 2007 — just ahead of the GFC — Wall Street traders are taking notice. I look at the Nasdaq and explain why I suspect new lows may come before new highs, taking positioning in Nasdaq and VIX futures into account.
MS
ASX Retreats From highs, But Trend Remains FirmsI began the day wondering if the ASX could be on the cusp of a bullish breakout from a flag. While that thesis being tested right now, I still see the potential for it to break to new highs in the coming weeks - given the strength if the rally that led thew ASX into its recent record high.
MS
USD Bulls Case Builds - Though NFP Decides Its FateWith Fed fund futures implying a 54% chance of a September hike, today's NFP report could decide which side of 50% those odds shift by the weekly close. The US dollar has been battered but showing signs of promise around support - so I take a closer look at the dollar index, NFP data and a high-level view of FX majors.
MS
USD/JPY Hints at a Bounce - Though Risks RemainVolatility for the yen remains elevated, though lower than what it was at the end of July. And with USD/JPY holding above support, it is showing the potential for a bounce. Still, risks for the downside remain with the US and Japan joining forces to control yen strength. I therefore suspect bears will be seeking evidence of swing highs, in anticipation of another leg or two lower.
MS