Cross Asset FOMC Reaction levels To WatchUSDJPY
USDJPY is in a sharp bearish impulse followed by a corrective rebound. The current bounce is testing into a retracement/resistance structure after the sell-off. The key question is whether this rebound is only a bear-market correction before a continuation lower, or whether price can reclaim enough structure to suggest a larger recovery.
EURUSD
EURUSD is trading near the lower part of its recent range/decline and appears to be approaching a measured support/equality objective area. The focus should be on whether the pair forms a reversal from this lower support region or breaks cleanly lower, which would confirm downside continuation.
S&P 500
The S&P 500 is in a controlled pullback/channel decline, not an outright breakdown yet. Price is moving lower beneath short-term resistance, with downside projections marked below. The important point is that it remains corrective within the structure, but reclaiming resistance would be needed to confirm a turn higher.
Gold
Gold is consolidating/correcting after a larger prior advance. Price is moving sideways – to lower beneath resistance, with downside projection levels marked. We are looking for a final downside test before a potential reversal, rather than chasing weakness immediately.
GBPUSD
GBPUSD is also in a corrective decline, trading beneath resistance with downside projections still active. The structure is similar to EURUSD: lower support/equality levels are in focus, but confirmation is needed before assuming reversal.
DXY
DXY is the relative strength chart on the dashboard. It is pushing higher and testing retracement and resistance levels after a recovery. The key issue is whether DXY can break and hold above resistance or whether it rejects there and allows relief rallies in EURUSD/GBPUSD/Gold.
Cross-Asset Market Message
USD strength is pressuring EURUSD, GBPUSD, Gold, and equities, while USDJPY is behaving differently due to yen strength / risk-off dynamics. Several markets are approaching measured objective zones where reaction risk is elevated. XAUUSD Watching 4105 Equality Objective for Bullish Reversal SetWatching 4105 Equality Objective for Bullish Reversal Setup
Gold remains in a corrective phase, with price working lower inside the short-term descending structure. The key downside area to monitor is the 4105 equality objective, which aligns closely with the 4510 pivot/VPOC reference from the composite profile. This confluence makes the zone important for assessing whether the correction is nearing exhaustion.
From that area, the preferred setup is to watch for bullish reversal patterns — such as a failed breakdown, bullish engulfing candle, momentum divergence, or reclaim of intraday structure — to engage on the long side.
If a reversal develops from the 4105 region, the first upside objective would be a test of the descending trend-channel resistance near 4400. A break above that level would improve the short-term structure and suggest that a larger recovery may be developing.
However, risk remains if sellers maintain control. A loss of the 3940 swing low would add weight to the idea that the broader monthly corrective sequence is still unfolding. In that scenario, Gold could extend into a deeper correction, with the next major downside target coming in around the 3380s.
Key Levels
Primary downside objective / support: 4105
Confluence: Equality objective + composite profile VPOC / pivot region
Bullish trigger: Reversal pattern from the 4105 zone
First upside objective: 4400 trend-channel resistance
Bearish invalidation / risk level: Loss of 3940 swing low
Deeper corrective target: 3380s Key Test For Nasdaq BullsNasdaq is currently testing a high-confluence resistance zone where several important technical factors are synchronizing: the symmetry swing resistance, the 78.6% retracement, and the volume profile resistance area around VPOC and VAH. This makes the current region a meaningful decision zone rather than a clean continuation area. After the strong recovery from the recent low, price has moved directly into the upper end of the prior value area, where trapped supply and prior acceptance can create a reaction. Because of that, a pullback from this zone is a reasonable scenario before any larger continuation attempt can develop.
On the H4 execution chart, the rally from the low has been impulsive, but it is now extended into the measured symmetry resistance and profile resistance cluster. The orange resistance box marks the area where price is pressing into the prior range supply, and the nearby 78.6% retracement adds further confluence. The fact that price is testing this zone after a fast vertical move increases the risk of short-term exhaustion. A corrective pullback from here would be structurally healthy, especially if price can hold above the reclaimed mid-range and form a higher low rather than fully rejecting back into the previous lows.
The volume profile is especially important here. Price has rallied back into the VPOC, where the highest traded volume of the prior range sits, and is also testing the VAH, which often acts as resistance when price returns from below. If Nasdaq cannot build acceptance above the VAH, then the market may rotate lower back toward the value area or toward the nearest H4 support. However, if price accepts above the VAH and holds the 78.6% retrace as support, that would signal strength and could transition the structure from recovery into continuation.
The higher-timeframe chart still remains constructively bullish, with price holding inside a rising channel and maintaining the broader sequence of higher highs and higher lows. This means any H4 pullback into support should initially be viewed as corrective within the larger bullish trend, unless the pullback becomes impulsive and breaks key higher-timeframe support. The weekly/daily structure still supports the idea that the broader trend is intact, but the H4 is now at a resistance cluster where a pause or retracement would be normal.
Overall, Nasdaq is at a key reaction area, with symmetry swing resistance, the 78.6% retracement, VPOC, and VAH all aligned. The preferred short-term scenario is a pullback or consolidation from this resistance zone, followed by an attempt to form a higher low. If price holds the reclaimed support structure, the broader bullish trend can resume. If it fails to accept above the VAH and loses the H4 support base, the pullback can extend deeper into the prior value area before buyers regain control. CADJPY Daily Trade Setup 30/7/26CADJPY shows strong multi-timeframe Elliott Wave alignment, with the higher timeframe maintaining a broader bullish structure while the H4 chart develops a short-term correction within that trend. This suggests the current H4 weakness may be part of a larger continuation setup rather than an isolated reversal.
On the weekly timeframe, the bullish outlook remains valid as long as price holds its higher-low structure and key Fibonacci support. The broader wave count still favors a corrective pullback inside an ongoing uptrend, rather than a full bearish reversal. The main focus is whether this correction is forming as an ABC pattern, triangle, or complex consolidation before the next upside move begins. On the H4 chart, price action appears to represent the execution phase of that broader view. If CADJPY continues to compress inside a channel, wedge, or triangle while respecting higher-timeframe support, the correction may be nearing completion. A sweep of liquidity into support followed by a strong reclaim would offer a clearer sign that the pullback has ended and bullish momentum is returning.
The most important factor is the overlap between higher-timeframe support and the H4 termination zone. If the H4 correction completes near daily or weekly Fibonacci support, a prior wave-four area, or rising channel support, the probability of a bullish continuation increases. A break above H4 corrective resistance would be the first signal of a trend shift, while reclaiming the latest lower high would provide stronger confirmation of a new impulsive move. Overall, CADJPY remains constructive across timeframes, with the preferred scenario calling for a short-term correction into support before another leg higher. This bullish view stays intact while the higher-timeframe higher-low structure holds. A sustained move below that support would weaken the setup and point to a deeper correction. SP500 Daily Trade Setup 27/7/26The S&P 500 pivot for the week is 7430/7440, and the reaction around this level is likely to define the next directional leg. On the H4 chart, price is currently trading inside a broad corrective range, with a rising support line from the prior lows and a descending resistance line from the recent highs creating a large compression structure. The 7430/7440 area sits near the upper boundary of this structure and therefore acts as the main decision point: acceptance above it would favour bullish continuation, while rejection from it would keep the market locked in a corrective sequence.
The weekly chart remains broadly constructive, with price holding inside a strong rising channel after a powerful impulsive advance. However, the recent weekly action also suggests the market may be working through a corrective pause beneath the latest highs. This means the broader trend remains bullish, but the short-term path depends on whether the H4 corrective structure resolves higher or extends lower first. If bulls can reclaim and hold above the 7430/7440 pivot, the weekly structure would support continuation toward the next upside extension levels, with the H4 chart likely transitioning from correction into expansion.
Below the pivot, the H4 structure still carries corrective risk. A rejection from 7430/7440 would likely keep price rotating within the current range, with downside focus returning toward the rising trendline support and the lower Fibonacci retracement zones. The projected downside path suggests that failure to hold the pivot could trigger another liquidity sweep into the lower range before a stronger base forms. In that case, the move would still be viewed as corrective while the broader weekly channel remains intact, but timing for upside continuation would be delayed.
Overall, 7430/7440 is the weekly control level. Holding above it shifts the bias toward bullish continuation and opens the door to fresh highs, while rejection below it keeps the S&P 500 vulnerable to another H4 corrective leg. The preferred higher-timeframe view remains constructive, but the immediate execution bias should be dictated by price acceptance or rejection around the 7430/7440 pivot. BTCUSD Daily Trade Setup 24/7/26Bitcoin is currently presenting a corrective sequence across both the H4 and weekly timeframes, with the H4 chart showing price pulling back inside a short-term descending corrective channel after the recent recovery leg. The move lower appears controlled rather than impulsive, with price respecting a series of lower highs while still holding above the broader H4 support base. This suggests the current decline is more likely a corrective pause within the larger recovery structure, rather than the start of a full bearish reversal. The key execution focus is whether Bitcoin can complete this H4 corrective leg through either a final liquidity sweep into support or a clean breakout above the descending channel resistance.
On the weekly timeframe, the broader structure also supports a corrective interpretation. Bitcoin remains within a larger bullish cycle, but the current phase appears to be a retracement or consolidation following the prior impulsive advance. From an Elliott Wave perspective, the weekly chart can be viewed as working through a corrective sequence before the next larger directional expansion. As long as the weekly higher-low structure and major Fibonacci support zone remain intact, the correction should be treated as a pause within the broader bullish trend rather than a full macro reversal.
The key point is that both timeframes are aligned around the same idea: H4 correction inside a weekly corrective sequence, with the market searching for a higher-low base before attempting continuation. If the H4 channel breaks to the upside and price reclaims the nearby resistance cluster, that would be the first sign that the corrective sequence is completing and that Bitcoin is preparing for another expansion leg. If price instead loses the H4 support base, the weekly correction likely extends deeper toward the next Fibonacci support levels before a durable low forms.  Short
Short
 Long
Long
EURJPY Daily Trade SetupThe EURJPY chart presents a constructive multi-timeframe bullish setup, supported by a constructive weekly Elliott Wave thesis on the higher timeframe. The weekly chart on the right shows price trending firmly higher within a rising channel, with the broader structure maintaining a clean sequence of higher highs and higher lows. From an Elliott Wave perspective, the advance appears to remain impulsive rather than exhausted, with the current consolidation likely representing a corrective pause within the broader bullish sequence. As long as price continues to hold above weekly channel support and the prior higher-low structure, the thesis remains that EURJPY is preparing for another upside leg toward the next Fibonacci extension zones.
On the H4 execution chart on the left, EURJPY is building a clear base above ascending trendline support after reclaiming the lower range. The recent consolidation appears to be forming a continuation structure, with price compressing beneath nearby resistance while maintaining a sequence of higher lows. This fits well with the weekly Elliott Wave view, as the H4 price action looks like a smaller corrective structure developing inside the larger bullish wave count. A short-term pullback or liquidity sweep into the rising support zone could therefore provide the next execution opportunity before continuation higher. The orange projection path suggests a potential dip, reclaim, and expansion phase, targeting the upper Fibonacci and channel resistance levels above.
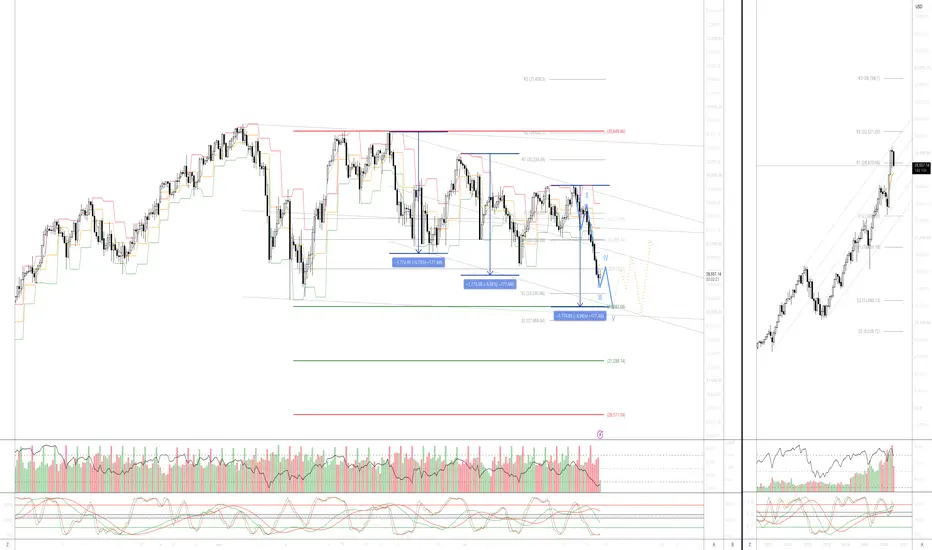
The key bullish invalidation sits below the H4 ascending support and the recent major swing low. As long as EURJPY continues to hold that rising support structure, the broader thesis remains focused on upside continuation in line with the constructive weekly Elliott Wave count. A sustained break below the H4 higher-low base would weaken the execution setup and suggest a deeper retracement is underway, while a higher-timeframe break below weekly channel support would be required to challenge the broader bullish Elliott Wave thesis. USTEC Trading The Complex Correction CycleNASDAQ — Multi-Timeframe Overview
The H4 execution chart (left) shows a harmonic-driven decline resolving into a completing 5-wave Elliott impulse lower. Price rolled over from descending channel resistance and is unfolding in a clean five-wave sequence, with the measured Fib legs (blue boxes) stacking into progressively deeper targets. The harmonic symmetry of the swings—each leg respecting proportional Fib-measured moves—is guiding price toward the broader equality objective near the 28K zone. Critically, this final wave-5 extension is projected to sweep liquidity beneath the prior major swing low, a classic stop-run that often marks the exhaustion point of a corrective sequence. With momentum rolling over in confluence, the setup points toward downside exhaustion and a bullish reversal reaction once that terminal target is tagged and sub-swing-low liquidity is taken.
The higher-timeframe chart (right) remains constructively bullish, riding its rising channel with higher highs and higher lows intact near the upper Fib band. The H4 flush into 28K reads as a corrective liquidity sweep within the larger uptrend, not a structural break. As long as HTF channel support and the prior higher-low framework hold, the dominant bias stays up—reinforcing the case that the wave-5 sweep is a buy-the-dip liquidity event rather than the beginning of a trend reversal.
The Nasdaq is potentially completing a harmonic five-wave decline into the 28K equality objective, engineered to sweep liquidity below the prior major swing low, then align back with the bullish higher-timeframe trend. The highest-probability path is liquidity grab → downside exhaustion → bullish reversal, with invalidation only triggered on a sustained HTF break of channel support should the sweep fail to reclaim.  Long
Long
 Long
Long
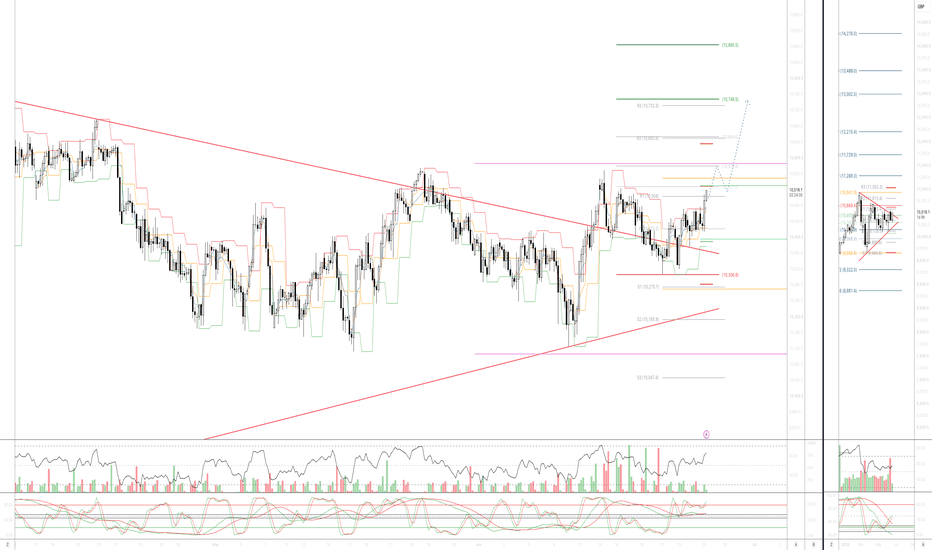
DXY Bullish Consolidation Before Targeting 102.50 TestDXY, with price continuing to respect a broader rising channel structure. After a strong advance into the recent swing high, the index has been consolidating in a controlled pullback rather than showing impulsive bearish continuation. This type of sideways-to-down digestion often suggests accumulation, especially while price remains above key higher-timeframe support and within the lower half of the ascending channel.
The current structure shows DXY coiling near channel support, with multiple short-term moving averages beginning to flatten and compress. This indicates that downside momentum may be fading. A breakout above the nearby descending resistance line and recent consolidation highs would provide confirmation that buyers are regaining control. From there, the projected path suggests a potential continuation toward the upper channel region, with intermediate resistance levels acting as logical profit-taking zones along the way. Momentum studies also appear to be resetting from overheated conditions, giving the long trade more room to develop if bullish momentum returns. Volume has been relatively mixed during the pullback, supporting the idea that selling pressure is not yet dominant.
Overall, the price action favours a bullish continuation scenario, where DXY holds structural support, breaks the corrective trendline, and resumes its broader uptrend. A failure below the channel support would weaken the setup, but as long as that area holds, the chart presents a constructive bullish scenario!  Long
Long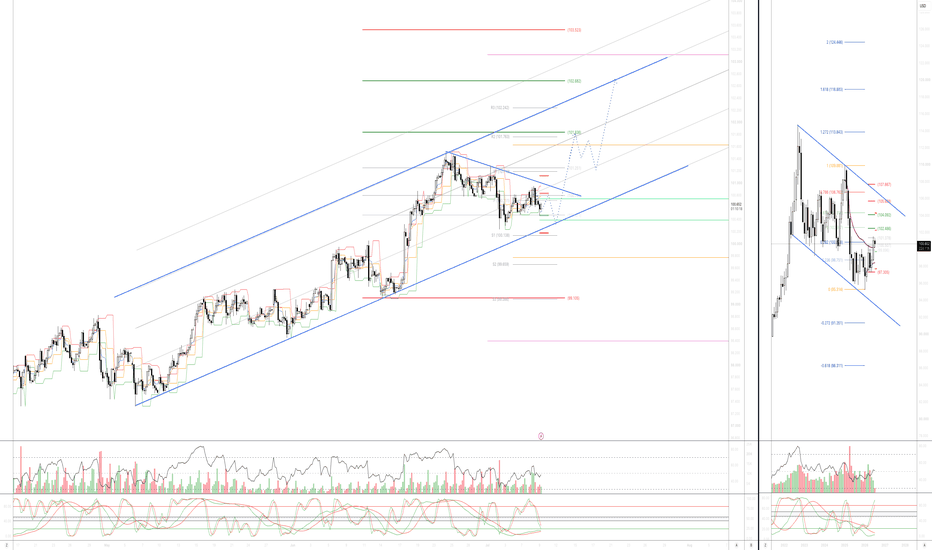
Long

Long
Long

 Long
Long