Using CME Group Event Contracts For FOMC & End of The Month ES1! Looking for additional tools to use in your day trading for event days like FOMC and Month End? Watch Anthony Crudele dive into CME Group's Event Contracts in his latest video. See him analyze the E-mini S&P 500 using AVWAP and Bollinger Bands.
Tradovate publications
March E-Mini S&P 500 Index Futures Weekly Chart - 12/18/23March E-mini S&P 500 Index futures continued the rally that began at the beginning of November, taking out the recent high from the last week in July. MACD recently experienced a bullish cross by crossing above its signal line. That relationship is widening, which indicates a continuing bullish trend. RSI is getting closer to being overbought at 70, though bearish divergence might be in play as the RSI is lower than its peak in August, even though price has taken out the high in August. This could indicate that momentum is weakening, and a reversal might occur. If the bullish trend continues, resistance might be found at the April 2022 high of 4,860. A reverse to the downside could find support at the 61.8% Fib level (4,530) and at the 52-week moving average (~4,400).
Please Note:
Commentary and charts reflect data at the time of analysis (12/15/23). Market conditions are subject to change and may not reflect all market activity.
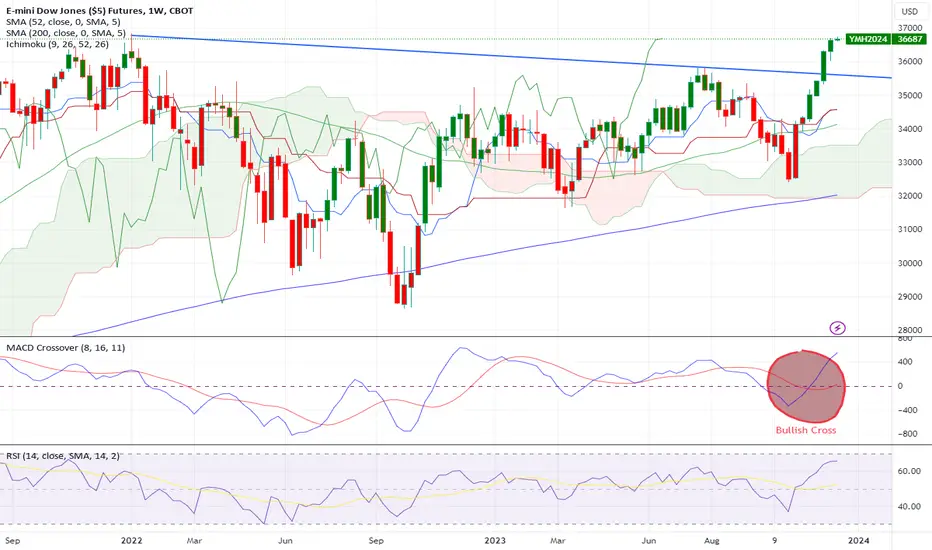
December E-Mini Dow Jones Index Futures Weekly ChartDecember E-mini Dow Jones Index futures continued the uptrend that saw a break above the resistance line formed by connecting the high in January 2022 with the high in July 2023. With CPI, PPI, and a Fed announcement this week, there are certainly enough possible catalysts to turn this market to the bearish side. The MACD showed a bullish cross about a month ago and is not indicating a slowdown in momentum. The RSI at 62 on 12/8 indicates that there still may be room for price to continue bullish. Should the uptrend continue, a possible target (and resistance is the previous high of 37,906. A reverse to the downside might see the 61.8% Fibonacci retracement level (34,790) as support.
Please Note:
Commentary and charts reflect data at the time of analysis (12/08/23). Market conditions are subject to change and may not reflect all market activity.
December E-Mini Russell 2000 Index Futures Weekly Chart: 12/7/23Last week we saw the December E-mini Russell 2000 Index futures continues its bullish run with its third consecutive green candle closing into the Ichimoku cloud and above its 52-week moving average. With this move up, the MACD showed a bullish cross indication by crossing its signal line. RSI is trending up along with price. A continuation of this uptrend might find resistance at the top of the Ichimoku cloud (~1,906) and at the 200-week moving average (~1,930). A reversal to the downside might find support at the recent lows at the end of October (~1,640).
Please Note:
Commentary and charts reflect data at the original time of analysis (12/01/23). Market conditions are subject to change and may not reflect all market activity.