2025 GBP/USD Outlook Fundamental & Technical PreviewFundamental analysis
WHSELFINVEST:GBPUSD showed resilience in 2024, falling just 1% across the year. The pair experienced strong gains between April to September, rising from a low of 1.23 to a high of 1.34. However, GBP/USD fell 5% in the final quarter of the year amid notable USD strength, pulling GBP/USD from 1.34 to the 1.25 level where it trades at the time of writing.
While the pound booked losses against the US dollar in 2024, GBP's performance against other major peers was impressive, rising solidly against EUR, CHF, CAD, AUD, and JPY.
GBP/USD has been supported across 2024 by the BoE cutting rates at a slower pace than the Federal Reserve and by the expectation that this trend would continue in 2025. However, Donald Trump's victory in the US election, combined with the Labour government’s Budget, means that the outlook for both economies has changed, potentially impacting the direction of monetary policy in 2025 for both central banks and GBP/USD.
GBP/USD outlook – UK economic factors
Growth
The UK economy is expected to continue to grow in 2025. However, GDP could be weaker than the 1.5% forecast by the BoE owing to several key factors, including uncertainty surrounding trade and a less expansionary UK budget.
Trump’s second term in the White House brings uncertainty, and UK trade will be under the spotlight. While the UK isn’t directly in the firing line for tariffs, the openness of the UK economy means a global shift towards increased tariffs could hurt growth prospects. However, should the UK pursue and achieve closer ties with the US or the EU, this could help growth but not to the extent of reducing the impact of Brexit.
The extent of the indirect impact of trade tariffs on the UK will depend on their magnitude. The UK is already experiencing depressed growth, which Trump’s action could exasperate.
The BoE forecasts GDP growth of 0% in Q4 2024 and 1.5% in 2025. The OECD forecasts 1.7% growth, and Bloomberg's survey of economists points to growth of 1.3%.
Inflation
In November, inflation in the UK was 2.6% YoY, rising for a second straight month and remaining above the Bank of England's 2% target as wage growth and service sector inflation remain sticky.
The labour market has shown signs of easing, but unemployment remains low by historical standards at 4.2%, and wage growth elevated at 5.2%. We expect some softening in the UK job market following the Labour government’s first Budget.
Chancellor Rachel Reeves placed a major tax burden on employers with a rise in employer National Insurance contributions and an increase in the minimum wage. A broad range of UK labour market indicators point to a weakening outlook, with surveys indicating that UK firms (especially smaller firms) are scaling back hiring plans.
Although wage growth and service sector inflation were slightly firmer than expected at the end of 2024, the disinflationary trend remains intact, with core inflation well below last year's highs.
The BoE projections show CPI could reach 2.7% in 2025 before easing to 2.5% in 2026. However, this could be lower if the labour market weakens further and if growth remains lacklustre.
Will the BoE cut rates in 2025?
At the final BoE meeting in 2025, the BoE left interest rates unchanged at 4.75%, in line with expectations. However, the vote split was more dovish than expected, at 6-3 compared to the 8-1 forecast. This suggests that dovish momentum is building within the monetary policy committee for a rate cut in February.
The central bank signaled gradual, rare cuts throughout 2025 amid sticky inflation, although policymakers are increasingly concerned over the growth outlook. The market is pricing 50 basis points worth of cuts in 2025, supporting the pound.
However, this could be conservative given that the labour market could weaken considerably following the Budget. A weaker labour market will lower wage growth and impact consumption, potentially cooling inflation faster. Uncertainty surrounding trade could ease inflationary pressures further in 2025, meaning deeper cuts from the BoE than the market is pricing in. As a result, GBP could come under pressure across H1 2025.
GBP/USD outlook - US economic factors
USD strength was nothing short of impressive in Q4. The USD index jumped 5% to reach a two-year high, supported by expectations that the Federal Reserve could cut rates at a slower pace in 2025. Despite the outsized move in Q4, we expect further USD strength in 2025.
At the time of writing, US CPI has risen for the past two months, reaching 2.7% YoY in November. Core PCE is also proving to be sticky, remaining above the Federal Reserve's 2% target. Earlier confidence at the Federal Reserve that inflation would continue falling to the 2% target appears to have faded amid ongoing US economic exceptionalism and a cooling but not collapsing labour market.
Signs of sticky inflation come as the US job market remains resilient. Nonfarm payrolls for November showed 227k jobs were added. Unemployment has ticked higher but is expected to end 2025 at 4.3%, down from 4.4% previously expected.
Meanwhile, economic growth in the US remains solid. The US recorded Q3 GDP as 3.1% annually, up from 2.8% in Q2. According to the OECD, the US is expected to see strong growth among the G7 economies, with 2.8% growth expected in 2024 and 2.4% forecast for 2025.
A combination of sticky-than-expected inflation, solid growth, and a resilient jobs market suggests that the US economy is on a strong footing as Trump comes into power.
Political factors
Trump is widely expected to implement inflationary measures, including tax cuts and trade tariffs. Inflationary policies at a time when US inflation is starting to heat up again could create more of a headache for the Federal Reserve continuing with its easing cycle.
Will the Federal Reserve cut rates in 2025?
At its last meeting of 2024, the Federal Reserve cut interest rates by 25 basis points, marking the second consecutive 25-basis-point cut and following a 50-basis-point reduction in September, when it kicked off its rate-cutting cycle.
However, the Fed also signaled slower and shallower rate cuts in 2025. Fed Chair Powell’s press conference and policymakers’ updated projections confirm that the Fed will be much more cautious next year.
The Fed increased its inflation forecast to 2.5% YoY, up from 2.1%, and isn’t expected to reach 2% until 2027.
The market is pricing in just 35 basis points worth of cuts next year, and the first rate cut isn’t expected until July.
However, Trump’s policy plans will be the most significant determinant of the Fed's decisions regarding rates next year.
Technical analysis
Overview
The GBP/USD pair has been in a clear downtrend since its peak in May 2021, marked by a swing high of ~1.4205 and a subsequent low of ~1.1800 in September 2022. The recent price action suggests the pair is consolidating near key psychological and technical levels, hinting at potential future moves. This analysis incorporates a refined Fibonacci retracement that spans the broader bearish cycle for a more holistic perspective.
Long-Term Fibonacci Analysis
The updated Fibonacci retracement has been applied from the May 2021 high of ~1.4205 to the September 2022 low of ~1.1800. This adjustment provides a better representation of the long-term market structure and aligns key levels with historical price reactions:
23.6% Retracement Level (~1.4007): This level aligns closely with the psychological 1.4000 level, making it a key resistance area should the pair see a bullish recovery.
38.2% Retracement Level (~1.3884): This level historically coincides with areas of consolidation and resistance, suggesting it could act as a ceiling for mid-term rallies.
50% Retracement Level (~1.3785): Situated near prior structural highs, this is a crucial midpoint for evaluating the strength of any bullish correction.
61.8% Retracement Level (~1.3660): Often referred to as the "golden ratio," this level aligns with significant historical resistance, further reinforcing its importance.
78.6% Retracement Level (~1.3548): This deeper retracement could serve as an area of rejection in a bullish recovery scenario.
Short-Term Impulse Fibonacci Analysis
Focusing on the most recent bearish impulse, the Fibonacci retracement spans from the swing high of 1.3170 (August 2023) to the recent low of 1.2384. Key levels from this retracement include:
23.6% Retracement Level (~1.2612): The price has hovered around this level recently, suggesting it acts as a local resistance point.
38.2% Retracement Level (~1.2785): This level is bolstered by confluence with horizontal resistance, making it a critical test for bullish momentum.
50% Retracement Level (~1.2850): Represents a midpoint and potential short-term rejection area.
1.618 Fibonacci Extension (~1.2139): This provides a logical downside target should the bearish trend continue.
3.618 and 4.236 Extensions (~1.1164 and ~1.0644): These deeper levels indicate the potential for significant bearish continuation in the long term.
Other technical indicators
Moving Averages
The 21-week SMA (~1.2924) remains above the current price, acting as dynamic resistance.
The 50-week SMA (~1.2785) coincides with the 38.2% retracement of the recent impulse, reinforcing its importance.
RSI and MACD
The RSI (47.96) is below the midpoint of 50, indicating bearish momentum. Watch for divergence near key Fibonacci levels.
The MACD histogram is negative, with no signs of an imminent crossover, confirming bearish pressure.
Support and Resistance Zones
Key Resistance Levels
1.2612: Recent price interactions suggest this is a significant short-term barrier.
1.2785: The 38.2% retracement of the impulse move, coinciding with the 50-week SMA.
1.3000: A psychological level with historical significance.
1.4000: The 23.6% retracement of the broader move and a long-term target for bullish recovery.
Key Support Levels
1.2384: The recent swing low.
1.2139: The 1.618 extension of the recent impulse move.
1.2000: A critical psychological threshold.
1.1164 and 1.0644: Deeper Fibonacci extensions providing long-term bearish targets.
Conclusion
The GBP/USD pair remains in a bearish trend, with key levels from the updated Fibonacci retracement offering valuable insights for both potential reversals and continuation scenarios. Traders should monitor the interaction of price with the 1.2612 and 1.2785 resistance levels, while keeping an eye on the downside targets of 1.2139 and below. The RSI and MACD confirm bearish momentum, while moving averages provide additional context for dynamic support and resistance.
A multi-timeframe approach will be crucial in navigating this pair over the coming months, with the broader trend still probably favoring the bears.
-- written by Fiona Cincotta & WH SelfInvest NASDAQ: Dancing on the Edge of a Techno-Financial TightropeMarket Overview
The NASDAQ-100 (NDX) has recently corrected by approximately 5.5% from its all-time high of 22,133 on December 16, 2024. This comes after a historic rally driven by resilient megacap technology stocks, robust earnings, and the continued dominance of AI-led innovation.
Despite the correction, the index remains up 18% year-to-date, outpacing broader indices like the S&P 500, fueled by optimism around productivity-enhancing technologies. However, macroeconomic and geopolitical headwinds could temper this growth into 2025.
Technical Analysis
Trendlines
Short-Term: The NDX remains in a rising trend channel since March 2023, with the lower boundary around 20,500 acting as critical support. A recent breach of its 21-day moving average suggests growing bearish momentum.
Long-Term: The index's long-term trendline, extending from the pandemic lows in 2020, remains intact, underscoring investor confidence in the broader tech narrative.
Key Levels
Support
Immediate support: 20,790 (50-day moving average).
Strong support: 20,500 (trendline and Fibonacci retracement zone).
Resistance
Near-term resistance: 21,900 (upper boundary of rising wedge).
Critical resistance: 22,133 (all-time high).
Momentum Indicators
RSI: Declining from overbought territory (currently at 64), signaling potential for further downside before resetting to neutral.
MACD: A bearish crossover suggests weakening momentum in the near term.
Macroeconomic Context
Interest Rates
The Federal Reserve has maintained its hawkish stance, with the terminal rate hovering around 5.75%. While inflation has moderated to 2.4%, core inflation remains sticky at 2.8%, keeping rate cuts off the table until mid-2025.
Elevated borrowing costs could weigh on tech valuations, particularly for growth companies reliant on cheap capital.
Economic Growth
U.S. GDP growth is forecasted to decelerate from 2.6% in 2024 to 1.8% in 2025, reflecting weaker consumer spending and tighter financial conditions. This slowdown could dampen earnings growth across the NASDAQ-100 constituents.
Corporate Earnings
Analysts expect NDX earnings growth of 8% in 2025, down from the blistering 14% in 2024, as cost pressures and a plateauing of AI-related tailwinds take hold.
Geopolitical Landscape
China-U.S. Relations
Increasing tensions over Taiwan and heightened scrutiny of U.S. tech exports to China remain a wildcard. Any escalation could disrupt semiconductor supply chains and impact heavyweights like Nvidia and AMD.
Europe
Persistent instability in Eastern Europe and ongoing energy challenges pose risks to multinational tech firms with significant operations or customers in the region.
Middle East
Geopolitical uncertainty stemming from conflicts in the Middle East has kept oil prices elevated (~$95/barrel). Higher energy costs could indirectly affect tech earnings by squeezing consumer and corporate budgets.
2025 Outlook
Base Case
The NASDAQ-100 ends 2025 up 8–12%, driven by resilient demand for cloud computing, generative AI, and green technology innovations. Support from stable core earnings growth and moderating inflation provides a favorable backdrop.
Bear Case
Prolonged high interest rates, coupled with weaker-than-expected global growth, lead to a flat or mildly negative year. Key risks include geopolitical flare-ups, regulatory actions on Big Tech, and waning investor enthusiasm for speculative assets.
Bull Case
A dovish pivot by the Federal Reserve in H2 2025, alongside breakthrough advancements in AI or biotechnology, propels the index to new highs (~24,000).
Conclusion
The NASDAQ-100 is entering 2025 with a cautiously optimistic outlook, balanced between robust technological trends and mounting macro/geopolitical risks. Investors should monitor key support at 20,500 and resistance at 21,900 as barometers of sentiment. While near-term volatility is likely, the index remains a cornerstone for long-term growth portfolios.
For 2025, the focus is on being smart: diligent monitoring, disciplined allocations, and adapting to shifting conditions.
"There are three ways to make a living in this business: be first, be smarter, or cheat." – John Tuld – Margin Call (2011)  Long
Long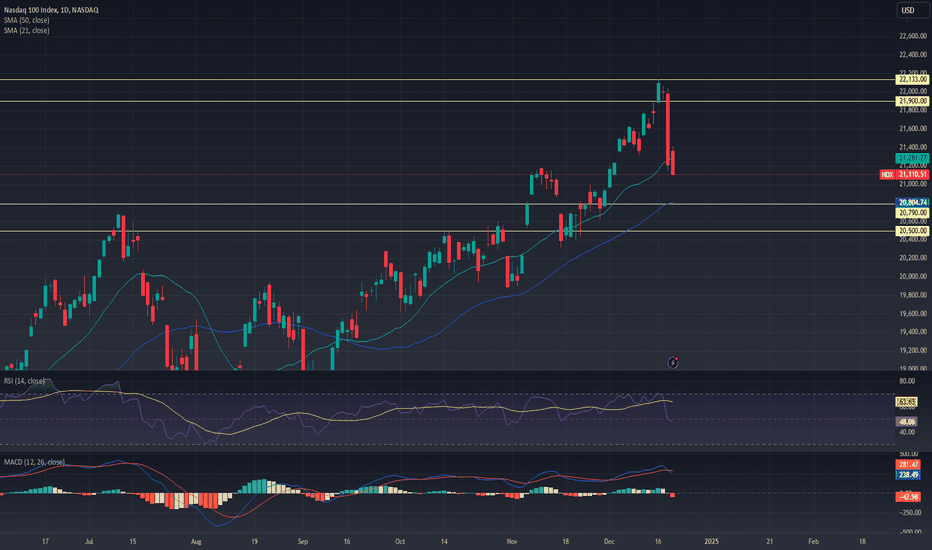
EUR/USD Finally Finds Some Support, But Can it Build a Bounce?EUR/USD Talking Points
The strength from Q3 has been mostly erased so far in Q4, with a fast sell-off developing in EUR/USD.
In late-September the pair continued to grind away at the 1.1200 handle but not even a month later the pair has dropped by more than four big figures.
Support showed up at the 1.0761 level looked at on Tuesday. The big question now is whether that can lead to some profit taking from sellers, which could build a bounce and that can remain of interest for bears looking for lower-highs.
EUR/USD has now traded lower for 15 of the past 20 days. An amazing trend by any stretch but perhaps even more so when compared to the strength that showed in the pair during the first two months of Q3. While that prior bullish trend put in a month of grind at the 1.1200 level, eventually failing, the bear move that’s come in response has been fast and heavy. There’s been only a minimum of pullback so far and any excuse for sellers to continue pushing has so far contributed to continuation.
Last Friday brought a bit of bounce. That went along with a pullback in the USD from the 200-day moving average. But support soon showed at a key zone in DXY and bulls were off to the races (and bears in EUR/USD) after this week’s open.
In EUR/USD, that resistance earlier in the week played-in right off the underside of the 200-day moving average.
At this point the challenge is chasing an oversold trend as RSI on the daily remains in oversold territory on EUR/USD. There has been a bounce showing thus far at Tuesday's level looked around 1.0761. That price is the 38.2% Fibonacci retracement of last year’s sell-off, and its confluent with a trendline originating from last year’s low.
EUR/USD Longer-Term
Just as I was saying in September when strength was all the range, EUR/USD remains in a range that’s been in-play since last year’s open. There have certainly been some clean shorter-term trends in the confines of that ranging backdrop, and we’ve made a fast move towards the support side of that range but if we do see sellers continuing to push, those values could soon come into play.
The current 2024 low plots around the 1.0611 Fibonacci level, which is the 38.2% retracement of the 2021-2022 major move. On the below weekly chart, I’ve linked that level to the shorter-term Fibonacci level at 1.0643 to create the next support zone, down.
Below that, it’s the 1.0500 level that put up considerable fight for about a month before leading to a turn a year ago.
--- written by James Stanley, Senior Strategist
Gold Goes ATH Again, How to Work Pullbacks in Overbought MarketsGold Talking Points
The massive move in gold has continued to yet another fresh ATH this morning, even with the US Dollar continue its own bullish jump.
Trying to chase an overbought market like gold can feel like trying to jump on a rocket that’s already left the Earth, but that doesn’t mean that traders have the singular choice of fading it or avoiding it. There’s the potential for pullbacks such as I’ve been following in these articles over the past few weeks.
Gold continues its massive 2024 outing with yet another fresh all-time-high today. This might sound like Groundhog Day, but the yellow metal just continues to impress even with weekly and monthly charts in overbought territory. As I asked a few weeks ago, does that even matter? Well, by the looks of price it does not, at least not at this point.
As for explanations behind the move it’s been the Fed and other global central banks pushing towards rate cuts this year that’s propelled the breakout. And even in light of strong US data that, normally, would cause the FOMC to talk up rate hike potential, a hawkish Fed seems nowhere near, and markets are still leaning heavily on the expectation for the bank to cut through next year.
Making matters more interesting is the USD backdrop with which the recent trend has run. The USD was weak in Q3 and gold broke out in mid-August and continued to run. The USD has posed a stark turn-around so far in Q4 and still, gold has run higher.
At this point there’s no evidence to suggest that the run is finished. But that still doesn’t mean that chasing and hoping is a smart way to work with the move. There’s essentially two ways of working with the long side of an overbought market. One can use breakout strategies, which can be a challenge in and of itself. This opens the possibility of buying highs or selling lows, which can be painful ordeals. It’s not an impossible way to move forward, but traders need to have rigid risk management protocol to institute these types of strategies. Or – traders can wait and try to be patient, using pullbacks on shorter time frames. This still doesn’t guarantee success but at the least, risk can be managed in a more efficient manner by using prevailing price structure and if-then statements.
While the move in gold has continued to hasten, there have been pullback setups. There was a setup leading into CPI last week, and another shorter-term after the release of the data point but before the breakout was able to extend. And then this week, there was a test below 2650, buyers holding the line there with a shorter-term higher-low opened the door for another extension of the move.
Yesterday saw bulls push all the way up to the prior ATH at 2685, again, leading to a shallow pullback to the first support listed in the article at 2670. And that has since run into yet another fresh higher-high.
Gold Fresh Highs – What’s Next?
Human psychology has a funny role in markets as it often seems like the crowd gets most bullish at highs or near resistance and most pessimistic at tests of support. But there’s also the inter-play with psychological levels, as the price of 2600.01 can feel much more expensive than just two cents above 2599.99.
We saw that play out at the FOMC rate cut last month. Gold tested above 2600 after news of the cut made its way through markets, but that was brief and short-lived as a fast pullback soon developed. The pullback from that tested below a minor psychological level at 2550, with bulls soon returning to push price back above 2600.
At this point, we’ve seen continued reticence inside of 2700 so it seems as though bulls are shying away from a test from that price so far. But, if we do see that trade, that could be an open door for buyers to take profits, which can open the door for the next pullback. In that scenario, the prior ATH at 2685 becomes a point of interest for higher-lows. If that doesn’t hold and profit taking sets in a bit more, 2675 or 2667 become of interest. And technically, we could even see a pullback drive back down to 2650 while keeping the door open for higher-highs and lows on the daily chart.
--- written by James Stanley, Senior Strategist  Long
Long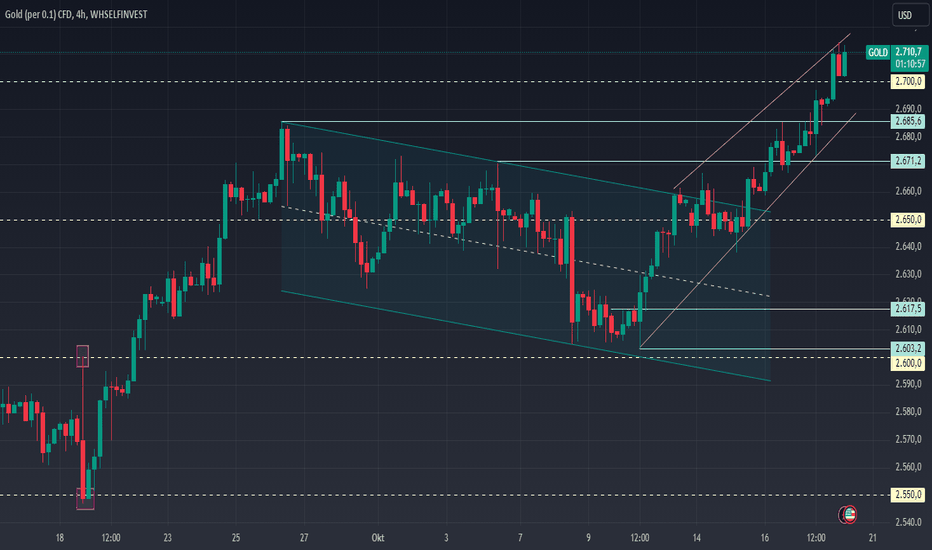
Euro Technical Analysis: EUR/USD Stalls Inside of Yearly HighEUR/USD has put in a very bullish outlay so far in Q3 trade. But last week saw bulls stall inside of the 2024 high and that brings questions to topside continuation in the pair.
EUR/USD continued the advance last week following the rate cut rally following the European Central Bank’s move two weeks ago. There was technical context for bullish continuation as the pair broke through the topside of a bull flag formation but, to date, buyers haven’t been able to push for a re-test of the yearly high at the 1.1200 handle.
There was seemingly an open door for a test of the highs last week as the pair showed three consecutive days of swing highs within 25 pips of that big figure. This week started with pullback but that also shows a bit of indecision as sellers were unable to test below last Thursday’s swing-low.
EUR/USD Bigger Picture
At this point it’s difficult to argue with the intermediate-term outlay in the pair, which has been decisively bullish since the rally began around the Q3 open. The pair was working around the 1.0700 at the time and as USD-weakness, prodded by a sell-off in USD/JPY, continued to drive DXY to fresh lows, EUR/USD continued its upward advance.
But taking a step back, the argument can be made that the pair remains in the confines of a longer-term range and last week’s respect of the 1.1200 handle further speaks to that, as that, itself, is a lower-high from the 2023 swing at 1.1275.
This sets up for an important few weeks as price remains within that shorter-term bullish trend into the Q3 close, with those very obvious resistance levels lurking overhead.
I had written about the US Dollar to finish last week, and if the USD is going to rally, it’s probably going to need some help from EUR/USD bears.
EUR/USD Shorter-Term Strategy
Sellers made a quick push at the start of this week’s trade but as noted above, they haven’t been able to make much of a mark yet. But – this does set up some additional lower-high context as last week’s stall around 1.1175 is inside of the prior high at 1.1200, which is inside of the 2023 high at 1.1275.
The 1.1140 level that I’ve been tracking in webinars is in-play as of this writing and there’s additional context for a possible lower-high up to prior short-term support, around 1.1155. If bears can defend that, the focus is on tests of deeper support. I’m tracking a Fibonacci level at 1.1081 that helped to bring the post-Fed bounce last week, and that’s followed by a swing at 1.1055.
After that is the 1.1000 level and that’s the price that was vigorously defended into and around the ECB’s rate cut.
Bears aren’t necessarily out of the woods on a first test below 1.1000, however, as the 1.09424 Fibonacci level could be a lead-in for bear trap potential on a bigger picture basis. That’s the 50% mark of the same Fibonacci retracement that set the high last year at the 61.8% (1.12697) and the low so far this year around the 38.2% (1.06152).
--- written by James Stanley, Senior Strategist
Gold Overbought Daily, Weekly, Monthly: But Does it Matter?Gold Talking Points:
Gold bulls have continued to push an impressive trend throughout 2024 and there was another extension of that this morning with another fresh all-time-high.
At this point chasing fresh breakouts in gold can be seen as challenging given that it’s now showing overbought conditions on the daily, weekly and monthly charts. But – that doesn’t mean that price has to turn. Instead, the focus can shift to pullbacks of higher-low support, like what had showed around FOMC last week.
It’s been an astounding rally in gold so far in 2024 and that’s continued through another week, with the metal getting another push-higher this morning on the back of dovish Fed comments from Neel Kashkari and Austan Goolsbee. The big USD driver for this week is unveiled on Friday with the most recent release of Core PCE, often considered to be ‘the Fed’s preferred inflation gauge.’
Until then, however, there’s numerous iterations of Fed-speak, including a speech from Chair Powell on Thursday morning. Markets have high expectations for more dovish-speak as rate expectations are currently showing a 76.5% probability of at least 75 bps more in cuts by the end of the year, standing against a current 23.5% probability of 50 bps, which is what the Fed’s projections pointed to last Wednesday.
In gold, that FOMC rate decision delivered the last pullback as prices softened down to the $2550 zone of support. That didn’t last for long, however, as bulls pounced and continued to drive through last week’s close and this week’s open, setting another fresh all-time-high.
Gold Bigger Picture: Overbought Daily, Weekly, Monthly
At this point chasing gold-higher on breakouts can be a challenge. There’s been a proclivity for bulls to soften the drive on tests of resistance or at fresh highs, thereby leading to the build of a rising wedge pattern. And there’s also the matter of overbought dynamics to consider as gold is currently showing overbought readings on all of the daily, weekly and monthly chart.
That does not mean that gold has to turn, however. The monthly overbought read started way back in April and, of course, gold has continued to drive since then. The weekly overbought reading re-appeared in early-September, just as bulls were gearing up for another breakout. And the daily overbought reading showed last Friday, and this is the first time that’s happened since April. That’s when gold began to stall and range which largely held through the Q2 close and the Q3 open.
So, overbought doesn’t mean that this is ready for reversal. It does, however, highlight the challenge of chasing and instead points to pullback potential such as the scenario I was talking about ahead of the FOMC last Wednesday.
On the below chart, I’ve highlighted the two prior episodes in 2024 when daily RSI pushed into overbought territory.
Gold Shorter-Term Strategy
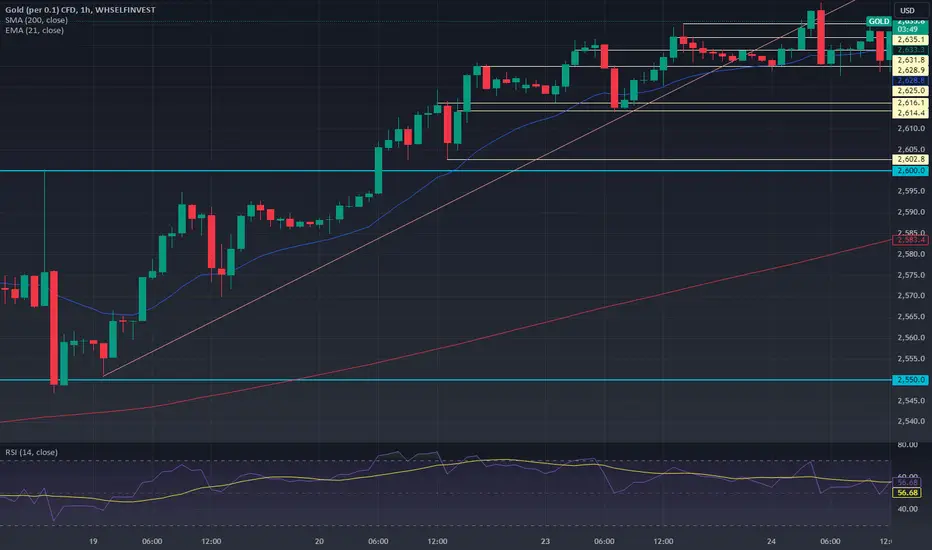
I had shared a zone on twitter this morning that was highlighting short-term resistance around the 2625 level. Bulls breached that on the way to fresh highs and it’s now back in the picture as short-term support, which is confluent with the trendline taken from the higher-low produced after the FOMC pullback last week. This is also what I’m considering as support side of a rising wedge formation, which is often approached with aim of bearish reversals or pullbacks in bullish trends.
I’m more interested in pullbacks at this point and that highlights the 2619 swing of prior resistance as a possible spot of support. Below that I have another prior swing of resistance-turned-support at 2614. If that can’t hold, the door is open to a 2600 re-test which is what held the highs just after the FOMC statement release last Wednesday. When bulls drove price above that level, the pullback showing after couldn’t even get down to 2600, holding at 2602 and this sets up a support zone of note for retracement scenarios this week.
--- written by James Stanley, Senior Strategist Long 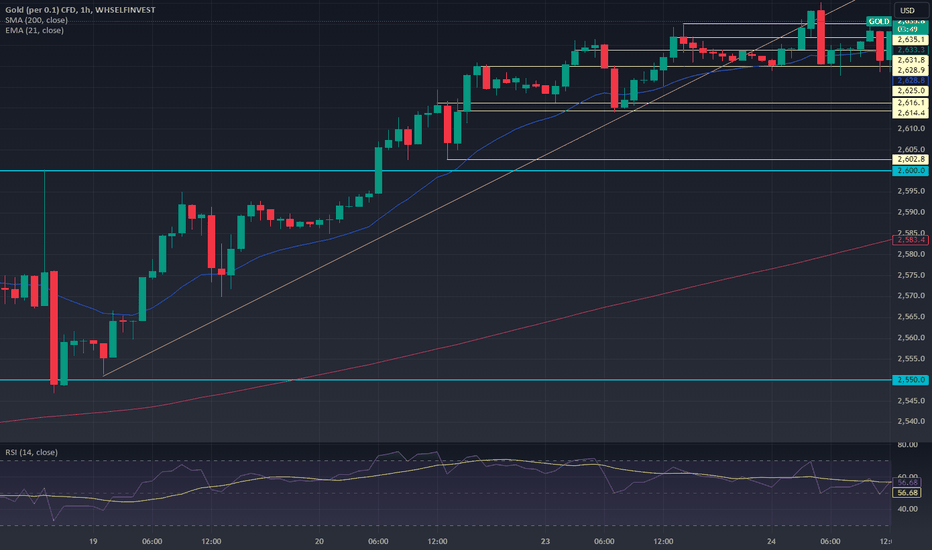
S&P 500 forecast: Outsized rate cut music to bulls’ ears. S&P 500 forecast: The US stock market has shown impressive resilience following the recent volatility. Investors, thrilled by the Federal Reserve’s outsized rate cut, have pushed index futures higher. However, there are mixed opinions about what lies ahead. For now, it looks the S&P 500 will finish the week at a fresh record high.
Fed’s Rate Cut and Its Impact on Markets
The Federal Reserve’s decision to deliver a 50-basis point rate cut was largely welcomed by investors. The move was seen as a bold but necessary step to ease economic concerns without sending panic signals reminiscent of the 2008 financial crisis. Fed Chair Jerome Powell emphasised that the cuts are not part of a long-term strategy but rather a proactive measure aimed at stabilising growth, now that inflation appears to be on the path of returning to its target.
Markets initially sold off but quickly rebounded, with S&P 500 futures suggesting a potential new record high is on the horizon at the cash open today. The Dot Plot projection also boosted investor confidence, showing a possible 50 basis points of cuts this year and 100 next year, with the terminal rate expected to hit 3.0% by 2026. But what now?
Can the S&P 500 Rally Continue?
With the S&P 500 up nearly 19% year-to-date, investors are wondering if the rally can be sustained. On the surface, it appears that market sentiment is bullish, bolstered by the Fed’s actions and a series of robust earnings reports. Yet, looming risks, such as global economic slowdown in the Eurozone and China, may challenge this optimism. Moreover, seasonal trends indicate that September is typically a tough month for equities, adding a potential headwind to the current rally – although so far this hasn’t held investors back. With the US presidential election approaching, market volatility could spike, leaving investors hesitant to dive into new rallies without a clear trend.
S&P 500 forecast: Technical Analysis and Key Levels to Watch
Despite some volatility after the Fed’s rate cut, the S&P 500’s bullish trend remains intact. Traders should keep an eye on the support range between 5613 and 5670, with the upper end of this range marking the high from July. As long as the index holds above this support area, the short-term path of least resistance will remain upwards, potentially keeping the market on course to head towards 5800 or even the 127.2% Fibonacci extension level of 5827, derived from the drop in July.
However, a dip below 5613 would signal a shift towards bearish sentiment, potentially pushing the index down to its next support and short-term trendline around the 5480-5500 area.
Bearish Risks and Market Sentiment
While the bulls are currently in control, bearish traders are watching for signs of a reversal. A drop below recent lows, as suggested above, could signal the end of the short-term bullish bias, reminiscent of the July sell-off when overbought conditions led to a sharp decline. Then, the signal came in the form of a bearish engulfing candle on 17 July. Bearish traders need to wait for a similar confirmation before making any significant moves, given the overall bullish structure of this market.
Risk Management in a Volatile Market
Regardless of whether you're bullish or bearish, managing risk is critical in today's market. With heightened uncertainty surrounding the economy and upcoming elections, volatility is expected to remain high. Traders should stay nimble and be prepared for sudden shifts in the market’s direction.
In conclusion, while the S&P 500 forecast remains cautiously optimistic, several factors could derail the current rally. Staying informed and agile will be essential for navigating the coming weeks. We will, of course, highlight any major shifts in the trends, if observed. Stay tuned.
-- Written by Fawad Razaqzada, Market Analyst  Long
Long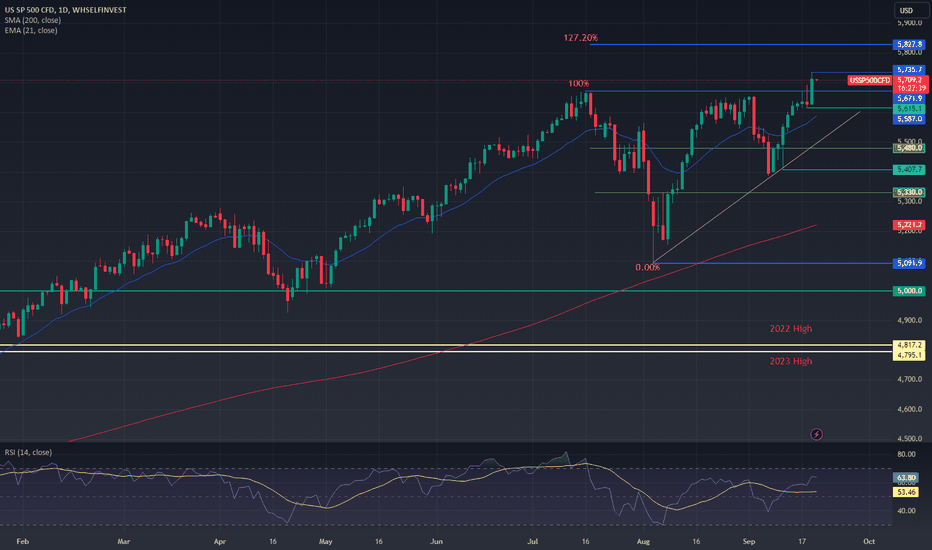
Gold forecast: What now for gold after scoring 7 monthly gain?I expect gold to rise further and continue to attract buying activity on any dips. One reason is that the overall trend remains bullish, which should deter bearish speculators from acting too forcefully unless there are clear signs of a reversal.
Gold finished higher for the 7th consecutive month in August, meaning that the precious metal is now up a solid 21% year-to-date. Will it be able to rise further in September or take a breather? The gold forecast will now depend at least partly on incoming US data and interest rate expectations. I continue to maintain a bullish view on the metal thanks to a favourable macro backdrop and its steady-as-she-goes price action.
Gold forecast: Can XAU/USD continue rising?
I expect gold to rise further and continue to attract buying activity on any dips. One reason is that the overall trend remains bullish, which should deter bearish speculators from acting too forcefully unless there are clear signs of a reversal. Additionally, there are few fundamental reasons to short sell gold at the moment. In fact, some argue that gold is still undervalued, considering the significant devaluation and loss of purchasing power of fiat currencies worldwide due to high inflation, which remains persistent in some regions. While disinflation is evident in the US and other areas, it's not the same as deflation. Prices are still increasing, just not as rapidly as before. Demand for gold as an inflation hedge should continue to offer support. Moreover, the sharp decline in bond yields in the last couple of months, driven by expectations of rate cuts by the Federal Reserve, is likely to benefit low or zero-yield assets like gold. As long as we don’t see a reversal in the that trend, lower yields should argue against a sustained period of weakness for gold and silver.
Dollar in focus ahead of busy week
The US dollar is facing a key test this week with the release of several market moving data releases, including the August jobs report.
Following today's US Labor Day holiday, the US data schedule becomes busier, featuring ISM manufacturing data on Tuesday, JOLTS job openings on Wednesday, ADP employment data, jobless claims, and ISM services on Thursday, and culminating with the key event of the week, the August jobs report on Friday.
Out of all of these data releases this week, the nonfarm jobs report should be a key determinant of whether the dollar’s two-month dollar bear trend extends or whether range bound price action will return.
Gold bulls will need to a weaker number to send the metal sharply higher. But if the consensus is correct regarding Friday's jobs report, which predicts 165,000 job gains and a decrease in the unemployment rate to 4.2% from 4.3%, then the market will likely solidify expectations for a 25-basis point rate cut to start the Fed's easing cycle on September 18. In this scenario, I would expect to see a modest weaker reaction in gold at least.
However, if payrolls only increase slightly, say by around 100,000 or so, with the unemployment rate potentially rising too, then in this scenario, the dollar could resume lower, sending gold sharply higher as expectations shift back toward a 50-basis point Fed rate cut in September.
China concerns linger
Meanwhile we have had some mixed PMI readings from China’s manufacturing sector in the last couple of days, leaving investors guessing about the health of the world’s second largest economy. While the official manufacturing PMI fell further into contraction at 49.1 in August from 49.4 in July, the Caixin PMI improved to 50.4 from 49.8 the month before. Meanwhile, the official non-manufacturing PMI ticked up to 50.3, suggesting that perhaps the Chinese economy may have bottomed out.
We will need to see further evidence of a Chinese recovery. If so, this will help raise hopes that elevated demand from the world’s top gold consumer nation can sustain precious metals prices at these levels or even push them higher.
Gold forecast: technical analysis and trade ideas
The steady grind higher is precisely what the bulls would like to see, keeping the technical gold forecast bullish. Shallow dips, higher highs, higher lows are characteristics of strong bullish trends.
So, the trend is clearly bullish and will remain that way until we see a lower low form. Dips are likely to find support around broken levels such as around the old record high from July at $2483, where we also have the 21-day exponential moving average converging. The bullish trend line that has been in place since February, comes in around $2450, representing another short-term support level to watch.
On the upside, there is only one prior reference point to watch given that the metal is trading near its all-time high. And that level is the all-time high itself, hit last month at $2531.
-- Written by Fawad Razaqzada, Market Analyst Long 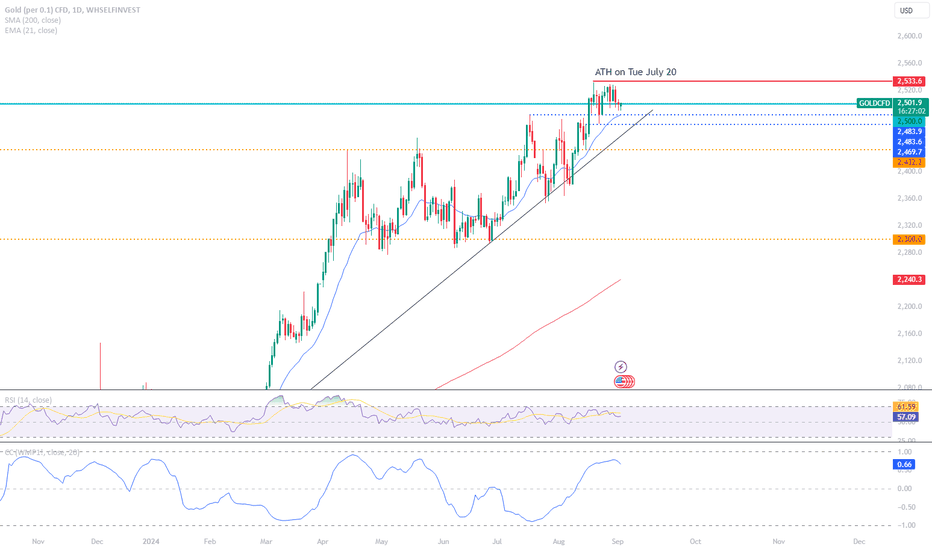
NZD/USD powering higher as business confidence, milk prices surg- NZD/USD hits highs not seen since early January
- Latest leg higher fueled by big improvement in New Zealand business confidence
- Kiwi likely to outperform as long as traders continue to see a soft US economic landing
About the only thing rising as fast as dairy prices is New Zealand business confidence right now, and both are beneficial for NZD/USD which has surged to seven-month highs. Who said Kiwis can’t fly?
Kiwi flying on dairy strength, soaring business confidence
As covered in a separate note last week, NZD/USD has been a major benefactor of recent US dollar weakness, not only enjoying tailwinds from narrowing interest rate differentials but also soaring dairy prices. You can now add bullish New Zealand business confidence to the growing list of Kiwi tailwinds.
The confidence measure in the ANZ Bank New Zealand Business Outlook survey surged to a decade-high in August, surging 23 points to +51. Expectations for own activity also bounced, hitting fresh seven-year highs.
The bounce in optimism followed the Reserve Bank of New Zealand’s (RBNZ) first interest rate cut of the cycle earlier in the month, with the bank signalling a further 100 basis points of easing by the middle of next year.
“Things are definitely looking up, albeit from a pretty dark place for many firms,” ANZ’s economics team wrote. “It wasn’t the Reserve Bank’s cut to the Official Cash Rate (OCR) that kicked off the lift – we saw an increase across much of the survey already in July, and the further large jump in August was already evident when the survey first opened at the very beginning of the month.
The table below from ANZ details just how impressive the improvement in the surveys internal components was during the month.
NZD/USD remains a buy-on-dips play
Having chopped back and forth through former resistance at .6218 earlier this week, the data has seen the Kiwi rocket higher in Asian trade on Thursday, hitting levels not seen since early January, breaking through another layer of resistance at .6277 in the process. The question now is whether it can hold there?
RSI (14) and MACD continue to provide bullish signals on the daily timeframe, although the former is now bordering on overbought territory. Even so, the inclination remains to buy dips rather than sell rallies in the near-term.
With nothing else on the New Zealand calendar this week, the biggest threat to the bullish trend arguably comes from incoming US labour market data which has been highly influential on Fed interest rate pricing over recent months, placing emphasis on initial jobless claims that will be released later in the session.
For a cyclical currency like the Kiwi, mild weakness screens as bullish. So too mild strength as both would allow the Fed to begin cutting rates without sparking fears of an impending recession. But if the data were to weaken dramatically, that would be problematic given the Kiwi comes across as a high beta play on the global economy.
If the US were to fall into recession, narrowing interest rate differentials would be more than overridden by fears of weaker demand, hammering risker cyclical plays as a consequence. However, such an outcome screens as unlikely on this occasion, potentially opening the door for the Kiwi to keep rising.
My preference would be to see how the data prints before entering positions. If the price pushes above .6277, you could buy with a stop below the level for protection. .63695 is one potential target. Alternatively, if it can’t hold .6277, you could sell with a stop above the level for protection targeting a pullback to either .6218 or .6150.
-- Written by David Scutt
Silver struggles at downtrend littered with reversal patternsSilver’s been on a nice run recently, benefitting from an easing of concerns towards the trajectory for US economy. But with the move stalling ahead of levels where it's struggled in the past, and with major risk events approaching fast, are we on the cusp of yet another bearish reversal?
Silver has rallied 14% from the early August lows
It has been extremely correlated with other industrial metals such as copper over the past month, suggesting it’s more a play on the global economy
Silver rally stalls at downtrend that’s sparked bearish reversals in the past
Overview
Silver’s been on a nice run recently, benefitting from an easing of concerns towards the trajectory for global US economy. That’s because unlike gold which has been heavily influenced by movements in the US dollar and bond yields, silver has been extremely correlated with copper futures over the past month, another industrial metal closely tied to economic activity.
While concerns have eased recently, we’re about to receive a whole bunch of economic data that could easily see them flare again next week. Perhaps unsurprisingly, silver has struggled to extend the bullish reversal sparked by Jerome Powell’s speech last Friday, wobbling ahead of downtrend resistance dating back to the highs struck this year.
Silver looking at another bearish reversal?
When you look back to see how the silver price has interacted with this level previously, you can’t help but notice it’s littered with evening stars, bearish engulfing candles and key reversals, all notable topping patterns. It doesn’t like it.
With RSI (14) rolling over, warning of waning bullish momentum, I wonder whether we may see a similar outcome soon? Wednesday’s candle, while incomplete, looms as a potential bearish engulfing, while the price is threatening to break out of the rising wedge it’s been in for several weeks.
For those keen to take on the short trade, you could sell now or wait for better levels slightly higher with a stop above Monday’s high for protection. The initial trade target would be $28.77, conditional on the price being able to break the 50-day moving average. If $28.77 were to give way, $28.046 and $27.269 are the next levels to consider.
If the trade moves in your favour, consider lowering your stop to entry level or lower, allowing for a free hit on downside.
-- Written by David Scutt
 Short
Short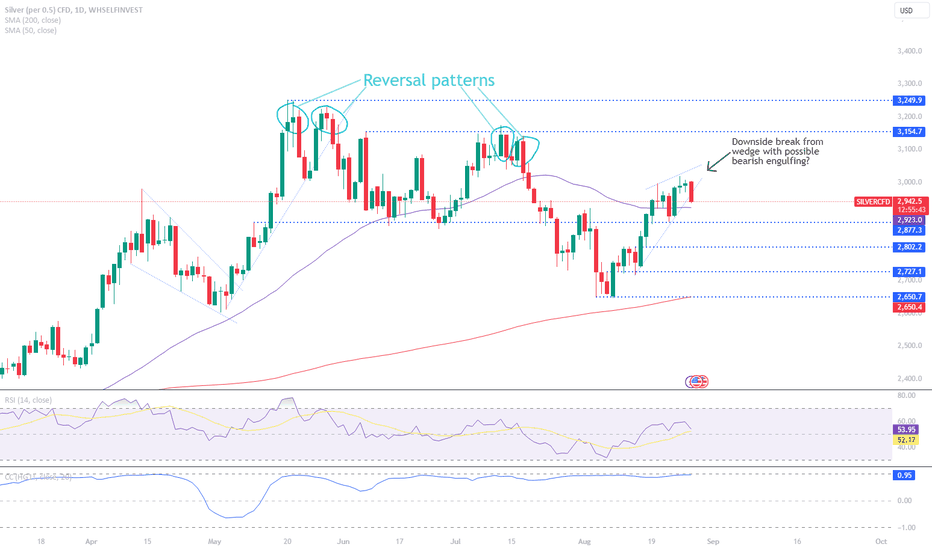
GBP/USD Key Points
Tuesday’s UK Construction PMI came in above expectations at 55.3, the highest reading in more than two years
Time will tell whether traders are overly optimistic that the BOE will be able to cut rates relatively slower than its major rivals or whether more rate cuts still need to be discounted
GBP/USD’s bias remains to the downside and traders may look to sell this rally as long as rates remain below 1.2760 and the RSI holds below the 50 level.
In an eerily quiet week for UK economic data, GBP/USD has been taking its signal from developments elsewhere and general risk trends. The only notable data release this week was Tuesday’s Construction PMI, which came in above expectations at 55.3, the highest reading in more than two years.
Despite the strong reading (admittedly on a second- if not third-tier economic indicator), sterling has struggled to get into gear this week. Outside of the Swiss franc, the British pound is the weakest major currency since Sunday’s open.
This weakness has emerged despite the BOE being one of the least dovish major central banks looking forward. According to Bloomberg data, OIS traders are pricing in just 44bps of interest rate cuts from the Bank of England this year, or a bit below two 25bps rate cuts, compared to roughly 100bps (four 25bps rate cuts) and 68bps (almost three 25bps rate cuts) for the Fed and ECB respectively. Time will tell whether traders are overly optimistic that the BOE will be able to cut rates relatively slower than its major rivals or whether more rate cuts still need to be discounted, potentially keeping GBP/USD under pressure.
British Pound Technical Analysis – GBP/USD 4-Hour Chart
Turning our attention to the chart, GBP/USD remains in its 4-week bearish channel, despite the big rally during the first half of today’s US session.
One tool that traders can use to help handicap when a trend may break is the RSI indicator. In this case, the 14-period RSI on GBP/USD’s 4-hour chart has been stuck in a well-defined range between 30-50 since shortly after the bearish channel formed, signaling consistent, but not excessive, bearish momentum. Accordingly, bulls may want to watch to see if the RSI can break above the 50 level to either foreshadow or confirm a breakout in the exchange rate itself.
For now though, the bias remains to the downside and traders may look to sell this rally as long as rates remain below 1.2760 and the RSI holds below the 50 level.
-- Written by Matt Weller
BOJ capitulates spectacularly Shinichi Uchida, Deputy Governor of the Bank of Japan (BOJ), says the bank won’t hike interest rates when markets are unstable, delivering a clear message on what traders need to do to prevent them doing so again: create volatility.
It’s an amazing statement, signalling the BOJ can and will be bullied by markets to avoid doing what is right for the Japanese economy. It’s an incredibly dovish admission, giving traders the green light to re-establish carry trades until the BOJ starts making noise about hiking rates again, or we see a major global economic downturn.
The Yen is tumbling understandably.
Adding to the dovish surprise, Uchida said the BOJ must maintain the degree of monetary easing for now and suggested the BOJ would not be behind the curve if it didn’t usher through rate hikes “at pace”.
It’s a capitulation of the grandest scale, undoubtedly orchestrated to restore calm to financial markets. It was only just over a week ago the BPOJ hiked more than expected and provided a hawkish outlook on the monetary policy outlook.
USD/JPY surges as carry trades established
USD/JPY has surged back above resistance at 146.50 on Uchida’s remarks, putting a potential retest of the January 2023 uptrend in play. The formation is also yet to be completed, but the three-candle pattern looks like a morning star, adding to confidence that we may have seen the cyclical bottom.
Should the price manage to remain above 146.50, consider buying with a stop below the level for protection. The intersection of the former uptrend and horizontal resistance at 148.80 is one potential trade target. Should that go, 149.70, 150.90 and 151.95 are the next upside levels of note.
The downtrend in RSI (14) has been broken, signalling downside momentum may be ebbing. It has yet to be confirmed by MACD but looks trustworthy given the speed of the rebound.
It’s not just bottoming patterns being seen in USD/JPY but also other pairs such as EUR/JPY and GBP/JPY.
-- Written by David Scutt AUD/USD squeeze risk growing?With tentative signs of stablisation in commodity futures and US equity index futures pushing higher in early Asian trade, the prospects for some form of squeeze higher in AUD/USD appear to be growing.
You can see just how violent the selloff has been over the past two weeks, leaving it oversold on RSI (14) for the first time since August 2023. But the modest reversal on Thursday after breaking the 61.8% Fib retracement of the April-July low-high is about the closest thing to a bullish signal we’ve seen for the AUD/USD in a while.
It’s tempting to go long with a stop below the fib level for protection, but it would be nice to see RSI break its downtrend first to provide confidence that the bearish price momentum is ebbing.
Given the acute focus on China, the reaction to the PBOC’s CNY fix in FX markets, and opening of Chinese stock futures, may provide a strong tell on where the near-term path of least resistance lies. If they open firmer, it may increase the probability of AUD/USD upside.
AUD/USD a proxy for risk appetite
The chart also shows the rolling 10-day correlation between AUD/USD with COMEX copper in orange, crude oil in black, S&P 500 in green and Nasdaq 100 futures in blue. Every single correlation sits north of 0.8 with three of the four hovering around 0.9 or higher. The higher the score, the greater the relationship between the two variables.
Taking a step back, the strong correlations suggest AUD/USD is being used as proxy for risk sentiment, a role it has often played previously when we’ve seen boarder risk-on-risk-off moves in markets. That means if we see even a modest improvement in risk appetite, as seen on Thursday when the latest batch of US economic data suggested premonitions of an imminent recession may be misplaced, the AUD/USD could find buyers.
The price action in commodity futures is another potential sign that the worst of the rout is over, at least for the moment. Musk's Warning to Gates Backfires: Tesla's Mixed Q2 ResultsApproximately a week ago, Elon Musk cautioned Bill Gates against shorting Tesla stock, suggesting potential negative consequences. However, the situation has shifted, with Tesla's stock price experiencing a significant $20 drop following the release of its earnings report in the aftermarket.
Tesla's Q2 2024 results were a mixed bag, leaving many questions unanswered. While sales increased by 7% compared to the previous year, overall revenue from car sales declined. This news is concerning for investors who primarily view Tesla as a car manufacturer.
Additional points of interest for investors include the timeline for the release of Tesla's new range of affordable vehicles designed to compete with aggressive Chinese manufacturers, which is expected in the first half of 2025. Moreover, the company has postponed plans for increased factory productivity and the unveiling of self-driving vehicles until 2025 and October 2024, respectively.
The lack of clear communication from Elon Musk and his team regarding these developments has contributed to investor uncertainty and subsequently impacted the share price.
Key takeaways from Tesla's Q2 2024 results
Earnings per share (EPS) : $0.61, down from $0.91 in Q2 2023 but up from $0.45 in Q1 2024.
Revenue : $20.16 billion, a 5% decrease compared to the same period last year, but a 16% increase from Q1 2024's $17.38 billion.
Deliveries : 444,000 vehicles, exceeding expectations but still 5% lower than the same period last year.
Several factors have contributed to a decrease in demand for Tesla vehicles, including high-interest rates, which make financing vehicle purchases more expensive for consumers. Additionally, the impact of Tesla's aggressive price cuts from the previous year is diminishing, and competition is intensifying, particularly in the Chinese market. In the domestic market, Tesla is losing ground to competitors like General Motors and Ford.
Despite these challenges, Tesla's share price had experienced a 33% increase in the first eight days of the month, adding $209 billion to the company's valuation.
Looking ahead
The weekly chart indicates that Tesla's share price has rebounded from its April 2024 low of $140, surpassing the 200-day simple moving average (SMA) and the falling trendline from November 2021. Buyers will aim to reclaim the September 2023 high of $278 before targeting the 2023 high of $300. Immediate support levels are at $230 (200 SMA) and $223 (falling trendline). A drop below these levels could lead to the 100 SMA at $210 becoming a potential downside target.  Short
Short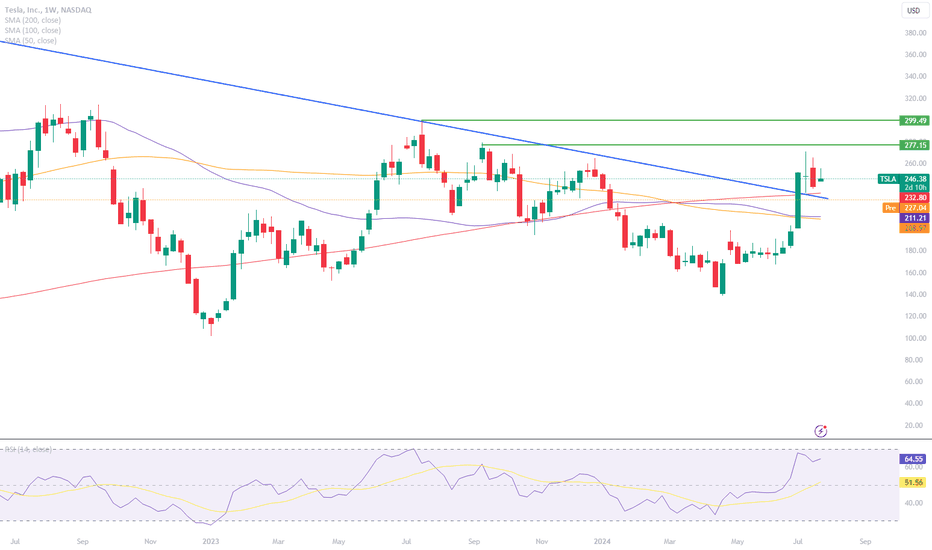
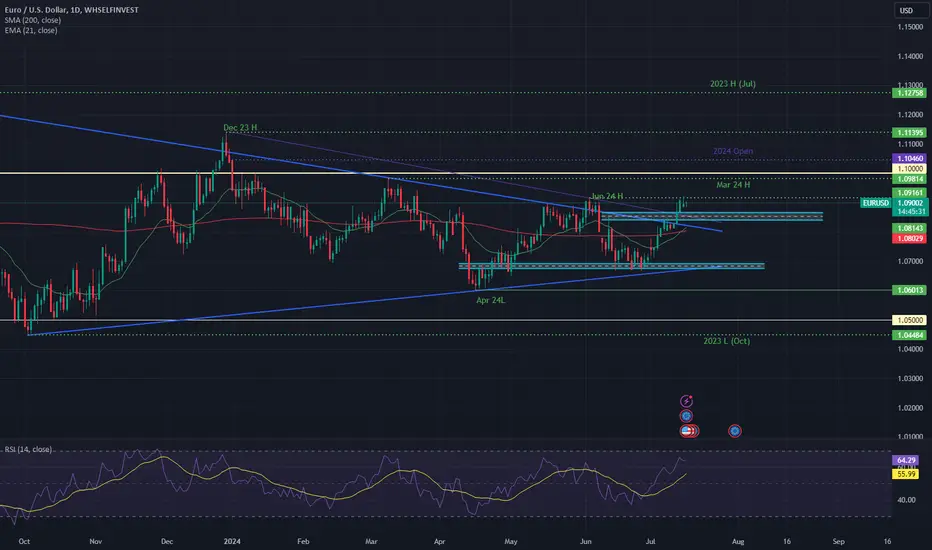
EUR/USD forecast: Currency Pair of the WeekThe EUR/USD poked its head above the June high of 1.0916 to reach its best level since March, after the US Empire State Manufacturing Index came out weaker than expected earlier. The US dollar has remained under pressure against most major currencies, albeit not so much against the likes of the New Zealand dollar following last week’s dovish RBNZ meeting. Still, against the likes of the euro and pound, as well as gold, the greenback has fallen further after last week’s weaker-than-expected US CPI data boosted expectations that the Federal Reserve will loosen its monetary policy at its September meeting. Already cutting rates in June, the European Central Bank will be in focus again this week. This time, no rate cuts are expected from the ECB, which, together with reduced political uncertainty in Europe and weakness in US data, should all help to keep the euro supported against the US dollar, maintaining the short-term EUR/USD forecast in bulls’ favour.
EUR/USD forecast: Key macro highlights this week
Apart from retail sales and a handful of other macro pointers, the US economic calendar is quite quiet this week. The same could be said about Europe’s data calendar had it not been for the ECB policy decision on Thursday. Here are this week’s key macro highlights, relevant to the EUR/USD pair:
- Tuesday -
US Retail Sales & Core Retail Sales m/m
- Wednesday -
US Building Permits
US Industrial production m/m
- Thursday -
Eurozone Main refinancing rate & monetary policy statement
US unemployment claims
ECB Speech
EUR/USD forecast
Already, we have seen the Empire State Manufacturing Index print a below-expected -6.6 reading this week, which helped to keep the pressure on the US dollar. But it is all about retail sales on Tuesday, when building permits and industrial production data will be published too.
US retail sales expected to fall
The health of the US consumer is deteriorating, as was reflected by last month’s release of the May retail sales estimate, which came in at just +0.1% month-over-month. That followed a downwardly revised 0.2% fall in April. Sales at gasoline stations were particularly weak last time, falling 2.2%, while those at furniture stores, an indication of demand for long-lasting goods, slipped 1.1%. Meanwhile, recent data releases have mostly surprised to the downside and inflation has cooled more than expected. If retail sales again disappoint, then the odds of a September rate cut could surge, especially in light of last week’s weaker consumer inflation data (and UoM’s Inflation Expectations survey).
ECB rate decision
The European Central Bank’s next rate decision is on Thursday, July 18 at 13:15 BST. Don’t expect any fireworks this time, after it delivered its first rate cut in June. That decision was built up so much by the ECB that they simply had to cut even if policymakers were unsure about the path of inflation. Indeed, the minutes of that meeting have since revealed greater uncertainty in ECB staffs’ outlook for inflation, while private consumption showed no convincing evidence of picking up either. The ECB will remain data-dependent, something which Christine Lagarde highlighted at the last press conference in June and said there will be no pre-commitment to a particular rate path. So, don’t expect another rate cut at this meeting, but watch out for clues about the next move.
EUR/USD forecast: Technical analysis
The EUR/USD has broken above a couple of bearish trend lines that were there from July and December of last year. Rates have also moved and stayed above their 21-day exponential and 200-day simple moving averages. The technical EUR/USD forecast is therefore bullish as things stand. But given that it had struggled around the current levels between 1.0900 to 1.1000 area earlier this year, I wouldn’t be surprised if it hangs around for a few days here, potentially until the ECB rate decision is out of the way. Still, the short-term path of least resistance is clearly to the upside, so I wouldn’t necessarily look for bearish trades here unless the charts tell me otherwise. Key short-term support is now seen between 1.0840-1.0865 area, followed by 1.0800, where the 200-day average now resides. DJT stock: Dead cat rebound or wave of support?Trump Media & Technology Group Corp's stock surged following news of an attempted assassination on major shareholder Donald Trump at a political rally on Sunday.
Given the fervent nature of Trump's supporters, it's plausible that voters could turn to their wallets before casting ballots in November as the presidential race heats up. Drawing parallels to the recent activity surrounding the GameStop stock, a meme rally cannot be entirely ruled out, potentially presenting a lucrative opportunity for speculators.
For this scenario to materialize, high trading volumes in the stock need to persist. The average trading volume over the past two weeks is around 10 million shares. If today's activity surpasses this figure, it could indicate sustained interest in the stock following yesterday's massive gap up and record trading volume.
Although DJT stock closed $6 lower than its opening price, it currently hovers around the crucial $40 level. If the bulls can maintain the price above this level before today's close, it could signal a further bullish trend. Conversely, if the price were to fall below the $40 mark, we might see the stock trading at its early July levels of $30.
This trade is highly speculative, and while the current political climate could easily add more fuel to the fire, it's crucial to monitor the fundamentals. DJT reported a loss for Q1, but with Q2 earnings around the corner, investors should stay vigilant. Call spreads with 30-40 DTE (shortly before Q2 earnings report) might be an interesting play here regardless of the direction you're betting on.
Shopify (SHOP:NYSE) receives support from Goldman SachsJuly 2024: Shopify's shares took a heavy hit in May after a moderate Q1 earnings report which might have beaten investor consensi, EPS by $0.04 & revenue by $20 mio, yet this was not enough to prevent a large selloff. The share price is currently recovering and is now trading 4,5% higher than it did 12 months ago. This is partly thanks to the analyst from Goldman Sachs, who kept the share rating at "buy" signalling that Goldman Sachs believes Shopify can further accelerate its growth. In general Shopify's rating remains a moderate buy, with analysts giving it a price target of $76.42, a 15.5% upside.
Shopify has been able to increase its market share in e-commerce software platforms and technologies over the last 18 months, now sitting at around 10%, so its large investments in marketing are therefore paying off and bringing in lucrative orders. Shopify is also investing in artificial intelligence (AI) which gives the company a competitive advantage given the large data pool it has access to, and already uses the technology having launched the Shopify Magic suite last year.
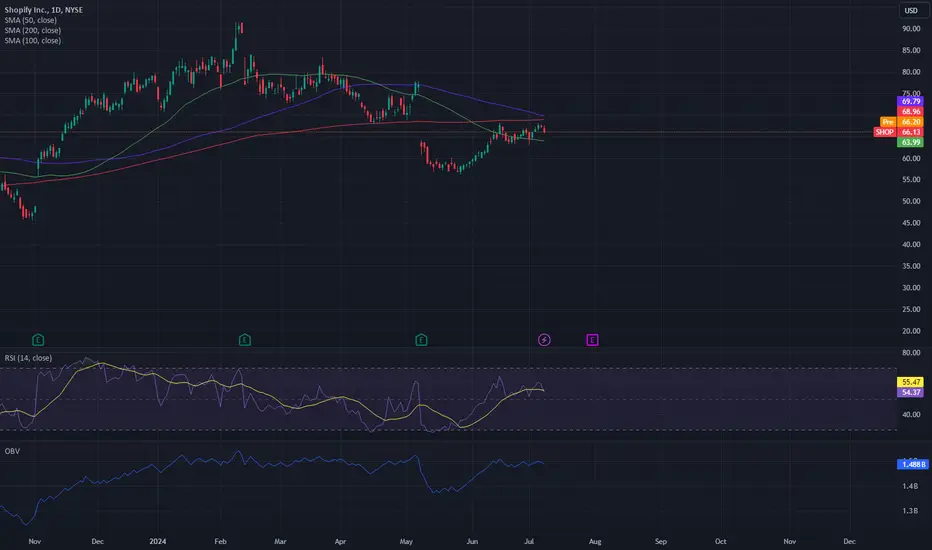
The technicals are painting a somewhat mitigated picture, with the RSI sitting in neutral territory around 54 in the daily chart. The stock's price sits above the 50 day MA, and wasn't able to break through the 100 day MA which is flattening out around the 69 mark, which had proved to be a relevant support zone before the drop.
The on balance volume is telling us a similar story, namely that buying and selling pressures have balanced out in the last months and that traders are probably lacking a bit of conviction at the moment. We will most likely have to wait for the Q2 earnings report at the end of the month before seeing a significant move again.
Nvidia - How high is too high?Nvidia (NVDA) continues to defy gravity, hitting $140 in pre-market trading today.
This translates to:
A 23% increase in June alone
A 55% increase in Q2
A staggering 184% increase since the beginning of the year
A 225% year-to-date (YTD) surge
These are the kinds of figures we've come to expect from Nvidia, making even impressive YTD gains of 27% by companies like Microsoft look pedestrian. Nvidia's rise has also propelled it to the top of the market cap rankings, becoming the world's most valuable publicly traded company.
The Question of Sustainability
The burning question is, can this growth be sustained?
So far, Nvidia has the numbers to back it up. The company has already generated more EBITDA this year than in all of FY2023. While its Price/Earnings Growth (PEG) ratio of 1.55 suggests a slight overvaluation, and has been increasing steadily for a year, it remains below the PEG ratios of multi-trillion-dollar peers like Microsoft and Apple.
Technical Indicators Flashing Green
The technical indicators also paint a bullish picture. The stock is well above its short-, mid-, and long-term moving averages, indicating strong momentum. The recent surge in volume further confirms heightened investor interest.
The Bias and Sentiment Strength (BASS) Indicator, a composite tool created by @mattzab combining several technical indicators, also flashes a strong buy signal for Nvidia. (For a detailed explanation, see this page: ).
The Road Ahead: Smooth Sailing or Bumpy Ride?
The big question is whether we'll see a soft landing, a minor pullback, or a significant dip. This will depend on how many investors decide to take profits and the speed at which they do so. A rapid sell-off would likely be triggered by a sudden collapse in the "AI hype" or if companies find themselves unable to effectively utilize their new AI chips, or their efforts to capitalize on LLMs fail.
It's still early days in the AI boom, but parallels have already been drawn with the dot-com bubble which many investors are old enough to remember. It took Apple more than 5 years after the crash to reach its dot-com peak, and Microsoft needed more than 14 years. While there is no looking back for these stocks now, one shouldn't forget that Cisco, which was regarded as a crucial internet infrastructure provider at the turn of the century, never reached its dotcom peak again. But then again, past market crashes do not guarantee future losses, or how did the saying go again?
For now, the status quo remains: everyone is bullish as long as everyone else is bullish as well.
As always, stay vigilant out there!
 Long
Long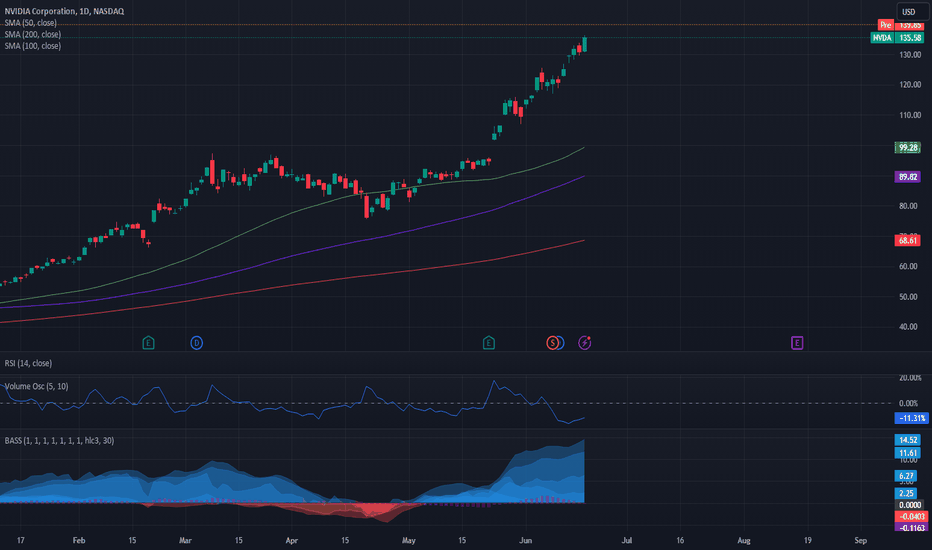
Mind the gap! What next for Broadcom?Broadcom (AVGO) has been a major beneficiary of the AI boom, with its stock soaring 53% since the beginning of 2024 and more than doubling year-to-date. While not reaching the astronomical heights of NVIDIA (NVDA), Broadcom's performance remains remarkable.
The company's Q2 revenue report was a resounding success, showing a 43% year-over-year increase, while EBITDA grew 31% year-over-year. This strong performance prompted Broadcom to announce a 10:1 stock split on July 15th, a move that will make the stock more accessible to smaller retail investors.
The sustainability of this growth in the rapidly evolving AI landscape remains a key question for any AI-related company. However, Broadcom's forward P/E ratio of 35 appears relatively modest compared to its AI peers like NVIDIA (50), CrowdStrike (95), and AMD (46). This suggests that Broadcom may still have room for further valuation expansion.
Following the impressive earnings report, the stock surged 12% on June 13th and continued to trade higher in after-/pre-market activity. The technical picture is also positive, with the price comfortably above its short, mid, and long-term moving averages, indicating strong momentum. The recent surge in volume, reflected in the Volume Oscillator, further underscores the heightened interest in the stock.
While the Relative Strength Index (RSI) is currently in overbought territory at 79.23, this is not unusual following a major earnings announcement. Importantly, the RSI's moving average has been trending upwards since early May, suggesting that the bullish momentum behind AVGO may not be exhausted yet.
Furthermore, the overall market sentiment towards AI remains positive, which could continue to support Broadcom's growth trajectory. Yet it remains important to monitor Broadcom's competitive position in the Semiconductor Solutions & Infrastructure Software market, as the landscape is constantly evolving.
Risk Management: Despite the positive outlook, investors should be mindful of potential risks, such as a slowdown in AI adoption or increased competition, and employ appropriate risk management strategies.
 Long
Long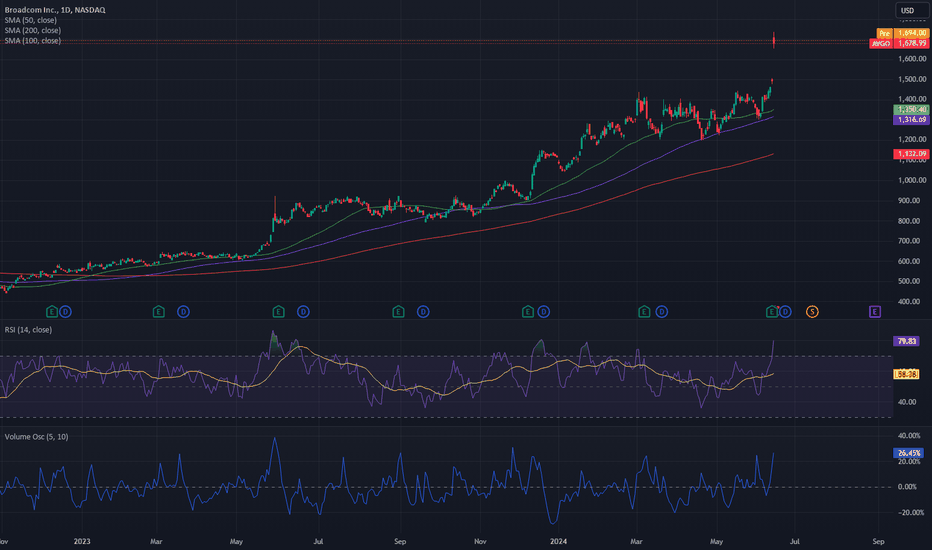
ADOBE: What is the stock doing before the Q2 earnings Adobe's stock price has been declining over the past month, currently trading below its 50, 100, and 200-day moving averages, with the chart drawing a "death cross" pattern around mid-April, which further confirms the bearish sentiment. The stock now trades at a 25% discount compared to the highs earlier this year.
The Volume Oscillator currently stands at 1.3%, suggesting some buying interest remains, but it's weakening compared to recent trading volume. This could signal a potential reversal, but the downtrend remains strong, with the neutral RSI not suggesting any bullish reversal either.
Next week's Q2 earnings announcement could be a significant catalyst for Adobe. Positive earnings could potentially reverse the current downtrend, but the recent controversy surrounding Adobe's terms and conditions update could weigh on investor sentiment.
The T&Cs update has sparked concerns among users, particularly creatives worried about their creations being used to train AI models, and professionals concerned about the privacy of their data. This could potentially impact Adobe's reputation and customer base, particularly since Adobe remains relatively silent on the issue. This uncertainty adds another layer of risk to the stock in the near term.
 Short
Short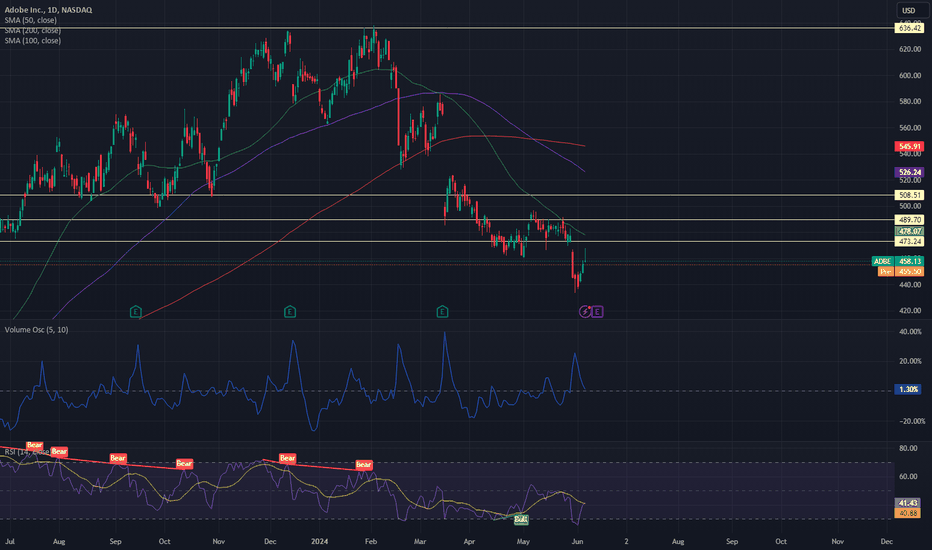
Crowdstrike pushing towards all time highs!Crowdstrike has been in a strong upward trend since the beginning of 2023. Pullbacks were generally short-lived, and the trend accelerated early this year.
CRWD reached its ATH in March, surpassing the 300 mark it reached in 2021. A significant consolidation occurred after that, but it seems like the bulls have garnered sufficient strength to test 360 again, after failing to breach the level 2 weeks ago, and maybe push the stock to new highs. The stock's 7% jump after beating the Q1 earnings estimate proved to be a perfect launchpad for this, CRWD is now trading above the 50, 100 & 200 SMA again.
Should the 360 mark be broken, traders can start looking up to the 400$ mark.
Fundamentally speaking, the threat of novel cybersecurity attacks is unfortunately not going to go away. Black hats are developing smarter-than-ever malware. To the eyes of many, Crowdstrike's AI-boosted cloud-based cybersec solutions offer powerful counters to those threats, so it is probably unlikely that Crowdstrike will see a sharp drop in demand in the near future as companies and their IT-teams are still catching up. According to the IDC (International Data Corporation) GenAI (Generative AI) in the cybersecurity market is growing at a CAGR of 23.6% and projects that it will reach a $46.3 billion market value by 2027.
Stay safe out there and trade responsibly!  Long
Long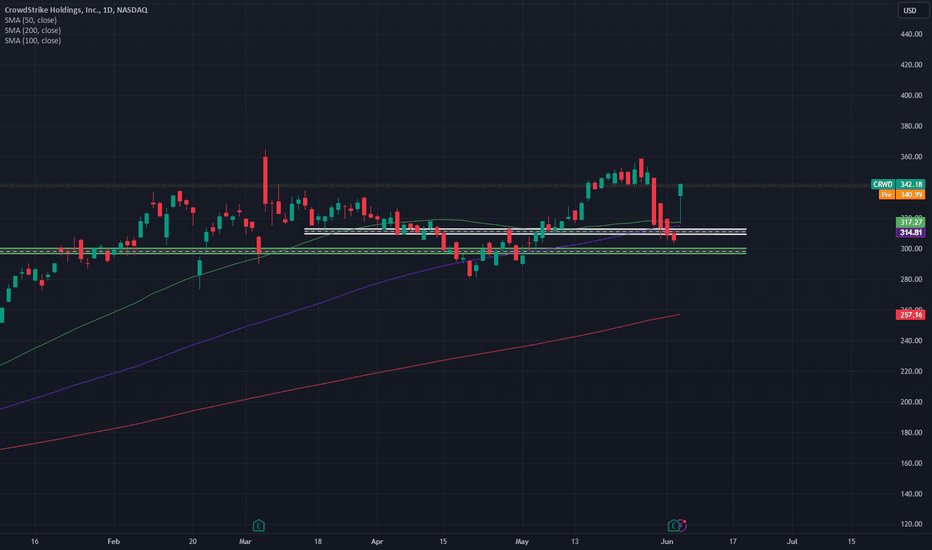
Gold Rush - Yes or no?
Around two weeks ago, gold reached a new all-time high, 2450.2$, just above the last high of 2,431.6$. However, the bulls were unable to maintain this high level over the course of the day. In the following trading days, the gold price fell sharply, losing a bit more than 100$. There has been a weak recovery over the last few days, with renewed selling pressure emerging in the middle of the week. A new low was reached on Thursday, albeit with a bullish reversal.
Chart facts:
- Resistance zone or possible double top around the 2,430$ level
- EMA50 in the daily chart successfully tested on Thursday
- Bullish reversal candle on Thursday
- Massive support at around 2,300$
Outlook
Thursday's reversal candle is now the perfect template for the ‘Friday Gold Rush Strategy’. Such a bullish daily candle has already led to strong gains on Fridays. A recovery to USD 2,370-2,380$ is well on the cards. From a buyer's persepctive, a daily close above USD 2,380$ would fit into the picture, which still looks bullish.
Good luck out there,
Bernd Senkowski
Long 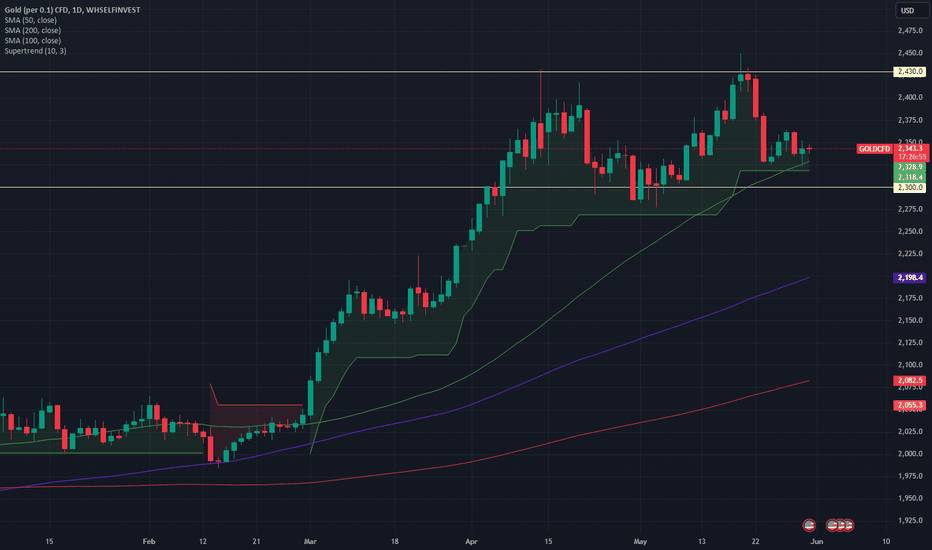
All time high! Dow Jones bricht die 40,000-Marke! Der Dow Jones Industrial Average hat Geschichte geschrieben und kurzzeitig die 40.000-Punkte-Marke zum ersten Mal überhaupt durchbrochen! Diese bemerkenswerte Leistung unterstreicht den starken Aufwärtstrend, der den Markt derzeit antreibt. Lass mal einen kurzen Blick darauf werfen.
WHSELFINVEST:WALLSTREETCFD
Gleitende Durchschnitte bestätigen Stärke: Der Kurs des Dow liegt deutlich über seinen 50-, 100- und 200-Tage-Gleitenden Durchschnitten, was ein starkes Indiz für einen anhaltenden Aufwärtstrend ist.
40.000: Psychologischer Widerstand? Auch wenn der Ausbruch zweifellos bedeutend ist, ist es ratsam, einen sofortigen Einstieg mit Vorsicht anzugehen. Die 40.000er-Marke könnte als psychologischer Widerstand dienen und möglicherweise zu einer Konsolidierung oder Rücksetzern führen, bevor der Aufwärtstrend sich definitiv in Richtung neuer Höchststände fortsetzt.
Trendkanalanalyse: Der Trendkanal auf dem Tages-Chart, der die Aufwärtsdynamik seit Ende Oktober 2023 nachzeichnet, zeigt den aktuellen Kurs in der Nähe der Mitte des Kanals. Diese Positionierung ist ein weiterer Hinweis auf einen anhaltenden Aufwärtstrend, könnte aber auch auf einen möglichen Rücksetzer auf die Unterstützungsmarke von 39.000 hindeuten, bevor sich die Rallye möglicherweise fortsetzt.
Interessiert am Handel mit einer breiten Palette von CFDs? Werf einen Blick auf unsere Website !  Long
Long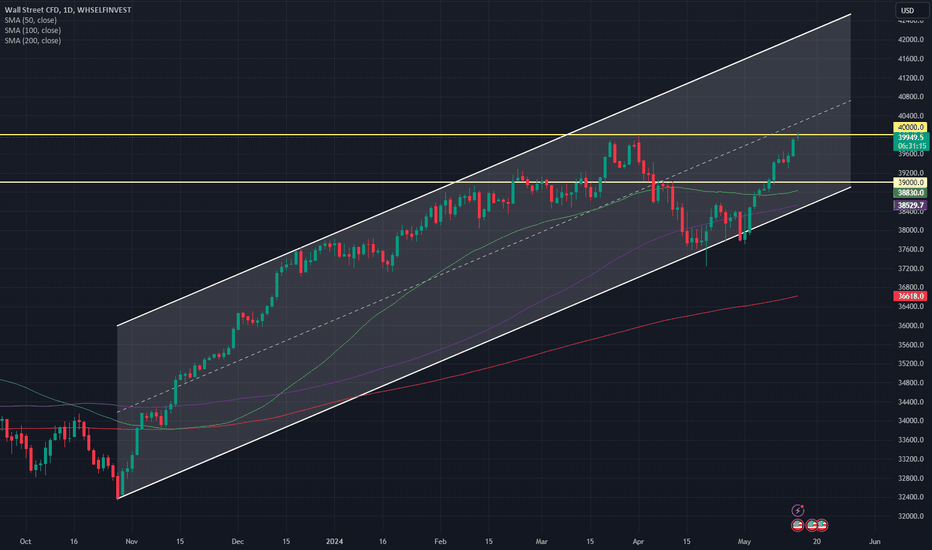


 Short
Short