EUR/GBP Market BreakdownFollowing our look at EUR/USD, let's turn to EUR/GBP. While the euro faces headwinds from German economic concerns, the pound is enjoying a rare moment of relative strength. This pair is telling a story of two currencies moving in opposite directions.
Technical Analysis
Looking at the 4 hour chart, EUR/GBP is currently trading near 0.85416, showing a slight decline of 0.03% on the session. The pair has been in a clear downtrend, with sellers firmly in control and price hovering near recent lows.
Key Levels to Watch
Resistance Zone: 0.85400 to 0.86000
Immediate resistance sits at 0.85400, which is currently being tested. A break above this level could see a move toward 0.85600 and then the 0.86000 area. The recent high near 0.86952 marks the upper boundary of the broader range.
Support Zone: 0.85000 to 0.84900
On the downside, immediate support lies at 0.85000, with stronger support near the recent low at 0.84938. A break below this level would signal further bearish momentum and could open the door toward 0.84800 and potentially lower.
Price Action
The pair has been consolidating in a tight range over recent sessions, with price action stuck between 0.85000 and 0.85400. This suggests indecision in the market as traders wait for a catalyst.
The broader structure shows a clear downtrend, with each rally attempt being rejected at lower highs. However, the current consolidation near support levels suggests the selloff may be losing some steam. A break above 0.85400 with momentum could signal a short term pullback, while a break below 0.85000 would confirm continued bearish pressure.
Fundamental Analysis
The Euro's Problem: Germany and ECB Divergence
The Volkswagen restructuring story continues to weigh on the euro. With up to 100,000 jobs potentially on the line, concerns about German economic weakness are mounting. Germany is the Eurozone's largest economy, and weakness here ripples across the entire region.
This comes at a time when the ECB's hawkish stance is already being questioned. The ECB hiked rates in June, but markets are increasingly doubting whether another hike will follow. Fading expectations for further tightening have kept the euro on the defensive against major counterparts.
The Pound's Tailwind: Politics and Policy
Sterling has found two rare supports that the euro simply cannot match.
Political Risk Collapse
The UK political picture has cleared significantly. Prime Minister Keir Starmer resigned three weeks ago, and Andy Burnham secured the support of the vast majority of Labour MPs to replace him. This smooth transition has unwound a political discount that had been weighing on the pound, allowing sterling to find its footing.
BoE Hawkish Tilt
The Bank of England held rates at 3.75% in June, but two dissenters pushed for a hike. The Hormuz oil shock has paradoxically strengthened the hawkish case, as higher energy prices threaten to feed inflation in the energy sensitive UK economy. This hawkish undertone supports the pound.
The Carry Gap
At 2.25%, the ECB deposit rate sits a full 150 basis points below the Bank of England's 3.75% Bank Rate. This substantial carry advantage continues to support sterling against the euro, making the pound more attractive from a yield perspective.
A Contrarian View to Watch
While the near term picture favors the pound, some analysts maintain a long EUR/GBP stance. They argue that a more hawkish ECB path versus the BoE could narrow front end rate differentials and push the pair toward 0.90 over the coming months. This view is worth monitoring if ECB inflation data surprises to the upside.
What to Watch Next
Breakout Levels
A break above 0.85400 with momentum could target 0.85600 and then 0.86000. A break below 0.85000 would likely retest the recent low at 0.84938 and potentially open the door toward 0.84800.
Key Data
UK monthly GDP and industrial production figures on Thursday will be sterling's main domestic test. Final Eurozone HICP on Friday should confirm the inflation picture and influence ECB expectations.
Central Bank Speeches
Huw Pill, the BoE's Chief Economist and a hawkish dissenter, speaks Monday. BoE Governor Bailey speaks Tuesday. Their tone will shape rate expectations and impact the pair.
Risk Events
Further negative Volkswagen headlines could weigh on the euro. Escalation of geopolitical tensions could also shift the dynamic and drive safe haven flows.
Final Thought
EUR/GBP is at a pivotal moment. The bearish trend is intact, with the pair trading near recent lows and hovering just above strong support at 0.85000. Sterling's political risk collapse and BoE hawkish tailwinds are keeping pressure on the euro. However, with the pair consolidating near support levels, traders should watch for a potential breakout to determine the next direction.
Disclaimer: This analysis is for informational and educational purposes only and does not constitute financial advice. Trading forex carries significant risk and may not be suitable for all investors. Always conduct your own research and consider your risk tolerance before trading.
easyMarkets publications
EUR/USD Market BreakdownWelcome to today's market breakdown on EUR/USD. With Volkswagen's restructuring news weighing on the euro and broader uncertainty creeping into the Eurozone, this pair is at a critical juncture. Let's break it down from both a technical and fundamental perspective.
Technical Analysis
Looking at the 4 hour chart, EUR/USD is currently trading around 1.14325, showing a modest gain of 0.05% on the session.
Key Levels to Watch
Resistance Zone: 1.14600 to 1.15000
This area has acted as a ceiling multiple times. A clean break above 1.15000 would be needed to shift the short term bias to bullish. Above that, resistance sits at 1.15600, then 1.16000 and the recent high near 1.16600.
Support Zone: 1.13800 to 1.13400
Immediate support is around 1.13800, with stronger support at 1.13400. The recent low at 1.13246 marks the key level to watch. A break below could open the door toward 1.13000.
EURUSD Price Action
The pair has been consolidating in a tight range, sitting roughly in the middle between support and resistance. This suggests indecision. A move above 1.14600 with momentum could signal bullish sentiment, while a break below 1.13800 would likely accelerate selling pressure.
Fundamental Analysis
Volkswagen Restructuring and German Concerns
The news that Volkswagen is considering cutting up to 100,000 jobs has cast a shadow over Germany's economic outlook. Germany is the Eurozone's largest economy, and its auto sector accounts for roughly 20% to 30% of GDP when including dependencies. If layoffs materialize, consumer spending and domestic demand could weaken, weighing on the euro against the dollar.
ECB Policy Expectations
Weaker German growth could support arguments for more accommodative ECB policy. If markets price in faster or deeper rate cuts, the euro would face selling pressure. However, the ECB must also balance inflation dynamics, keeping traders on edge.
US Economic Resilience
The US economy continues to show relative strength compared to Europe. This divergence supports the US Dollar and creates headwinds for EUR/USD.
Risk Sentiment
Volkswagen's restructuring news could reduce investor confidence and trigger a risk off shift. When risk appetite fades, safe havens like the US Dollar tend to benefit, adding further downside pressure on EUR/USD.
What to Watch Next
Breakout Levels
A break above 1.15000 with momentum could target 1.15600 and 1.16000. A break below 1.13800 would likely retest the recent low near 1.13246.
Key Data
German Industrial Production, PMI data, Eurozone employment figures, and ECB speeches. US economic data will also influence the dollar side of the equation.
Risk Events
Further negative headlines from Volkswagen or broader risk off flows could weigh on the euro.
Final Thought
EUR/USD is at a crossroads. The technicals show consolidation within a defined range, while the fundamentals point toward potential downside risk with German economic concerns and ECB policy expectations tilting the scales in favor of the dollar. Watch the key levels closely and remain flexible as the story unfolds.
Disclaimer: This analysis is for informational and educational purposes only and does not constitute financial advice. Trading forex carries significant risk and may not be suitable for all investors. Always conduct your own research and consider your risk tolerance before trading.
SP500 - New Highs or Pull-back ? Disclaimer: easyMarkets Account on TradingView allows you to combine easyMarkets industry leading conditions, regulated trading and tight fixed spreads with TradingView's powerful social network for traders, advanced charting and analytics. Access no slippage on limit orders, tight fixed spreads, negative balance protection, no hidden fees or commission, and seamless integration.
Any opinions, news, research, analyses, prices, other information, or links to third-party sites contained on this website are provided on an "as-is" basis, are intended only to be informative, is not an advice nor a recommendation, nor research, or a record of our trading prices, or an offer of, or solicitation for a transaction in any financial instrument and thus should not be treated as such. The information provided does not involve any specific investment objectives, financial situation and needs of any specific person who may receive it. Please be aware, that past performance is not a reliable indicator of future performance and/or results. Past Performance or Forward-looking scenarios based upon the reasonable beliefs of the third-party provider are not a guarantee of future performance. Actual results may differ materially from those anticipated in forward-looking or past performance statements. easyMarkets makes no representation or warranty and assumes no liability as to the accuracy or completeness of the information provided, nor any loss arising from any investment based on a recommendation, forecast or any information supplied by any third-party.
Risk Warning: 74% of retail investor accounts lose money when trading CFDs with this provider. You should consider whether you can afford to take the high risk of losing your money. Please refer to our full risk disclaimer on our website.
Silver Analysis & Areas of Interest- 30min Time Frame ! Disclaimer: easyMarkets Account on TradingView allows you to combine easyMarkets industry leading conditions, regulated trading and tight fixed spreads with TradingView's powerful social network for traders, advanced charting and analytics. Access no slippage on limit orders, tight fixed spreads, negative balance protection, no hidden fees or commission, and seamless integration.
Any opinions, news, research, analyses, prices, other information, or links to third-party sites contained on this website are provided on an "as-is" basis, are intended only to be informative, is not an advice nor a recommendation, nor research, or a record of our trading prices, or an offer of, or solicitation for a transaction in any financial instrument and thus should not be treated as such. The information provided does not involve any specific investment objectives, financial situation and needs of any specific person who may receive it. Please be aware, that past performance is not a reliable indicator of future performance and/or results. Past Performance or Forward-looking scenarios based upon the reasonable beliefs of the third-party provider are not a guarantee of future performance. Actual results may differ materially from those anticipated in forward-looking or past performance statements. easyMarkets makes no representation or warranty and assumes no liability as to the accuracy or completeness of the information provided, nor any loss arising from any investment based on a recommendation, forecast or any information supplied by any third-party.
Risk Warning: 74% of retail investor accounts lose money when trading CFDs with this provider. You should consider whether you can afford to take the high risk of losing your money. Please refer to our full risk disclaimer on our website.
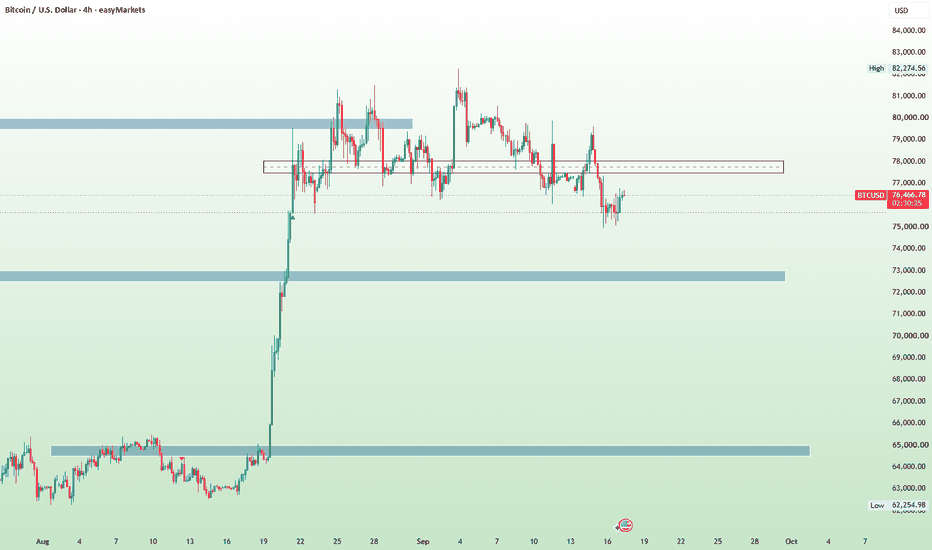
Bitcoin Swing Trading Scenarios With Bitcoin holding the 65K level, even during the geopolitical tensions. Also starting to form an intra-day higher highs and higher lows. We have couple of areas of interest and price levels we will be focusing on to either validate the continuation bullish move or to show us some reversal !
Disclaimer: easyMarkets Account on TradingView allows you to combine easyMarkets industry leading conditions, regulated trading and tight fixed spreads with TradingView's powerful social network for traders, advanced charting and analytics. Access no slippage on limit orders, tight fixed spreads, negative balance protection, no hidden fees or commission, and seamless integration.
Any opinions, news, research, analyses, prices, other information, or links to third-party sites contained on this website are provided on an "as-is" basis, are intended only to be informative, is not an advice nor a recommendation, nor research, or a record of our trading prices, or an offer of, or solicitation for a transaction in any financial instrument and thus should not be treated as such. The information provided does not involve any specific investment objectives, financial situation and needs of any specific person who may receive it. Please be aware, that past performance is not a reliable indicator of future performance and/or results. Past Performance or Forward-looking scenarios based upon the reasonable beliefs of the third-party provider are not a guarantee of future performance. Actual results may differ materially from those anticipated in forward-looking or past performance statements. easyMarkets makes no representation or warranty and assumes no liability as to the accuracy or completeness of the information provided, nor any loss arising from any investment based on a recommendation, forecast or any information supplied by any third-party.
Risk Warning: 74% of retail investor accounts lose money when trading CFDs with this provider. You should consider whether you can afford to take the high risk of losing your money. Please refer to our full risk disclaimer on our website.
Silver intra-day Analysis 04-Mar-2-2026Gold and Silver showed a bullish momentum after the geopolitical tensions that took place over the weekend.
Later on during yesterdays session we had some price retracement on both metals. The main reasons for the following is:
1. Dollar index strength, since Dxy is known to be safe haven in times of uncertainty
2. Inflation fear due to the rising on Energy prices.
In this video, we breakdown the possible scenarios on Silver and the price areas of interest.
Disclaimer: easyMarkets Account on TradingView allows you to combine easyMarkets industry leading conditions, regulated trading and tight fixed spreads with TradingView's powerful social network for traders, advanced charting and analytics. Access no slippage on limit orders, tight fixed spreads, negative balance protection, no hidden fees or commission, and seamless integration.
Any opinions, news, research, analyses, prices, other information, or links to third-party sites contained on this website are provided on an "as-is" basis, are intended only to be informative, is not an advice nor a recommendation, nor research, or a record of our trading prices, or an offer of, or solicitation for a transaction in any financial instrument and thus should not be treated as such. The information provided does not involve any specific investment objectives, financial situation and needs of any specific person who may receive it. Please be aware, that past performance is not a reliable indicator of future performance and/or results. Past Performance or Forward-looking scenarios based upon the reasonable beliefs of the third-party provider are not a guarantee of future performance. Actual results may differ materially from those anticipated in forward-looking or past performance statements. easyMarkets makes no representation or warranty and assumes no liability as to the accuracy or completeness of the information provided, nor any loss arising from any investment based on a recommendation, forecast or any information supplied by any third-party.
Risk Warning: 74% of retail investor accounts lose money when trading CFDs with this provider. You should consider whether you can afford to take the high risk of losing your money. Please refer to our full risk disclaimer on our website.
USD/JPY Intra-Day AnalysisBreaking down Usd/Jpy price action and fundamentals moving this pair.
Keeping in mind, the areas where we could have Japanese Yen "Intervention" risk !
Disclaimer: easyMarkets Account on TradingView allows you to combine easyMarkets industry leading conditions, regulated trading and tight fixed spreads with TradingView's powerful social network for traders, advanced charting and analytics. Access no slippage on limit orders, tight fixed spreads, negative balance protection, no hidden fees or commission, and seamless integration.
Any opinions, news, research, analyses, prices, other information, or links to third-party sites contained on this website are provided on an "as-is" basis, are intended only to be informative, is not an advice nor a recommendation, nor research, or a record of our trading prices, or an offer of, or solicitation for a transaction in any financial instrument and thus should not be treated as such. The information provided does not involve any specific investment objectives, financial situation and needs of any specific person who may receive it. Please be aware, that past performance is not a reliable indicator of future performance and/or results. Past Performance or Forward-looking scenarios based upon the reasonable beliefs of the third-party provider are not a guarantee of future performance. Actual results may differ materially from those anticipated in forward-looking or past performance statements. easyMarkets makes no representation or warranty and assumes no liability as to the accuracy or completeness of the information provided, nor any loss arising from any investment based on a recommendation, forecast or any information supplied by any third-party.
Risk Warning: 74% of retail investor accounts lose money when trading CFDs with this provider. You should consider whether you can afford to take the high risk of losing your money. Please refer to our full risk disclaimer on our website.
Bitcoin Higher Time Frame Analysis For the past couple of months, Bitcoin has been trading in a higher time frame consolidation range between 84K & 97K.
Looking at the price action, when price broke above the 95K, the move was short lived, and it snapped back directly below the level.
After the recent de-escalation in the Geopolitical tensions taking place between US and Europe, we see that markets are back to neutral/risk on environment.
Areas of interest to monitor:
* Intra candles closing below the 84K, the next area we could retest is 73-74K.
This is a very important key level, where if we see candles failing to break lower, and price rejecting, this could show a possibility for price to move back up, with first target at 96k.
Incase we broke above the 96K, price could have the potential to retest the previous all time highs at 125K if its supported by the bullish momentum.
* If price action continued to be bearish, and was able to close below 74K. There could be a possibility to test a previous strong support at at 51K.
Reaching this level, traders should monitor price action closely. incase any signs of sellers exhaustion, and reversal. We could see a move up t the previous level of 74K.
Disclaimer: easyMarkets Account on TradingView allows you to combine easyMarkets industry leading conditions, regulated trading and tight fixed spreads with TradingView's powerful social network for traders, advanced charting and analytics. Access no slippage on limit orders, tight fixed spreads, negative balance protection, no hidden fees or commission, and seamless integration.
Any opinions, news, research, analyses, prices, other information, or links to third-party sites contained on this website are provided on an "as-is" basis, are intended only to be informative, is not an advice nor a recommendation, nor research, or a record of our trading prices, or an offer of, or solicitation for a transaction in any financial instrument and thus should not be treated as such. The information provided does not involve any specific investment objectives, financial situation and needs of any specific person who may receive it. Please be aware, that past performance is not a reliable indicator of future performance and/or results. Past Performance or Forward-looking scenarios based upon the reasonable beliefs of the third-party provider are not a guarantee of future performance. Actual results may differ materially from those anticipated in forward-looking or past performance statements. easyMarkets makes no representation or warranty and assumes no liability as to the accuracy or completeness of the information provided, nor any loss arising from any investment based on a recommendation, forecast or any information supplied by any third-party.
Risk Warning: 74% of retail investor accounts lose money when trading CFDs with this provider. You should consider whether you can afford to take the high risk of losing your money. Please refer to our full risk disclaimer on our website
US Dollar Near Key LevelsThe US dollar is heading into an important session as investors turn their attention to US PPI and retail sales, two releases that could help define the next move for Federal Reserve policy.
PPI will give an update on inflation pressures at the producer level, while retail sales will offer a fresh look at consumer demand. Together, the data may indicate whether inflation remains firm enough to justify keeping rates elevated, or whether signs of cooling activity strengthen the case for rate cuts later this year.
What the Market Is Expecting
Core PPI month-over-month is forecast at 0.2%, matching the headline reading. On the demand side, retail sales are expected to rise 0.5%, recovering from a flat previous month, while core retail sales are seen at 0.4%.
Strong Data Could Support the Dollar
If both PPI and retail sales come in above expectations, it would suggest that inflation pressures remain sticky and that consumer demand is holding up. Such an outcome would likely reinforce the Fed’s “higher for longer” stance and reduce near-term expectations for rate cuts.
In this case, the US Dollar Index (DXY) could find support and attempt to push above the 99.0–99.2 area, with a move toward 99.5 possible.
Weak Data May Pressure the Dollar
On the other hand, softer-than-expected readings would point to easing inflation and slowing demand, potentially increasing expectations for earlier policy easing. Markets are currently pricing two rate cuts this year, compared with the Fed’s one cut indicated in the December dot plot.
A downside surprise could see DXY drift lower toward 98.5, with further weakness opening the door to 98.0 and potentially 97.5 if selling pressure builds.
Mixed Signals Likely Mean Consolidation
If the data delivers mixed or in-line results, the dollar may struggle to find direction. In that case, price action is likely to remain choppy as investors wait for clearer signals from upcoming labor market and inflation releases.
Bottom Line
With the US dollar sitting near key technical levels, PPI and retail sales could act as a near-term catalyst. How the data compares with expectations will be crucial in shaping rate-cut pricing and short-term dollar direction.
Disclaimer: easyMarkets Account on TradingView allows you to combine easyMarkets industry leading conditions, regulated trading and tight fixed spreads with TradingView's powerful social network for traders, advanced charting and analytics. Access no slippage on limit orders, tight fixed spreads, negative balance protection, no hidden fees or commission, and seamless integration.
Any opinions, news, research, analyses, prices, other information, or links to third-party sites contained on this website are provided on an "as-is" basis, are intended only to be informative, is not an advice nor a recommendation, nor research, or a record of our trading prices, or an offer of, or solicitation for a transaction in any financial instrument and thus should not be treated as such. The information provided does not involve any specific investment objectives, financial situation and needs of any specific person who may receive it. Please be aware, that past performance is not a reliable indicator of future performance and/or results. Past Performance or Forward-looking scenarios based upon the reasonable beliefs of the third-party provider are not a guarantee of future performance. Actual results may differ materially from those anticipated in forward-looking or past performance statements. easyMarkets makes no representation or warranty and assumes no liability as to the accuracy or completeness of the information provided, nor any loss arising from any investment based on a recommendation, forecast or any information supplied by any third-party.
Risk Warning: 74% of retail investor accounts lose money when trading CFDs with this provider. You should consider whether you can afford to take the high risk of losing your money. Please refer to our full risk disclaimer on our website.
Dxy Analysis & FOMC Minutes Impact ! With FOMC Minutes coming up next week, incase we had any surprises we could see the following scenarios:
The Dollar Index is currently testing major support at 97.50.
Scenario 1: Hawkish Surprise (Bullish)If minutes show the majority seriously considered a "pause" due to inflation fears, expect a bounce.
Target: Break above resistance to test 98.30 and potentially 99.00.
Scenario 2: Dovish Signal (Bearish)If discussions focus on panic over the 4.6% unemployment rate, support at 97.00 - 97.50 could fail.
Target: A clean break toward 96.00.
Scenario 3: Holiday Neutral If no new details emerge, the DXY will likely consolidate in the current range until the January economic data.
Bottom Line: The "easy cuts" are over. Next week’s minutes will reveal if the Fed is pivoting to protect jobs or fighting the ghost of inflation.
Disclaimer: easyMarkets Account on TradingView allows you to combine easyMarkets industry leading conditions, regulated trading and tight fixed spreads with TradingView's powerful social network for traders, advanced charting and analytics. Access no slippage on limit orders, tight fixed spreads, negative balance protection, no hidden fees or commission, and seamless integration.
Any opinions, news, research, analyses, prices, other information, or links to third-party sites contained on this website are provided on an "as-is" basis, are intended only to be informative, is not an advice nor a recommendation, nor research, or a record of our trading prices, or an offer of, or solicitation for a transaction in any financial instrument and thus should not be treated as such. The information provided does not involve any specific investment objectives, financial situation and needs of any specific person who may receive it. Please be aware, that past performance is not a reliable indicator of future performance and/or results. Past Performance or Forward-looking scenarios based upon the reasonable beliefs of the third-party provider are not a guarantee of future performance. Actual results may differ materially from those anticipated in forward-looking or past performance statements. easyMarkets makes no representation or warranty and assumes no liability as to the accuracy or completeness of the information provided, nor any loss arising from any investment based on a recommendation, forecast or any information supplied by any third-party.
Risk Warning: 74% of retail investor accounts lose money when trading CFDs with this provider. You should consider whether you can afford to take the high risk of losing your money. Please refer to our full risk disclaimer on our website.
Silver Historical High - intraday Analysis 01-Dec-2025Silver prices reached a new all time high supported by several fundamental factors:
* Fed rate cut expectations which are currently at 90% that we will have rate cut in Dec-25 meeting.
* Demand on Silver especially that its used in production related to technology and AI.
In this video, we mark several area of interest we will be monitoring in the upcoming days/weeks.
Disclaimer: easyMarkets Account on TradingView allows you to combine easyMarkets industry leading conditions, regulated trading and tight fixed spreads with TradingView's powerful social network for traders, advanced charting and analytics. Access no slippage on limit orders, tight fixed spreads, negative balance protection, no hidden fees or commission, and seamless integration.
Any opinions, news, research, analyses, prices, other information, or links to third-party sites contained on this website are provided on an "as-is" basis, are intended only to be informative, is not an advice nor a recommendation, nor research, or a record of our trading prices, or an offer of, or solicitation for a transaction in any financial instrument and thus should not be treated as such. The information provided does not involve any specific investment objectives, financial situation and needs of any specific person who may receive it. Please be aware, that past performance is not a reliable indicator of future performance and/or results. Past Performance or Forward-looking scenarios based upon the reasonable beliefs of the third-party provider are not a guarantee of future performance. Actual results may differ materially from those anticipated in forward-looking or past performance statements. easyMarkets makes no representation or warranty and assumes no liability as to the accuracy or completeness of the information provided, nor any loss arising from any investment based on a recommendation, forecast or any information supplied by any third-party.
Risk Warning: 74% of retail investor accounts lose money when trading CFDs with this provider. You should consider whether you can afford to take the high risk of losing your money. Please refer to our full risk disclaimer on our website.
Bitcoin Bearish Price Action ! Whats next ? Zooming out on bitcoin, after price broke below the 100K level due to profit taking, risk-off sentiment in the market, and Fed rate cuts delayed for December meeting.
Its very important to zoom out with such high volatility and mark areas of interest when planning your next trade.
Check our video to see what possible scenarios we could have on Bitcoin.
Disclaimer: easyMarkets Account on TradingView allows you to combine easyMarkets industry leading conditions, regulated trading and tight fixed spreads with TradingView's powerful social network for traders, advanced charting and analytics. Access no slippage on limit orders, tight fixed spreads, negative balance protection, no hidden fees or commission, and seamless integration.
Any opinions, news, research, analyses, prices, other information, or links to third-party sites contained on this website are provided on an "as-is" basis, are intended only to be informative, is not an advice nor a recommendation, nor research, or a record of our trading prices, or an offer of, or solicitation for a transaction in any financial instrument and thus should not be treated as such. The information provided does not involve any specific investment objectives, financial situation and needs of any specific person who may receive it. Please be aware, that past performance is not a reliable indicator of future performance and/or results. Past Performance or Forward-looking scenarios based upon the reasonable beliefs of the third-party provider are not a guarantee of future performance. Actual results may differ materially from those anticipated in forward-looking or past performance statements. easyMarkets makes no representation or warranty and assumes no liability as to the accuracy or completeness of the information provided, nor any loss arising from any investment based on a recommendation, forecast or any information supplied by any third-party.
Risk Warning: 74% of retail investor accounts lose money when trading CFDs with this provider. You should consider whether you can afford to take the high risk of losing your money. Please refer to our full risk disclaimer on our website.
Dxy Analysis Pre-FOMC 29-Oct-25The Dxy has been rejecting the 99 level since last week.
With the lack of economic data due to US Government Shutdown, the markets main focus now is on todays FOMC meeting.
25Bps is already priced in, so what will be more important is the tone and forward guidance we could get from Jerome Powell.
* If we see a surprising 50Bps cut, or the 25 bps cut with dovish tone: this could lead dollar index to break below 98.3 & test the 97.3 level. Even with potential to break lower into the 96 price level once again.
* 25bps with neutral tone: Since already priced in, and nothing new will be given to the markets, Dxy could be testing the 99 level, and keep trading in a consolidation range between the 98 and 99.
* No cut, or 25bps with hawkish tone: Dxy could break above the 99 price level, with next area of interest to test which is the 100 level.
Disclaimer: easyMarkets Account on TradingView allows you to combine easyMarkets industry leading conditions, regulated trading and tight fixed spreads with TradingView's powerful social network for traders, advanced charting and analytics. Access no slippage on limit orders, tight fixed spreads, negative balance protection, no hidden fees or commission, and seamless integration.
Any opinions, news, research, analyses, prices, other information, or links to third-party sites contained on this website are provided on an "as-is" basis, are intended only to be informative, is not an advice nor a recommendation, nor research, or a record of our trading prices, or an offer of, or solicitation for a transaction in any financial instrument and thus should not be treated as such. The information provided does not involve any specific investment objectives, financial situation and needs of any specific person who may receive it. Please be aware, that past performance is not a reliable indicator of future performance and/or results. Past Performance or Forward-looking scenarios based upon the reasonable beliefs of the third-party provider are not a guarantee of future performance. Actual results may differ materially from those anticipated in forward-looking or past performance statements. easyMarkets makes no representation or warranty and assumes no liability as to the accuracy or completeness of the information provided, nor any loss arising from any investment based on a recommendation, forecast or any information supplied by any third-party.
Risk Warning: 74% of retail investor accounts lose money when trading CFDs with this provider. You should consider whether you can afford to take the high risk of losing your money. Please refer to our full risk disclaimer on our website.
Gold Intra-day Analysis 22-Oct-25
A quick short video on Gold after the strong profit taking we saw yesterday.
We are focusing on higher time frame areas in interest to watch for the price action as we reach them.
Disclaimer: easyMarkets Account on TradingView allows you to combine easyMarkets industry leading conditions, regulated trading and tight fixed spreads with TradingView's powerful social network for traders, advanced charting and analytics. Access no slippage on limit orders, tight fixed spreads, negative balance protection, no hidden fees or commission, and seamless integration.
Any opinions, news, research, analyses, prices, other information, or links to third-party sites contained on this website are provided on an "as-is" basis, are intended only to be informative, is not an advice nor a recommendation, nor research, or a record of our trading prices, or an offer of, or solicitation for a transaction in any financial instrument and thus should not be treated as such. The information provided does not involve any specific investment objectives, financial situation and needs of any specific person who may receive it. Please be aware, that past performance is not a reliable indicator of future performance and/or results. Past Performance or Forward-looking scenarios based upon the reasonable beliefs of the third-party provider are not a guarantee of future performance. Actual results may differ materially from those anticipated in forward-looking or past performance statements. easyMarkets makes no representation or warranty and assumes no liability as to the accuracy or completeness of the information provided, nor any loss arising from any investment based on a recommendation, forecast or any information supplied by any third-party.
Risk Warning: 74% of retail investor accounts lose money when trading CFDs with this provider. You should consider whether you can afford to take the high risk of losing your money. Please refer to our full risk disclaimer on our website.
Gold Profit Taking or another Bullish Run ? 20-Oct-25Gold saw some profit last week from its new record breaking high.
Currently we are monitoring some areas of interest to watch out for continuation bullish momentum, or breaking lower indicating a shift in structure.
Disclaimer: easyMarkets Account on TradingView allows you to combine easyMarkets industry leading conditions, regulated trading and tight fixed spreads with TradingView's powerful social network for traders, advanced charting and analytics. Access no slippage on limit orders, tight fixed spreads, negative balance protection, no hidden fees or commission, and seamless integration.
Any opinions, news, research, analyses, prices, other information, or links to third-party sites contained on this website are provided on an "as-is" basis, are intended only to be informative, is not an advice nor a recommendation, nor research, or a record of our trading prices, or an offer of, or solicitation for a transaction in any financial instrument and thus should not be treated as such. The information provided does not involve any specific investment objectives, financial situation and needs of any specific person who may receive it. Please be aware, that past performance is not a reliable indicator of future performance and/or results. Past Performance or Forward-looking scenarios based upon the reasonable beliefs of the third-party provider are not a guarantee of future performance. Actual results may differ materially from those anticipated in forward-looking or past performance statements. easyMarkets makes no representation or warranty and assumes no liability as to the accuracy or completeness of the information provided, nor any loss arising from any investment based on a recommendation, forecast or any information supplied by any third-party.
Risk Warning: 74% of retail investor accounts lose money when trading CFDs with this provider. You should consider whether you can afford to take the high risk of losing your money. Please refer to our full risk disclaimer on our website.
Gold Breaking $4200 : Intra-Day Analysis 15-Oct-25
Several Fundamental factors have been supporting Gold bullish momentum, starting Central banks purchases, Hedging against USD, Market expectations of rate cut, US Debt fear, and Trade war tensions.
These factors are leading Gold to print new historical highs on Weekly and sometimes on Daily basis.
In this video, we breakdown the technical and the areas of interest to focus on.
Disclaimer: easyMarkets Account on TradingView allows you to combine easyMarkets industry leading conditions, regulated trading and tight fixed spreads with TradingView's powerful social network for traders, advanced charting and analytics. Access no slippage on limit orders, tight fixed spreads, negative balance protection, no hidden fees or commission, and seamless integration.
Any opinions, news, research, analyses, prices, other information, or links to third-party sites contained on this website are provided on an "as-is" basis, are intended only to be informative, is not an advice nor a recommendation, nor research, or a record of our trading prices, or an offer of, or solicitation for a transaction in any financial instrument and thus should not be treated as such. The information provided does not involve any specific investment objectives, financial situation and needs of any specific person who may receive it. Please be aware, that past performance is not a reliable indicator of future performance and/or results. Past Performance or Forward-looking scenarios based upon the reasonable beliefs of the third-party provider are not a guarantee of future performance. Actual results may differ materially from those anticipated in forward-looking or past performance statements. easyMarkets makes no representation or warranty and assumes no liability as to the accuracy or completeness of the information provided, nor any loss arising from any investment based on a recommendation, forecast or any information supplied by any third-party.
Risk Warning: 74% of retail investor accounts lose money when trading CFDs with this provider. You should consider whether you can afford to take the high risk of losing your money. Please refer to our full risk disclaimer on our website.
ETH Intra-Day Analysis 13-Oct-25
After the Sell-off that took place on Friday Oct-10, due to the fear in the markets after the US President announced 100% tariffs on Chinese Exports.
The move triggered massive liquidation which wiped out around 19B in 1 day.
Later during the weekend we started to head a de-escalation tone from Trump.
In this video, we are sharing the areas of interest we will be looking at on ETH.
Disclaimer: easyMarkets Account on TradingView allows you to combine easyMarkets industry leading conditions, regulated trading and tight fixed spreads with TradingView's powerful social network for traders, advanced charting and analytics. Access no slippage on limit orders, tight fixed spreads, negative balance protection, no hidden fees or commission, and seamless integration.
Any opinions, news, research, analyses, prices, other information, or links to third-party sites contained on this website are provided on an "as-is" basis, are intended only to be informative, is not an advice nor a recommendation, nor research, or a record of our trading prices, or an offer of, or solicitation for a transaction in any financial instrument and thus should not be treated as such. The information provided does not involve any specific investment objectives, financial situation and needs of any specific person who may receive it. Please be aware, that past performance is not a reliable indicator of future performance and/or results. Past Performance or Forward-looking scenarios based upon the reasonable beliefs of the third-party provider are not a guarantee of future performance. Actual results may differ materially from those anticipated in forward-looking or past performance statements. easyMarkets makes no representation or warranty and assumes no liability as to the accuracy or completeness of the information provided, nor any loss arising from any investment based on a recommendation, forecast or any information supplied by any third-party.
Risk Warning: 74% of retail investor accounts lose money when trading CFDs with this provider. You should consider whether you can afford to take the high risk of losing your money. Please refer to our full risk disclaimer on our website.
Usd/Jpy Intra-day Analysis 07-Oct-25Japanese Yen is showing a weakness due to the expectations that new leader will pursue looser monetary and fiscal policy. At the same time the dollar index is still holding in the range after rejecting the 96 technical level.
Usd/Jpy is currently at an important technical level around 151.
In this video, we discuss the scenarios and important areas of interest to keep an eye on, in addition to the possible price reactions we could have !
Disclaimer: easyMarkets Account on TradingView allows you to combine easyMarkets industry leading conditions, regulated trading and tight fixed spreads with TradingView's powerful social network for traders, advanced charting and analytics. Access no slippage on limit orders, tight fixed spreads, negative balance protection, no hidden fees or commission, and seamless integration.
Any opinions, news, research, analyses, prices, other information, or links to third-party sites contained on this website are provided on an "as-is" basis, are intended only to be informative, is not an advice nor a recommendation, nor research, or a record of our trading prices, or an offer of, or solicitation for a transaction in any financial instrument and thus should not be treated as such. The information provided does not involve any specific investment objectives, financial situation and needs of any specific person who may receive it. Please be aware, that past performance is not a reliable indicator of future performance and/or results. Past Performance or Forward-looking scenarios based upon the reasonable beliefs of the third-party provider are not a guarantee of future performance. Actual results may differ materially from those anticipated in forward-looking or past performance statements. easyMarkets makes no representation or warranty and assumes no liability as to the accuracy or completeness of the information provided, nor any loss arising from any investment based on a recommendation, forecast or any information supplied by any third-party.
Risk Warning: 74% of retail investor accounts lose money when trading CFDs with this provider. You should consider whether you can afford to take the high risk of losing your money. Please refer to our full risk disclaimer on our website.
Bitcoin Intra-day Analysis 30-Sep-2025After Bitcoin reached a new all-time high in mid-August above 124K, the market experienced notable profit-taking.
Since then, prices have shown resilience around the 107–108K area, with repeated bounces but no successful retest of the previous peak.
From here, several market paths are possible:
* If prices approach 114,750 but fail to close higher, this would suggest momentum is slowing, with the potential for the market to revisit the 109K–108K range.
* Alternatively, a daily or intraday close above 115K could open room for further movement towards the 118K area.
* At 118K, weakening upward pressure could lead to renewed rejection. However, if candles establish closes above 119K, the market could move closer to retesting the prior highs near 124K.
Disclaimer: easyMarkets Account on TradingView allows you to combine easyMarkets industry leading conditions, regulated trading and tight fixed spreads with TradingView's powerful social network for traders, advanced charting and analytics. Access no slippage on limit orders, tight fixed spreads, negative balance protection, no hidden fees or commission, and seamless integration.
Any opinions, news, research, analyses, prices, other information, or links to third-party sites contained on this website are provided on an "as-is" basis, are intended only to be informative, is not an advice nor a recommendation, nor research, or a record of our trading prices, or an offer of, or solicitation for a transaction in any financial instrument and thus should not be treated as such. The information provided does not involve any specific investment objectives, financial situation and needs of any specific person who may receive it. Please be aware, that past performance is not a reliable indicator of future performance and/or results. Past Performance or Forward-looking scenarios based upon the reasonable beliefs of the third-party provider are not a guarantee of future performance. Actual results may differ materially from those anticipated in forward-looking or past performance statements. easyMarkets makes no representation or warranty and assumes no liability as to the accuracy or completeness of the information provided, nor any loss arising from any investment based on a recommendation, forecast or any information supplied by any third-party.
Risk Warning: 74% of retail investor accounts lose money when trading CFDs with this provider. You should consider whether you can afford to take the high risk of losing your money. Please refer to our full risk disclaimer on our website.
Gold Intra-Day Analysis 27-Aug-2025Gold is stuck in a higher time frame consolidation range.
We saw couple of momentum price movement during August which was mainly related to NFP and the other during Powell speech at the Jackson Hole Symposium.
The main areas of interest for Gold are: 3355, 3385, 3400 & 3430s
Disclaimer: easyMarkets Account on TradingView allows you to combine easyMarkets industry leading conditions, regulated trading and tight fixed spreads with TradingView's powerful social network for traders, advanced charting and analytics. Access no slippage on limit orders, tight fixed spreads, negative balance protection, no hidden fees or commission, and seamless integration.
Any opinions, news, research, analyses, prices, other information, or links to third-party sites contained on this website are provided on an "as-is" basis, are intended only to be informative, is not an advice nor a recommendation, nor research, or a record of our trading prices, or an offer of, or solicitation for a transaction in any financial instrument and thus should not be treated as such. The information provided does not involve any specific investment objectives, financial situation and needs of any specific person who may receive it. Please be aware, that past performance is not a reliable indicator of future performance and/or results. Past Performance or Forward-looking scenarios based upon the reasonable beliefs of the third-party provider are not a guarantee of future performance. Actual results may differ materially from those anticipated in forward-looking or past performance statements. easyMarkets makes no representation or warranty and assumes no liability as to the accuracy or completeness of the information provided, nor any loss arising from any investment based on a recommendation, forecast or any information supplied by any third-party.
Silver Intra-day Analysis 18-Aug-25After Silver reached the 39.5 we saw some profit taking moves. Currently the areas of interest we will be focusing on are the following:
* Breaking above 38.5
* Revisit of 39.5
* Breaking below 37.5
Keeping in mind to monitor the price action at these price levels, so we can access if we could see a reversal of continuation move.
Disclaimer: easyMarkets Account on TradingView allows you to combine easyMarkets industry leading conditions, regulated trading and tight fixed spreads with TradingView's powerful social network for traders, advanced charting and analytics. Access no slippage on limit orders, tight fixed spreads, negative balance protection, no hidden fees or commission, and seamless integration.
Any opinions, news, research, analyses, prices, other information, or links to third-party sites contained on this website are provided on an "as-is" basis, are intended only to be informative, is not an advice nor a recommendation, nor research, or a record of our trading prices, or an offer of, or solicitation for a transaction in any financial instrument and thus should not be treated as such. The information provided does not involve any specific investment objectives, financial situation and needs of any specific person who may receive it. Please be aware, that past performance is not a reliable indicator of future performance and/or results. Past Performance or Forward-looking scenarios based upon the reasonable beliefs of the third-party provider are not a guarantee of future performance. Actual results may differ materially from those anticipated in forward-looking or past performance statements. easyMarkets makes no representation or warranty and assumes no liability as to the accuracy or completeness of the information provided, nor any loss arising from any investment based on a recommendation, forecast or any information supplied by any third-party.
Bitcoin Intraday Analysis 31-Jul-25Quick analysis on bitcoin, the main area of interest i will be monitoring are 110,500, 115k, 120K. Keeping in mind that we still have important economic data tomorrow (US Employment Data).
Disclaimer: easyMarkets Account on TradingView allows you to combine easyMarkets industry leading conditions, regulated trading and tight fixed spreads with TradingView's powerful social network for traders, advanced charting and analytics. Access no slippage on limit orders, tight fixed spreads, negative balance protection, no hidden fees or commission, and seamless integration.
Any opinions, news, research, analyses, prices, other information, or links to third-party sites contained on this website are provided on an "as-is" basis, are intended only to be informative, is not an advice nor a recommendation, nor research, or a record of our trading prices, or an offer of, or solicitation for a transaction in any financial instrument and thus should not be treated as such. The information provided does not involve any specific investment objectives, financial situation and needs of any specific person who may receive it. Please be aware, that past performance is not a reliable indicator of future performance and/or results. Past Performance or Forward-looking scenarios based upon the reasonable beliefs of the third-party provider are not a guarantee of future performance. Actual results may differ materially from those anticipated in forward-looking or past performance statements. easyMarkets makes no representation or warranty and assumes no liability as to the accuracy or completeness of the information provided, nor any loss arising from any investment based on a recommendation, forecast or any information supplied by any third-party.
XRP Intra-day Analysis 18-Jul-2025Price action on XRP has shown upward momentum after reaching the 3.7 price level.
Possible scenarios include:
* The 3.3 level could come into focus if the market revisits this area. Market participants may monitor it for signs of seller exhaustion or potential reversal patterns.
* Should the price move lower, the 3.0 level may act as the next key area of interest. This round number is often viewed as a psychological level and may attract increased attention from traders.
* If there is a clear intraday move below the 3.0 level, the 2.6 area could emerge as another notable zone that some participants may consider relevant for future market reactions.
Disclaimer: easyMarkets Account on TradingView allows you to combine easyMarkets industry leading conditions, regulated trading and tight fixed spreads with TradingView's powerful social network for traders, advanced charting and analytics. Access no slippage on limit orders, tight fixed spreads, negative balance protection, no hidden fees or commission, and seamless integration.
Any opinions, news, research, analyses, prices, other information, or links to third-party sites contained on this website are provided on an "as-is" basis, are intended only to be informative, is not an advice nor a recommendation, nor research, or a record of our trading prices, or an offer of, or solicitation for a transaction in any financial instrument and thus should not be treated as such. The information provided does not involve any specific investment objectives, financial situation and needs of any specific person who may receive it. Please be aware, that past performance is not a reliable indicator of future performance and/or results. Past Performance or Forward-looking scenarios based upon the reasonable beliefs of the third-party provider are not a guarantee of future performance. Actual results may differ materially from those anticipated in forward-looking or past performance statements. easyMarkets makes no representation or warranty and assumes no liability as to the accuracy or completeness of the information provided, nor any loss arising from any investment based on a recommendation, forecast or any information supplied by any third-party.
Nasdaq Analysis 07-Jul-25In this video we are discussing the main fundamental reason behind Nasdaq bullish momentum.
In addition to area if interest with possible scenarios.
Disclaimer: easyMarkets Account on TradingView allows you to combine easyMarkets industry leading conditions, regulated trading and tight fixed spreads with TradingView's powerful social network for traders, advanced charting and analytics. Access no slippage on limit orders, tight fixed spreads, negative balance protection, no hidden fees or commission, and seamless integration.
Any opinions, news, research, analyses, prices, other information, or links to third-party sites contained on this website are provided on an "as-is" basis, are intended only to be informative, is not an advice nor a recommendation, nor research, or a record of our trading prices, or an offer of, or solicitation for a transaction in any financial instrument and thus should not be treated as such. The information provided does not involve any specific investment objectives, financial situation and needs of any specific person who may receive it. Please be aware, that past performance is not a reliable indicator of future performance and/or results. Past Performance or Forward-looking scenarios based upon the reasonable beliefs of the third-party provider are not a guarantee of future performance. Actual results may differ materially from those anticipated in forward-looking or past performance statements. easyMarkets makes no representation or warranty and assumes no liability as to the accuracy or completeness of the information provided, nor any loss arising from any investment based on a recommendation, forecast or any information supplied by any third-party.