GOLD - The Hunt for Liquidity Ahead of a Decline ICMARKETS:XAUUSD continues to form a countertrend correction, driven by the decline in oil prices. The fundamental backdrop remains weak...
The dollar is stagnating after a strong rally triggered by the Fed’s hawkish stance and rising interest rates. However, the Dollar Index remains strong, which continues to put pressure on gold. At the same time, the decline in oil prices has given the metal some room to recover. The market remains highly dependent on geopolitical developments.
There is not much major news ahead next week, with the key focus on PMI data and Friday’s Durable Goods Orders. Technically, gold remains under pressure from the bearish trend
Resistance levels: 4,402, 4,434, 4,511
Support levels: 4,340, 4,250, 4,200
Gold is forming a countertrend correction. The dollar remains strong, while the fundamental backdrop is unfavorable for gold due to the Fed’s hawkish stance and rising interest rates.
Technically, the key focus is on two triggers: 4,402–4,434. A short squeeze could trigger a decline toward 4,340–4,250
Best regards,
R. Linda!  Short
Short
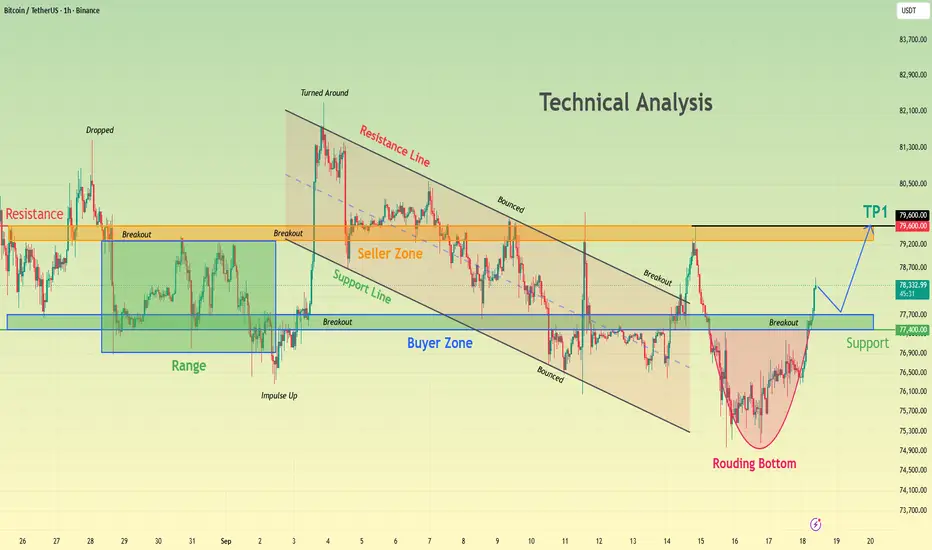
BITCOIN - A strong market. Retest of resistance BINANCE:BTCUSDT.P is maintaining its local bullish trend, while the five-week consolidation following the strong rally — during which the coin broke its medium-term bearish trend — points to underlying market strength
After breaking the trend and staging a strong rally, Bitcoin has been consolidating for five weeks. Negative news failed to trigger a decline, while the long squeeze became a technical catalyst for further upside.
The coin continues to confirm its bullish market structure. The breakout of the wedge resistance, which marks the consolidation boundary, is triggering another retest of key resistance. The main focus is on 82,300–82,800. A close above this zone could accelerate the move toward 86K
Resistance levels: 82,300, 82,850, 86,000
Support levels: 80,500, 80,000
A retest of the 82,800 resistance could trigger a correction, but if the market manages to hold the local pullback within the current range, this would provide another confirmation of the market’s readiness for a rally. A close above 83,000 could become a technical catalyst for further upside toward 86K–100K
Best regards,
R. Linda!  Long
Long
XAUUSD — Weekly Wave 5 Lower Toward 4,060
From Kelly’s view, gold enters next week inside a broader bearish corrective structure. Price is currently trading around 4,378, after recovering from the 4,240–4,250 area, but the rebound is still developing beneath a descending channel and an important sell zone around 4,390–4,410.
The key idea is simple: the current recovery may represent a corrective Wave (4), while the main weekly scenario remains a continuation lower into Wave (5) if sellers defend the upper resistance zone.
⟡ Market structure
Gold remains inside a descending structure after the major peak near 4,680. Recent rebounds have continued to form below important resistance, while the descending channel is still controlling the broader direction.
The current recovery from around 4,240 has pushed price back toward the 4,390–4,410 sell zone, where Fibonacci resistance and the projected Wave (4) completion area overlap.
For next week, 4,334 is the first important support. A clean break below this level could confirm renewed bearish momentum and expose the 4,240–4,255 area.
If that support also fails, the larger Wave (5) projection points toward the 4,045–4,075 zone.
➤ Key levels
◌ Current price area: 4,375–4,385
◌ Main sell zone: 4,390–4,410
◌ Strong resistance: 4,410–4,430
◌ Strong support: 4,334
◌ Secondary support: 4,240–4,255
◌ First target: 4,334
◌ Second target: 4,240–4,255
◌ Main target: 4,045–4,075
◌ Invalidation: Above 4,430
⌁ Elliott Wave view
Wave (1): The first bearish leg pushed price lower from the previous recovery high.
Wave (2): Gold produced a corrective rebound before sellers regained control.
Wave (3): The stronger bearish impulse extended toward the 4,240 area.
Wave (4): The current rebound may be completing near 4,390–4,410, where the descending channel and Fibonacci resistance overlap.
Wave (5): If sellers reject this zone, the final bearish leg could develop toward 4,240 first, followed by the larger 4,045–4,075 target area.
▸ Trading scenario
Preferred bearish scenario
Entry: 4,390–4,410 after bearish confirmation
Stop Loss: Above 4,430
Take Profit 1: 4,334
Take Profit 2: 4,240–4,255
Take Profit 3: 4,045–4,075
The cleaner plan is to wait for rejection from the sell zone rather than chase price lower around current levels. A bearish reaction near 4,390–4,410, followed by a break below 4,334, would strengthen the Wave (5) scenario.
Alternative scenario:
If gold breaks above 4,410–4,430 and holds above the descending structure, the bearish Wave (5) setup may be delayed and price could extend toward the next higher resistance before sellers regain control.
◌ Invalidation
The main bearish scenario would weaken if price gains sustained acceptance above 4,410, and a confirmed break above 4,430 would invalidate the preferred Wave (5) structure for next week.
⌁ Kelly’s view
Kelly’s main view remains bearish for next week while gold stays below 4,390–4,430.
The current rebound may still have room to test the sell zone, but the broader structure favors another bearish leg if sellers defend resistance. 4,334 is the first confirmation level, while 4,240–4,255 remains the next major support before the larger 4,045–4,075 Wave (5) target comes into focus.
Do you think gold will reject the 4,390–4,410 sell zone first, or break 4,334 directly next week? Short 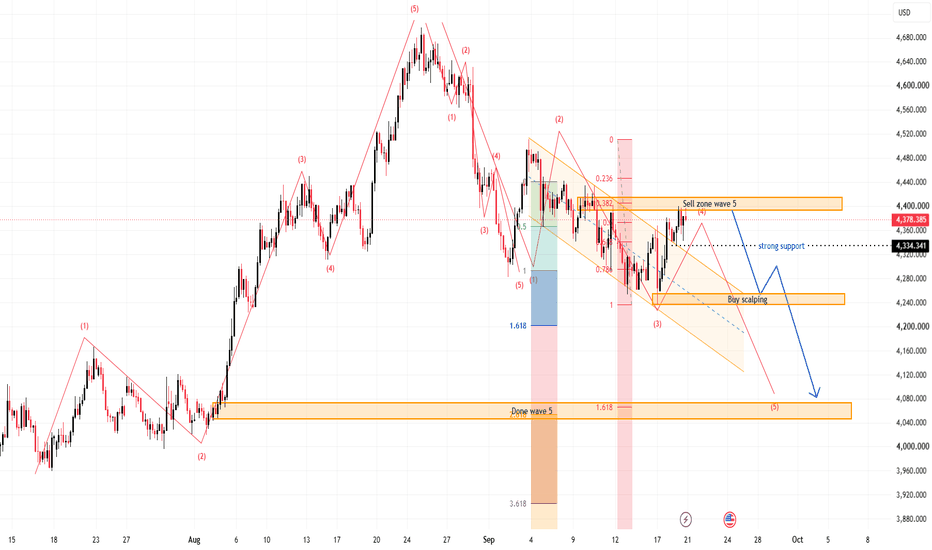
XAUUSD — Wave 5 Lower Toward 4,280
From Kelly’s view, gold is still trading inside a broader bearish structure. Price is currently around 4,352, while the recent rebound remains below the previous lower-high area near 4,380–4,395.
The key idea is simple: the current move may be completing a corrective Wave (4) around resistance, while the main structure still favors another bearish leg toward 4,320, 4,305, and potentially the 4,280 Wave (5) target zone.
⟡ Market structure
Gold continues to show a sequence of lower highs after failing around the 4,390 area.
The immediate resistance zone sits around 4,340–4,350, where the chart marks the projected Wave (4) sell zone. Price is currently testing this area, so the next reaction becomes important.
If sellers defend this zone and price breaks back below 4,320, bearish momentum could strengthen.
The 4,305 level is the next structural support. A confirmed breakdown below this level may expose the 4,278–4,288 area, where the projected Wave (5) completion and Fibonacci extension overlap.
➤ Key levels
◌ Current price area: 4,350–4,355
◌ Main sell zone: 4,340–4,350
◌ Strong resistance: 4,380–4,395
◌ First support: 4,318–4,325
◌ Strong support: 4,305
◌ First target: 4,320
◌ Second target: 4,305
◌ Main target: 4,278–4,288
◌ Invalidation: Above 4,395
⌁ Elliott Wave view
Wave (1): The first bearish impulse started from the recent local high and pushed price lower.
Wave (2): Gold produced a corrective rebound before sellers returned.
Wave (3): The next bearish leg extended toward the 4,320 area.
Wave (4): Price is now attempting another corrective recovery toward the 4,340–4,350 resistance zone.
Wave (5): If sellers reject this area, the final bearish leg could extend below 4,305 toward the 4,278–4,288 completion zone.
▸ Trading scenario
Preferred bearish scenario
Entry: 4,340–4,350 after bearish confirmation
Stop Loss: Above 4,395
Take Profit 1: 4,320
Take Profit 2: 4,305
Take Profit 3: 4,278–4,288
The cleaner plan is to wait for rejection around the projected Wave (4) resistance area. A break below 4,320, followed by loss of 4,305, would strengthen the continuation toward the Wave (5) target.
Alternative scenario:
If gold breaks above 4,350 and holds with strong bullish momentum, price could retest 4,380–4,395 before the broader bearish structure is reassessed.
◌ Invalidation
The bearish scenario would weaken if price gains sustained acceptance above 4,380, while a confirmed break above 4,395 would invalidate the preferred Wave (5) continuation setup.
⌁ Kelly’s view
Kelly’s main view remains bearish while gold stays below 4,380–4,395.
The current rebound looks more like a corrective Wave (4) than a confirmed trend reversal. If sellers defend 4,340–4,350, the next downside sequence may target 4,320, then 4,305, before the larger 4,278–4,288 Wave (5) zone comes into focus.
Do you think sellers will defend the Wave (4) zone, or will gold retest 4,390 first? Short 
XAUUSD — 4,365 Retest or 4,310 Sweep?
Gold is trading around 4,346 after losing the rising M30 trendline.
Short-term momentum has weakened, with 4,338 now acting as the first support.
Macro News
Treasury yields remain elevated after the Fed rate hike, while officials continue to warn that inflation is still too high. Oil prices are easing, which may reduce some inflation pressure, but higher yields remain a headwind for Gold.
The simple read
If 4,338 holds, Gold may recover toward 4,360–4,365.
If that resistance rejects, sellers could rotate price back toward 4,338 and potentially the deeper 4,310 support.
A clean reclaim above 4,365 would improve the structure and bring 4,397 back into focus.
Key price zones
4,338 — immediate support
4,360–4,365 — key resistance
4,310 — major support
4,397 — major swing high
The trendline break keeps short-term pressure bearish.
I prefer waiting for the 4,365 reaction rather than chasing price.
Can Gold reclaim 4,365, or will sellers push toward 4,310? Short 
Long 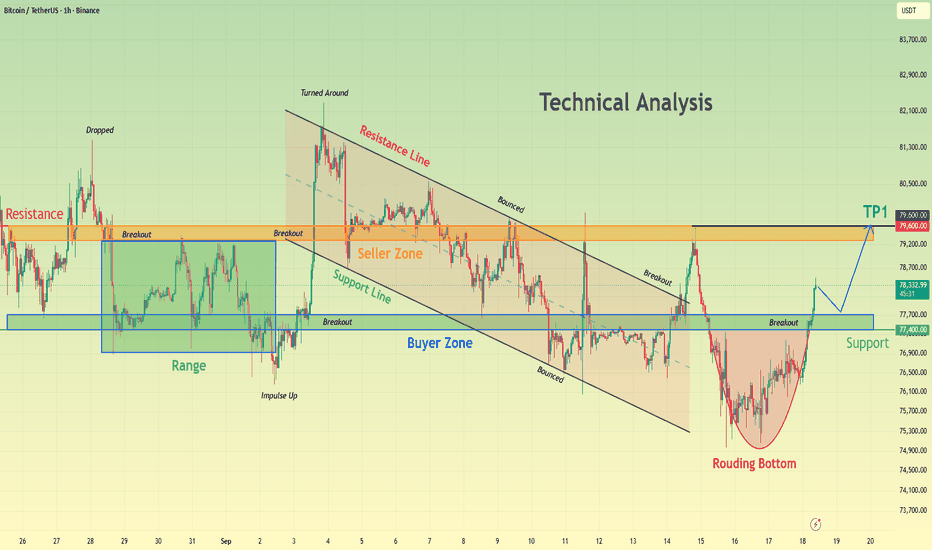
Gold – Stuck Riding the Fed Rate Outlook RollercoasterAfter last week’s sell off on Wednesday evening from 4360 down to a low of 4235 upon learning the Federal Reserve (Fed) had raised interest rates for the first time in 2026 and then the subsequent recovery back to close the week at 4378 on Friday, Gold prices seemingly continue to ride the positioning rollercoaster driven by market expectations of what the Fed may do next regarding interest rates over the final 3 months of 2026.
Hawkish comments from Fed member Kashkari on Sunday may have weighed on sentiment towards Gold early on Monday morning, helping to take prices down 0.7% to current levels around 4348. He suggested US inflation remains too high, and pressures may have broadened beyond the oil price shock of the Iran war (Bloomberg).
There could be more interest rate outlook headline driven volatility to come, with a variety of Federal Reserve policymakers scheduled to speak across the rest of the week. Traders remain sensitive to the possibility of 1 or even 2 further Fed hikes before the end of the year, and any comments that may support this outlook could further weigh on Gold prices which pay no interest or dividend.
Looking forward, it’s a quiet week for economic data so Gold traders may choose to focus on Fed policymaker commentary, the outcomes of the US-China Summit between President’s Trump and Xi on Thursday and any further updates on the possibility of finding a diplomatic solution to ease tensions in the Middle East.
Technical Update: Are Gold Buyers Attempting to Gain the Upper Hand?
From the August 25th high of 4697 down to the September 16th low at 4235 Gold has seen a roughly 10% decline, potentially as a reaction to what was a strong period of price strength for the metal between July 17th and August 25th (3959 to 4697). What is perhaps an encouraging sign for Gold bulls is that a key support at 4232 (61.8% Fibonacci retracement of the July 17th to August 25th strength) has helped to hold the recent decline and prompt an attempt at a recovery.
While this price action may appear to identify 4232 as the first key support focus for the coming week, what could be equally important is the declining Bollinger mid‑average as a resistance level. As the chart above shows, the mid-average resistance currently stands at 4407. The directional bias for Gold this week could be determined by which of these important levels either holds or gives way on a closing basis.
Potential Resistance Focus:
A falling Bollinger mid‑average that is above price activity always has the potential to be an important resistance focus. Therefore, 4407 is set to be monitored this week, with successful closing breaks above this level needed to suggest further attempts at price strength.
If a closing break above 4407 is seen, risks may then be skewed for further price strength to challenge the next potential resistance at 4511 (September 3rd high), and even 4697 (August 25th high). If 4697 were also to give way on a closing basis, it could see a continuation of the advance to challenge 4770 (50% Fibonacci retracement of January 29th to June 30th price weakness).
Potential Support Focus:
While the Bollinger mid‑average resistance at 4407 remains intact downside momentum may reemerge. This could open the way for retests of support at 4232 (61.8% retracement) to develop, with closing breaks below this level indicating the possibility of further negative momentum materialising.
If 4232 were broken on a closing basis, downside risks could shift toward tests of what might be viewed as a potentially strong support band between 3943 and 3959 (June 30th and July 17th price lows).
The material provided here has not been prepared accordance with legal requirements designed to promote the independence of investment research and as such is considered to be a marketing communication. Whilst it is not subject to any prohibition on dealing ahead of the dissemination of investment research, we will not seek to take any advantage before providing it to our clients.
Pepperstone doesn’t represent that the material provided here is accurate, current or complete, and therefore shouldn’t be relied upon as such. The information, whether from a third party or not, isn’t to be considered as a recommendation; or an offer to buy or sell; or the solicitation of an offer to buy or sell any security, financial product or instrument; or to participate in any particular trading strategy. It does not take into account readers’ financial situation or investment objectives. We advise any readers of this content to seek their own advice. Without the approval of Pepperstone, reproduction or redistribution of this information isn’t permitted. Long 
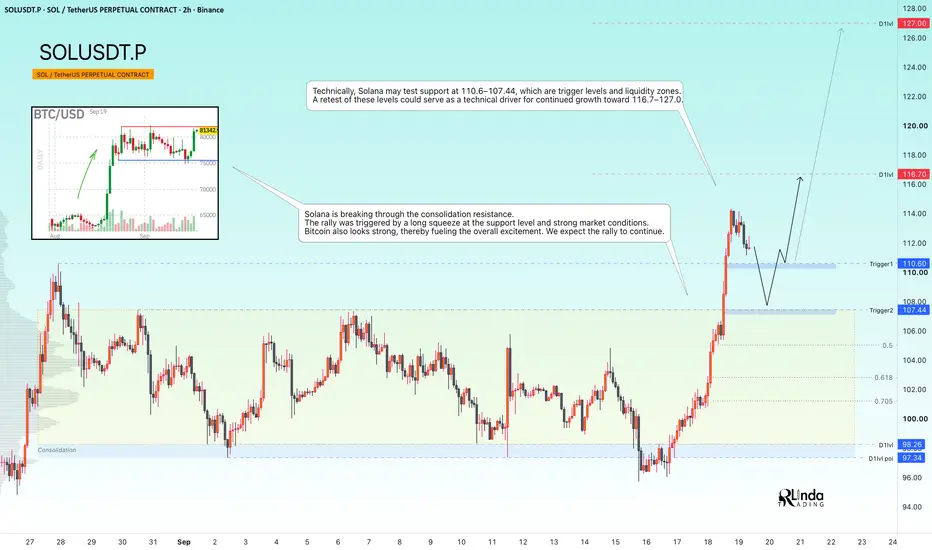
SOLUSDT - A hunt for liquidity ahead of the rally's continuationBINANCE:SOLUSDT confirms its bullish market structure. The long squeeze of support that we expected in the previous analysis played out perfectly. The bulls quickly took control of the situation and strengthened their positions...
Previously, we discussed how the market turned out to be stronger than expected: Bitcoin showed virtually no reaction to higher interest rates, the Fed’s hawkish stance, or the fact that the CLARITY Act was not passed. Consolidation continued, which further confirmed the strength of the market.
As for Solana, the altcoin is breaking through the consolidation resistance, suggesting that the coin is ready to continue its move higher. The rally was triggered by a long squeeze of support and the overall strength of the market
Resistance levels: 116.7, 127.0
Support levels: 110.6, 107. 44
Technically, Solana could retest the 110.6–107.44 support zone, which represents both key triggers and liquidity areas. A retest of these levels could become a technical catalyst for further upside toward 116.7–127.0
Best regards,
R. Linda!  Long
Long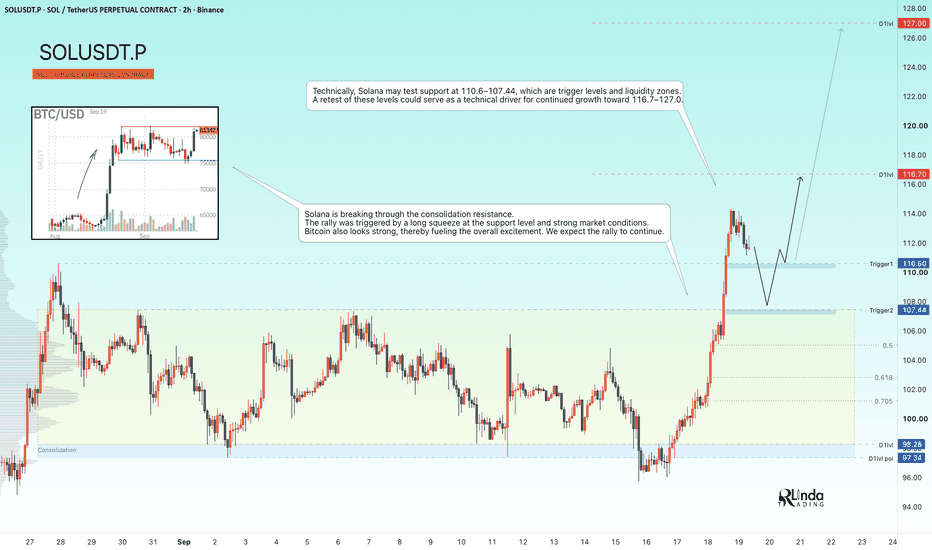
 Long
Long
SMTC – Breakout Above Previous High | Momentum AcceleratingHello Everyone, Followers,
I have been busy lately and less active in Tradingview. Other reason is my scans did not provide quality setups. This week I will share only one, let's drill down.
Semtech Corporation (SMTC) is showing one of the cleaner breakout structures on my watchlist.
After building a series of higher lows from the July bottom, price has now pushed through the previous major high around $176–177 and accelerated toward $185.
What catches my attention is the structure behind the move:
Higher low → Higher high → Resistance breakout → Momentum expansion.
The question now is whether SMTC can hold this breakout and continue toward the next major Fibonacci target.
📊 Technical Overview
The chart currently shows:
• Break above the previous major high around $176–177
• Strong bullish expansion following the breakout
• Price clearly above the major moving averages
• Rising trendline continues to support the broader bullish structure
• $176.87 Fib 0.618 has been reclaimed
• MACD turning higher again with bullish momentum
• Volume has expanded during the latest move
• Clear sequence of higher lows since the July correction
Technically, the structure remains bullish, although the sharp move means a short-term retest shouldn't be ignored.
🔹 Key Levels
🎯 Resistance
$185–190 → Immediate price / psychological zone
$194.80 → ⭐ Fib 0.786 / Major next target
$217.64 → Previous Fib 1.0 extension / Longer-term target
🟢 Support
$176.87 → ⭐ Fib 0.618 / Breakout zone
$164.27 → Fib 0.50
$151.67 → Fib 0.382 / Major structural support
$136.09 → Fib 0.236
For me, $176–177 is now the most important level to watch.
Previous resistance should ideally become new support.
🔮Outlook
SMTC has already made an important technical move by clearing the previous high.
After a breakout like this, I see two interesting possibilities:
1️⃣ Momentum continuation toward $194–195 without a significant pullback.
2️⃣ Breakout retest toward $176–177 before buyers attempt another leg higher.
I would actually consider the second scenario technically healthy after such a fast move.
🎯 What I Expect
🟢 Bullish Scenario
Hold above $176–177
Consolidate above the former resistance
Continue through $185–190
Challenge $194.80
Longer term, $217.64 comes into focus
🔄 Alternative Scenario
SMTC could cool down after the recent acceleration:
Pull back from the $185–190 area
Retest $176.87
Former resistance becomes support
Buyers return and attempt another breakout
A controlled retest wouldn't damage the bullish structure.
A decisive move back below $176 would make me more cautious and shift attention toward $164.27.
💡 My Take
I like what I see here.
SMTC spent several months recovering from its summer correction, while the chart continued producing higher lows. Now price has finally broken the previous major high and the 0.618 Fibonacci level.
That changes the technical picture considerably.
The stock may be slightly extended in the very short term, so I wouldn't be surprised to see some consolidation or a retest.
But as long as $176–177 holds, my attention remains on:
$185–190 → $194.80 → potentially $217.64. 👀🚀
Definitely one to keep on the watchlist.
If you enjoy and like clean, simple analysis — follow me for more.
This is just my thinking and it is not invesment suggestion , please do not make any decision with my anaylsis.
Have a green trade week to all  Long
Long
 Long
Long
EURUSD: 4H Major Demand (SUP 78) Meets 1H Falling Wedge BreakoutEURUSD Technical & Order-Flow Analysis | 4H Tactical · 1H Trigger
━━━━━━━━━━━━━━━━━━━━━━━━━━━━━━━━━━━━━━━━━━━━
QUICK SPECIFICATIONS
━━━━━━━━━━━━━━━━━━━━━━━━━━━━━━━━━━━━━━━━━━━━
• Asset: EUR/USD (Spot FX)
• Bias: Tactical Bullish (Long / Mean Reversion)
• Entry Zone: 1.1478 – 1.1485
• Structural Invalidation (SL): 1.14470 (~35 pips)
• Target 1: 1.15000 (+18–20 Pips · First hurdle & BE trigger)
• Target 2: 1.15300 (+48–50 Pips · Tactical intermediate target)
• Target 3: 1.15550 (+72–75 Pips · Front-running major 124-touch wall)
• Risk / Reward: Up to 1 : 2.2
━━━━━━━━━━━━━━━━━━━━━━━━━━━━━━━━━━━━━━━━━━━━
1. THE MACRO PICTURE (4H): HISTORICAL DEMAND DEFENSE
━━━━━━━━━━━━━━━━━━━━━━━━━━━━━━━━━━━━━━━━━━━━
Following the 220-pip liquidation from the August high (1.1700), EURUSD has compressed into a multi-month institutional accumulation shelf:
• SUP 78 (29+ historical touches between 1.1465 and 1.1485)
• SUP 76 (21+ historical touches at 1.1455)
This price pocket has served as a reliable floor in March, May, and early August. Over the last 4 sessions, downside impulse momentum has noticeably flattened out, indicating sell-side exhaustion.
━━━━━━━━━━━━━━━━━━━━━━━━━━━━━━━━━━━━━━━━━━━━
2. TACTICAL CONFIRMATION (1H & 15M)
━━━━━━━━━━━━━━━━━━━━━━━━━━━━━━━━━━━━━━━━━━━━
While 4H establishes the location, lower timeframes provide the execution trigger:
1. Double-Bottom Liquidity Sweep:
Price tested 1.14550 on Sept 17 and retested it on Sept 18, printing long absorption wicks with zero follow-through breakdown.
2. Descending Wedge Breakout Confirmed:
• Market Regime: Descending Wedge (5.6 ATR span)
• Structure State: Bullish Break Confirmed
• Footprint Delta: +35% Aggressive Buyer Delta
3. 15M Trend Alignment:
The 15M execution frame has flipped into "Breakout Trend" with a series of higher lows (1.1455 → 1.1468 → 1.1475) and a 92% historical zone delivery rate.
━━━━━━━━━━━━━━━━━━━━━━━━━━━━━━━━━━━━━━━━━━━━
3. VOLUME REALITY CHECK: WHY WE ARE DISCIPLINED ON TP
━━━━━━━━━━━━━━━━━━━━━━━━━━━━━━━━━━━━━━━━━━━━
The Volume Radar on the 4H currently reads:
• Relative Volume: 0.35x average (QUIET)
• CVD Trend: Distributing
Because volume is currently quiet and overall 4H order flow remains cautious, we do NOT expect an immediate parabolic run to 1.1600+. Instead, we treat this as a high-probability mean-reversion bounce into overhead institutional supply walls:
• First Hurdle (1.15000): RES 67 sits right here, representing a breakdown level from Sept 16 (broken on a 2.3x volume spike). This is our first partial exit and where risk is reduced to zero.
• Major Ceiling (1.15550): The institutional wall at ★ RES 83 contains 124+ historical touches. We exit ahead of this level rather than hoping for a clean slice through.
━━━━━━━━━━━━━━━━━━━━━━━━━━━━━━━━━━━━━━━━━━━━
EXECUTION & RISK MANAGEMENT
━━━━━━━━━━━━━━━━━━━━━━━━━━━━━━━━━━━━━━━━━━━━
• Execution: Enter within 1.1478 – 1.1485.
• Invalidation: Clean 4H close below 1.14470 (violates both SUP 76 and the 1.14550 double-bottom trough).
• Management: Upon reaching 1.15000, secure 35%–40% profit and adjust stop loss to breakeven. Leave the remainder to run toward 1.1530 and 1.1555.
Trade your plan, manage your exposure, and respect market invalidation.
Fibonacci Profit Objectives: COP, OP and XOP📊 Projecting Maximum Price Movements with Fibonacci Ratios
Markets rarely move in a perfectly straight line. Price rises, corrects, forms a new cycle, and then begins another movement. When several cycles operate at the same time, identifying a potential maximum price movement can become challenging.
One way to bring structure to this analysis is to measure a completed price movement and project it from the next important turning point using Fibonacci ratios .
The chart above illustrates the concept of Contracted Objective (COP) , Objective Point (OP) , and Expanded Objective (XOP) , and shows how these objectives relate to the interaction of long-term and intermediate market cycles.
🧊 Understanding the A-B-C-D Structure
The easiest way to understand the method is to look at the chart above. The chart shows four important points: A, B, C and D .
A is the starting valley.
B is the following peak.
C is the next important valley.
D is the potential next peak or objective point.
The movement from A to B provides information about the expected size of the next movement from C to D.
In other words, instead of randomly selecting a target for D, we use the previous cycle's amplitude as a measuring reference.
💎 The Role of Market Cycles
The chart also illustrates three different components:
Long-term cycle
Intermediate cycle
Combined cycles
Markets can contain several cycles operating at different time scales. When these cycles interact, the resulting price movement can produce the actual peaks and valleys visible on the chart.
This is why the next movement does not necessarily have to be exactly identical to the previous one. It may be contracted, approximately equal, or expanded.
This is where Fibonacci ratios become useful.
📑 Three Fibonacci Profit Objectives
The method uses three values: 0.618 → 1.000 → 1.618
These produce three different potential objectives.
1️⃣ COP — Contracted Objective Point
COP represents a contracted version of the expected movement. For an upward projection: COP = C + 0.618 × CD
The 0.618 ratio means that only about 61.8% of the reference movement is projected from C. COP can therefore be considered the first or smaller objective.
2️⃣ OP — Objective Point
OP represents the normal objective: OP = C + 1.000 × CD
Here, the projected movement is 100% of the reference amplitude . If the previous comparable movement was $50, the OP projects a $50 movement from C. This is the central objective between the contracted and expanded projections.
3️⃣ XOP — Expanded Objective Point
XOP represents an expanded movement: XOP = C + 1.618 × CD
The 1.618 Fibonacci ratio projects 161.8% of the reference movement. This objective becomes relevant when the market produces a stronger-than-normal movement and extends beyond the regular OP.
🔍 A Simple Example
Suppose a stock ( NASDAQ:AAPL ) moves from: A = $100 → B = $150
The reference movement is: $150 − $100 = $50
Now suppose the market forms the next important valley at: C = $120
We can calculate the three objectives.
COP = $120 + ($50 × 0.618) = $150.90
OP = $120 + ($50 × 1.000) = ₹170.00
XOP = $120 + ($50 × 1.618) = ₹200.90
The three levels provide a structured range of potential objectives instead of relying on a single target.
👉 Note: The same principle can be applied to a declining market. The difference is that the projected movement is subtracted from the starting point. Thus, the method can be used for both upward and downward price projections.
👨🏻💻 Why Use Three Objectives?
A market does not always repeat a previous cycle with exactly the same amplitude.
It may produce a shorter movement: 61.8% → COP
It may approximately repeat the previous movement: 100% → OP
Or it may extend substantially: 161.8% → XOP
This gives traders a useful framework for observing how price behaves as it approaches each level.
For example, a market might reach COP and reverse, or continue through COP and OP before eventually reaching an expanded objective.
🌊 Fibonacci and Elliott Wave Analysis
This approach can also complement Elliott Wave analysis because both methods use proportional relationships between price movements .
The important sequence is: Identify the market structure → measure the relevant movement → apply Fibonacci ratios → monitor the resulting objectives.
Rather than treating Fibonacci levels as isolated numbers, they become part of a broader market-structure analysis.
💭 Final Take
The concept behind Fibonacci Profit Objectives is straightforward:
Use a previous cycle movement as the measuring unit and apply Fibonacci ratios to project potential future objectives.
The three principal levels provide three possible outcomes:
COP — contracted movement
OP — normal/full movement
XOP — expanded movement
As shown in the chart above, the interaction of long-term, intermediate, and combined cycles can create complex market movements. Fibonacci objectives provide a systematic way to translate those movements into measurable potential price targets.
The method is most useful when combined with broader technical analysis rather than used as a standalone signal.
Measure the cycle. Calculate the objectives. Then observe how price reacts.
This article is for educational and informational purposes only and should not be considered investment advice or a recommendation to buy or sell any security.  Education
USD/CHF – Liquidity Sweep Trade SetupUSD/CHF is displaying a bullish market structure, supported by an ABCD harmonic pattern. Following the completion of the CD leg near 0.8265, price has entered a corrective phase, potentially offering a buying opportunity at the Fibonacci retracement levels.
ABCD Pattern & Fibonacci Analysis
The ABCD formation highlights a bullish price structure, with the AB and CD legs showing upward momentum and the BC leg representing a corrective retracement.
Following the completion of point D, price is retracing toward the Fibonacci support levels:
0.382 Fibonacci: Initial retracement support near 0.8180.
0.50 Fibonacci: Deeper retracement support near 0.8155.
0.618 Fibonacci: A potential secondary support level near 0.8130.
Liquidity Zone (Yellow) & Demand Zone (Gree n)
The yellow support box represents a key liquidity zone, where stop-loss orders from existing buyers may be concentrated below the support level.
Since the demand zone lies directly beneath this liquidity area, the preferred scenario is for price to breach the yellow support zone, sweep the liquidity resting below it, and extend into the green demand zone.
This potential liquidity sweep could trigger resting sell orders before buyers step in at the demand zone.
However, a breach of the support zone alone does not confirm a bullish reversal. We need to observe a strong bullish reaction from the demand zone, ideally followed by a reclaim of the breached support level and a bullish market structure shift on a lower timeframe.
RSI Confirmation
The RSI remains above the 50 level, indicating that bullish momentum is still present despite the ongoing price correction.
As long as RSI holds above 50 and price respects the identified support and demand zones, the bullish continuation scenario remains valid. A bullish RSI reversal from this region would provide additional confirmation.
Trade Plan
The preferred setup is to wait for price to breach the liquidity zone and reach the demand zone before considering a long position.
The initial upside objective would be a recovery toward the previous resistance at point D, near 0.8265, followed by a potential extension toward 0.8300–0.8320.
A sustained breakdown below the green demand zone would weaken the bullish setup and increase the possibility of a deeper correction toward the 0.618 Fibonacci retracement level.
Key takeaway: We are not looking to buy immediately at the yellow support zone. The preferred scenario is a liquidity sweep below support, a test of the demand zone, and confirmation that buyers have regained control before entering a long position.
#USDCHF #Forex #ABCDPattern #Fibonacci #DemandZone #SupportAndResistance #RSI #BullishSetup #TechnicalAnalysis #TradingView #Sarmaaya.pk Short 
 Long
Long
 Short
Short
Long