Search in ideas for "candles"
Candlestick Patterns for Naked TradingThese are the majority of the major candlestick patterns that are prevalent when trading.
Single Patterns:
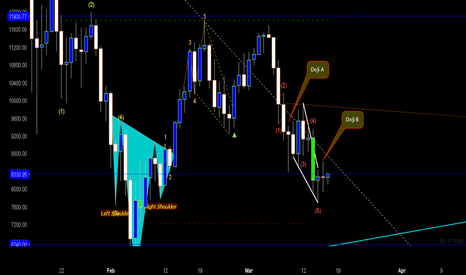
Doji
Marubozu
Shooting star
Hammer
Inverted hammer
Double Patterns:
Tweezer top/bottom
Double top/bottom
bullish/bearish engulfing
Triple Patterns:
Head and shoulders / Inverted Head and Shoulders
morning/evening star
Candlestick Math Candlestick Math - V1.0
Sometimes , you need to do some candlestick math to drown out the noise between the candles . This helps in better decision making overall by understanding the effect of the last few candles.
Candlestick Math creates a new blended candle which can be interpreted as a summary of the defined period . The indicator uses Lookback period as an option to define the period.
For those who are not familiar with the Candlestick math , please google it and you will see many references. Please do note that this is a very short code and future versions will contain Multi frame capabilities as well as candle recognition.
If you do like the indicator , I would appreciate a like !
Cheers ,
Bitfanatic
FBR Long Set Up - Candles, Technicals, and Elliot all say GO!Candlestick Rising Held as support as we have had completion of Inverted Hammer and Engulfing bull patterns at this same level. Connors RSI below 10. For Elliot folks, please check the count that it doesn't violate any rules, and the retracement/correction has moved back down into middle of wave 4 Price has retraced down into wave 4 of previous impulse wave. So I believe it has completed wave A of the correction wave and have gone long with the target of 9.64, the 61.8 fib level. Medium term look to target 10.5 and long term Longer term 12.50 as it completes wave 3 of III.
FLong
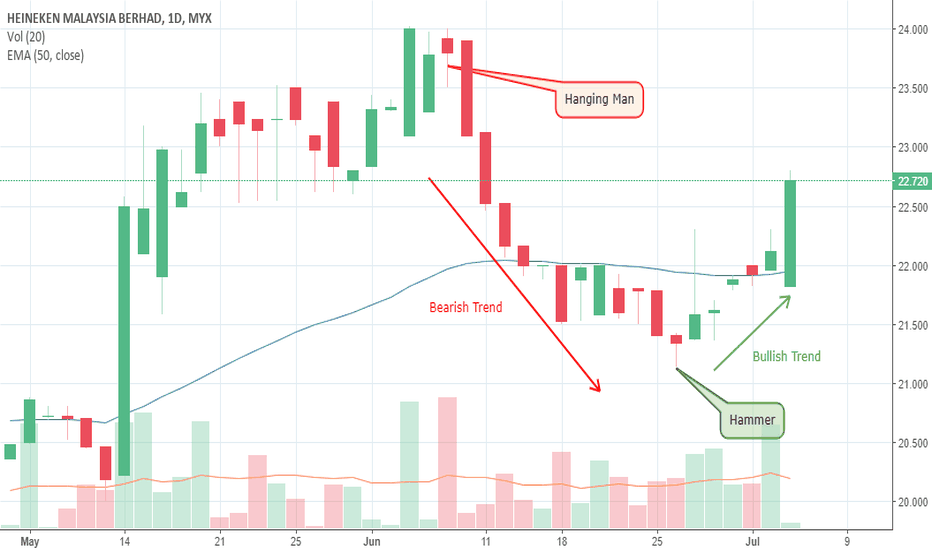
Candlestick analysis in Heineken chart
Stock: 3255 Heineken
Chart: Daily
Period: June - July 2018
Hanging Man appears on June 7, indicating an end to the bullish trend. This is further confirmed with the next day red candlestick close which is lower than the Hanging Man close. Trend then changed to bearish until June 26, which a hammer appeared. This indicates an end to the bearish trend. The bullish confirmation is given when the next day's green candlestick closed higher than the bullish hammer.
If you've long right after the hammer you would have profited handsomely.
GBPJPY analysisAfter two days of bullish candles, GBPJPY is still within the ranges of 189 to 193. However, it could present some good intraday trading opportunities during the London and NY session today. As I write this, the price has already broken below the 192 level and is hanging around the 191.2 level. If we see then level break, then we could see it make its way towards 190.2. If it finds suport at this level and goes up to the 192 level again, then it coulf present with a nice shorting opportunity to test the 191.2 levels again. The momentum seems to be towards the downside today and I would not buy this market unless I see some really healthy bullish candles towards the upside. At the moment, it is about waiting for the retracement to sell again.
There is big data release during the NY session today, so the overall direction could be dictated by what the data is like at that time.
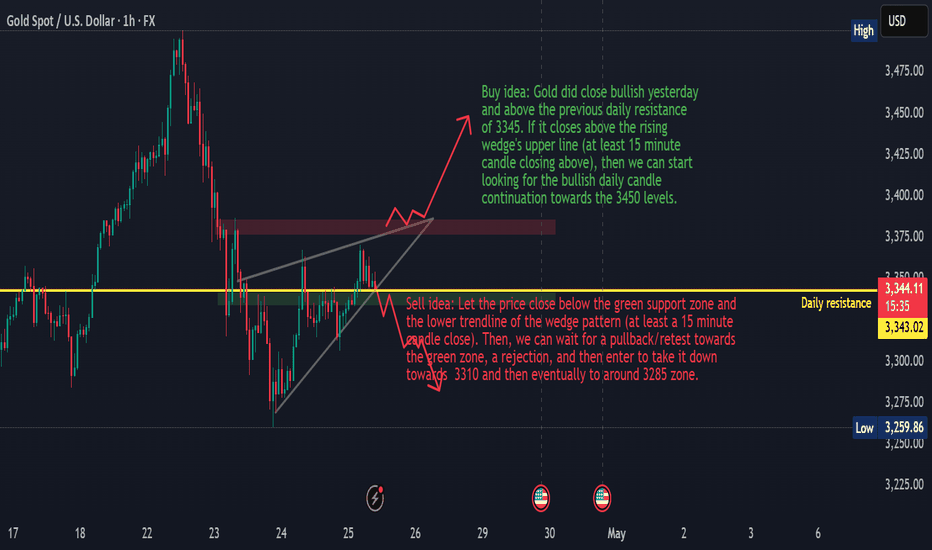
Gold ConsolidationGold is consolidating between a rising wedge pattern at the moment. It is still in an undecided territory at the moment because the momentum in the past few days has been clearly down, but yesterday's daily candle managed to close above the previous daily resistance level of 3,345. If we see healthy candles closing below that level (which will also break the lower boundary of the wedge pattern), then we can start looking for sells. I will look for buys only if the price closes above the resistance level (marked as a red zone in the chart) at around 3,380.
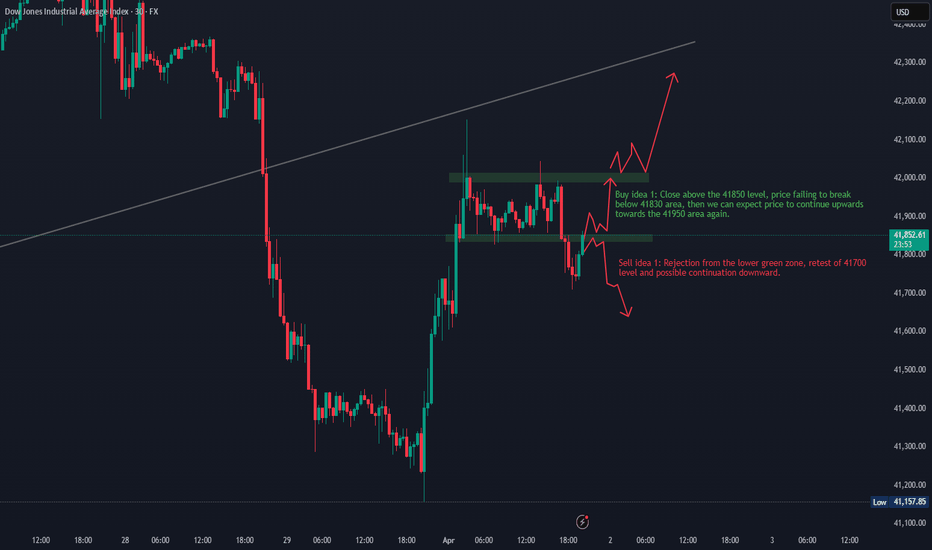
US30 Scalping Ideas for NYSE open todaySince the NYSE brings a lot of volume, we can look for both buy and sell ideas depending on how the candles behave. I will wait for the first 5-minute candle after the NYSE open to plan my trade.
Higher timeframes (weekly, 4H, and the hourly) all look bearish except for the bullish close yesterday, so my bias is still bearish. Unless we see some tariff related good news or any other fundamental news release, the continuation most likely can be towards the downside.
Happy trading!
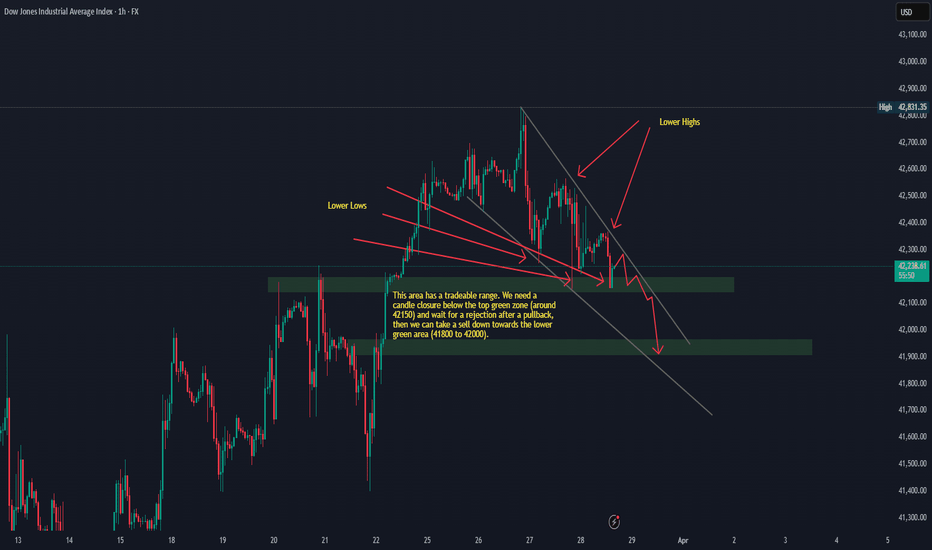
US30 Sells Idea for the New York SessionUnless we see some news come out on tariffs, we could see some downside on US30 today. It is falling inside a wedge pattern right now, and I expect the price action to fall within that wedge with a potential to go down during the New York session. I will be waiting for a break of the upper green zone (around 42150), then a pullback and rejection, to take sells down towards the 42000 (and possibly lower) areas.
I am not looking for any buys on US30 today, unless I see some really big green candles towards the upside during the 9:30 am EST.
EURUSD: Watch Out for Reversal CandlesThe EUR/USD pair has experienced a rapid decline, touching the lower trendline of the descending channel. Currently, the price is preparing to retest the upper trendline of the channel, as well as the 50 and 100 moving averages on the 4-hour timeframe, and the 61.8 Fibonacci retracement level. We will be waiting for any signs of reversal candles at those levels for a potential downside move again.
-------------------------------------------------------------------------
Let me know your thoughts in the comments, and show your support by liking the idea.
Please follow if you're interested in more ideas like this.
Your support is greatly appreciated!
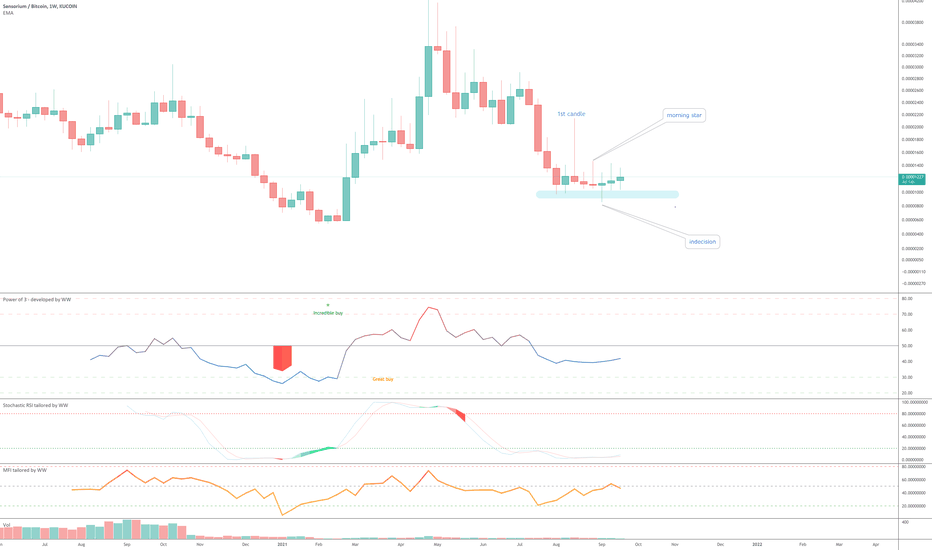
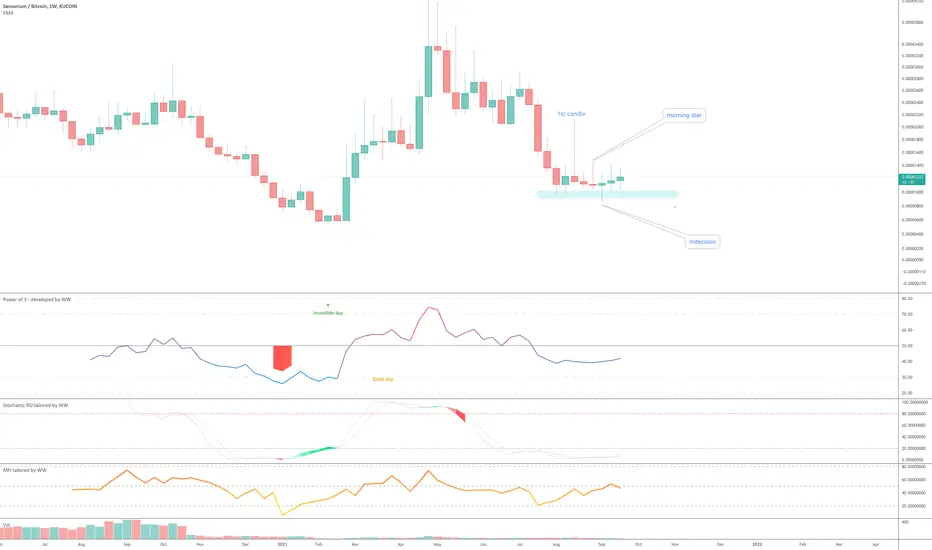
Sensorium (SENSO) / BTC - A rewarding candlestick patternThe pattern of candles highlighted is a favourite of mine. You don’t often see such a clear example in the charts, but when you do..
If you’re new to trading / active investing, this is one to put in your notebook. No matter the chart study, stocks, crypto, price of fish cakes in Hong Kong, it works every time on all time scales, the weekly is partially powerful.
On the above weekly chart a battle of psychology between bears and bulls is playing out. Why is this pattern significant?
Candle by candle starting from ‘1st candle’
1) The bears stepped in, they pushed price down closing the week lower than it began with significant pressure, hence red candle.
2) The bears stepped in again and closed price action lower than the week began. But two things have changed from the previous week:
2a) The wick is lower, indicating sellers are weakening.
2b) The body of the candle is thinner. This tells that despite all the selling pressure of the bears, the bulls matched it.
3) At this point you start to see something significant. A very thin body with a long wick above. This candle is called a ‘morning star’ and is confirmed with a ‘green candle’ in the following trading session, which we have. The psychology here is the bulls entered deep into the bears territory with not as much resistance as the previous session.
4) The first green candle. A ‘indecision candle’. The bears are confirmed ‘exhausted’, bulls closed price action higher than the previous trading session.
5) This is where is becomes mega interesting. The buying pressure soaking up the bears sell orders has not gone away. So what happens next when the bulls step in again without the selling pressure? Kaboom.
Print it out and hang it up somewhere!
WW
Is there any examples? Sure:
Here is a weekly dollar chart on something called Dragonchain:
And again the AAVA dollar chart before going on a 200000% bull run.
S