Education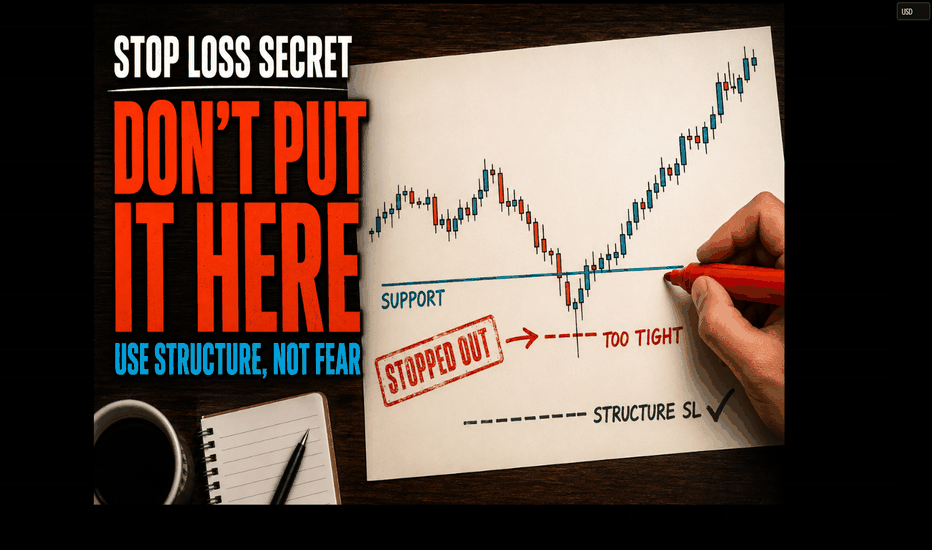
EDUCATION: 5 Reasons You Get Stopped Out & How to Fix ItGetting stopped out isn't always bad trading—but if it's happening consistently, there's usually a reason. In this educational session, we'll break down the five most common mistakes traders make that lead to unnecessary stop-outs and, more importantly, how to fix them.
We'll cover how stop-loss placement should be based on market structure, liquidity, volatility, and risk management—not emotion or arbitrary pip counts. You'll also learn why many retail traders place their stops in the same predictable locations and how understanding price behavior can help you stay in quality trades longer.
In this video you'll learn:
Why your stop loss keeps getting hit
Common stop-loss placement mistakes
How liquidity and market structure affect your trades
Better risk management techniques
Practical ways to improve your trade execution
Whether you trade Forex, Crypto, Indices, or Stocks, these concepts can help you reduce avoidable losses and build greater confidence in your trading decisions.
Tags: trading education, stop loss strategy, risk management, trading psychology, market structure, liquidity, forex trading, crypto trading, technical analysis, trading tips, price action, beginner trading, trading discipline  Education
Professor’s Risk Clinic: Why the Stop Was HitProfessor’s Risk Clinic: Why the Stop Was Hit
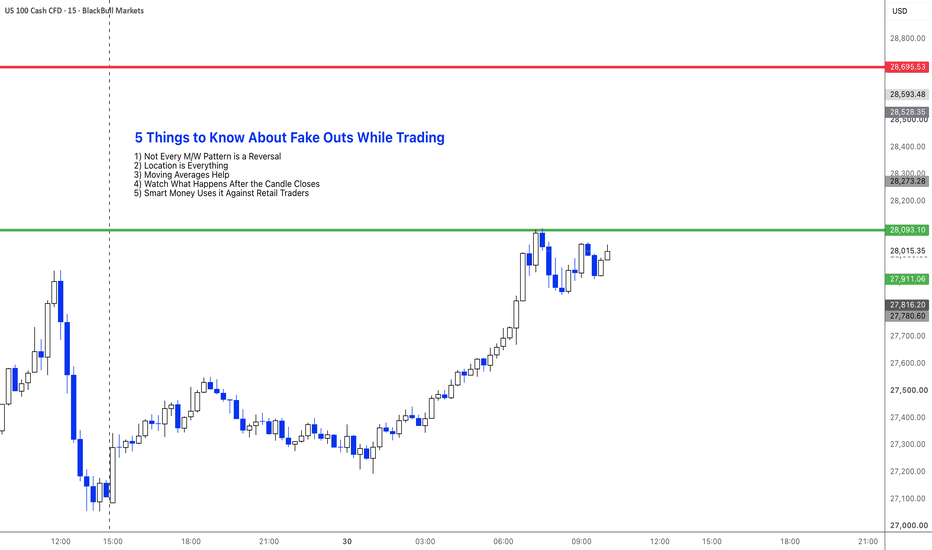
Today’s patient is Natural Gas on the 1-hour chart.
The original idea was slightly bullish: Natural Gas was recovering from the 3.11–3.16 support area and trying to break above the 3.220–3.230 resistance zone.
The plan was:
Direction: Long after breakout / pullback
Entry: 3.220–3.230
Stop Loss: 3.145
Take Profit 1: 3.260
Take Profit 2: 3.330
The trade was later closed because the stop was reached.
So what went wrong?
🔍 The Diagnosis
The bullish idea was not completely wrong. Price did push above the 3.220–3.230 area, and momentum was improving: MACD turned positive, RSI was near 60, and Stoch RSI was rising.
But the issue was not the direction.
The issue was confirmation and stop placement.
⚠️ Mistake #1: Buying Before Full Breakout Acceptance
The entry was directly around resistance: 3.220–3.230.
For this setup, price needed more than just a quick push above the level. It needed acceptance:
a clean hourly close above 3.230;
price holding above the breakout zone;
a successful retest of 3.220–3.230 as support.
Instead, the breakout failed, and price flushed back down.
⚠️ Mistake #2: Stop Inside the Support Zone
The broader support area was 3.11–3.16.
The stop at 3.145 was inside that support zone, not clearly below it.
If support is a zone, price can dip into it, trigger stops, and then recover. That made the stop vulnerable to normal market noise.
⚠️ Mistake #3: Natural Gas Needed More Room
Natural Gas is volatile. Sharp wicks, false breakouts, and liquidity sweeps are common.
A stop that looks safe on a calmer market can be too tight here, especially if it sits inside a major support zone.
🎯 Professor’s Verdict
The stop was hit because price failed to confirm acceptance above 3.220–3.230 and returned into the broader support zone.
The direction was not necessarily bad.
But the entry was too close to resistance, and the stop was placed where price still had room to test support.
📚 Professor’s Rule
A stop should be placed where the trade idea is invalidated — not where normal volatility can reach it.
Before entering a breakout trade, ask:
“Has price really accepted above the breakout level?”
“Is my stop outside the support zone?”
“Am I giving this market enough room?”
A good idea can still become a losing trade if confirmation is weak and the stop sits in the wrong place.
This is educational analysis, not financial advice.  Education
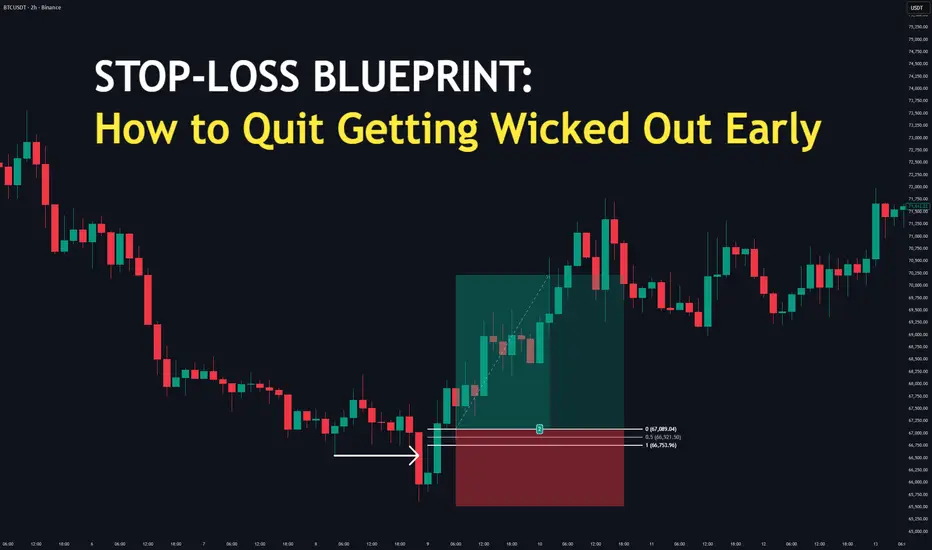
Stop-Loss Blueprint: How to Quit Getting Wicked Out Early🔵 Stop-Loss Blueprint: How to Quit Getting Wicked Out Early
Difficulty: 🐳🐳🐋🐋🐋 (Beginner-Friendly)
It is the most frustrating feeling in trading: you entry a trade, price moves directly to your stop-loss, "wicks" you out by a single pip, and then immediately runs toward your take-profit target. In this blueprint, you will learn how to hide your stops behind institutional walls so you can stay in the move.
🔵 THE RETAIL MISTAKE: THE "RANDOM NUMBER" STOP
Most beginners place their stop-losses based on a random number of pips (e.g., "I always use a 10-pip stop") or right at an obvious support line.
The problem? The interbank algorithms are designed to hunt these exact areas to collect liquidity before expanding. If your stop-loss is resting right where everyone else's is, it becomes a target.
The Institutional Rule: Your stop-loss should never be placed where you hope price won't go. It must be placed where the setup is completely invalidated .
🔵 HIDING BEHIND CONFLUENCE WALLS
Think of your stop-loss like a shield. You don't want to leave it out in the open; you want to hide it behind solid walls.
When analyzing market structure, you have three major structural walls to protect your trade:
Wall 1: The Manipulation Wick (The Floor): Look at the horizontal white arrow at the bottom left. This wick hunted the weak retail stops. Your ultimate structural invalidation point lives safely below the low of this wick.
Wall 2: The Order Block Anchor (The Blue Box): The blue shaded rectangle highlights the institutional order block candle at the absolute bottom. The opening price of this block acts as the heavy defensive floor.
Wall 3: The Equilibrium Level (0.5): Look at the Fibonacci grid on the right. The 0.5 level (66,462.45) marks the middle of the pullback range. Notice how price pulls back through equilibrium to mitigate the order block below it before violently exploding into profit.
Professional Takeaway: When multiple walls overlap, you have a high-confluence zone. You can place a tight, highly secure stop-loss just underneath and catch massive 4+ Risk-to-Reward moves easily.
🔵 HOW TO PLACE YOUR STOP LIKE A PRO
1. The "Protected Low" Strategy (Long Setups)
When buying after a Market Structure Shift (MSS) or CISD, do not place your stop right at the entry trigger candle. Place it 2–3 pips below the swing low that swept the liquidity.
If price returns to break that low, it means the manipulation wasn't a fakeout—it means the trend is actually broken. Your setup is dead, and you want to be out.
2. The "Breaker" Shield
If you are entering on a Breaker Block or a mitigation play, hide your stop-loss just behind the invalidation level of that specific block. If the algorithm respects the zone, price should not cross into the invalidation area.
🔵 THE RISK-TO-REWARD (R:R) SOLUTION
Traders often use tight, dangerous stops because they want a huge Risk-to-Reward ratio (like 1:10). But a 1:10 trade is useless if you get stopped out 90% of the time.
The Fix: Give your trade room to breathe. A wider, structurally safe stop-loss combined with a target at a major Liquidity Void will give you a higher win rate and a cleaner, stress-free execution.
🔵 EXAMPLE TRADING CHECKLIST
The "Safe Shield" Framework
Identify your entry trigger (FVG, CISD, or Order Block).
Locate the nearest institutional manipulation wick or structural anchor.
Place the stop-loss 2–5 pips past that structural anchor.
Ensure the distance to your Take Profit target provides at least a 1:2 or 1:3 R:R.
If the R:R is too low, skip the trade and wait for a deeper discount entry.
🔵 CONCLUSION
Stop letting the algorithm use your account as fuel. By placing your stop-loss behind valid structural invalidation levels instead of random pip counts, you transform your stop from an easy target into a highly protected fortress.
Do you use a fixed pip count for your stops, or do you hide them behind structural wicks? Let us know your approach below!  Education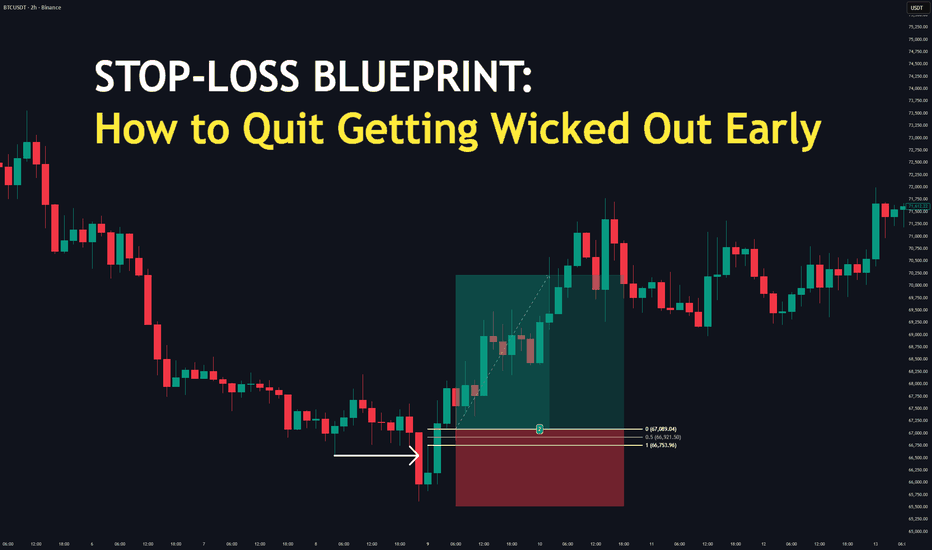
Liquidity and stop losses: Why is the market going against You?1. Why price moves at all
Most beginners think the market moves because of news or indicators.
In reality, price moves because of liquidity.
Liquidity = orders in the market.
Big players (institutions, whales) cannot just buy or sell huge amounts instantly.
They need someone on the other side of the trade.
And this is where stop losses come in - a stop loss becomes a market order when triggered.
So for large players, your stop = their opportunity.
2. Where stop losses usually are
Most traders place stops in obvious places: above recent highs, below recent lows, near support and resistance, around round numbers (like 30,000 on Bitcoin).
Because of this, the market forms liquidity zones:
above highs → stop losses of short traders
below lows → stop losses of long traders
These areas are like “targets” for the market.
3. Liquidity Sweep (fake breakout)
A liquidity sweep is a quick move beyond a level and back. What happens? Price reaches a level → Breaks it slightly → Triggers stop losses →
Quickly returns back. This is NOT a real breakout.
It’s the market manipulating collecting liquidity.
Bitcoin BINANCE:BTCUSD example:
Price struggles below 30,000 → Suddenly spikes to 30,300 → Then drops back below 30,000
Result:
Stops are taken → market is ready to move the other way.
4. Stop Hunt (hunting traders)
A stop hunt is a stronger version of a liquidity sweep. Big players intentionally push price: into areas where many stops are located, trigger them then reverse the market. Why? Because they need liquidity to enter large positions.
Simple idea: the price goes where the money (stops) is.
5. What happens after liquidity is taken?
This is the most important part. After stops are triggered: weak traders are out - big players are in the market becomes “clean”
Then comes a strong move (impulse).
Typical Bitcoin pattern: Traders panic and sell - Market suddenly goes up strongly OR the opposite.
6. Simple strategy for beginners:
Here is a practical way to use this:
Step 1. Find liquidity. Look for: equal highs or lows, obvious levels, places where “everyone would put stops”.
Step 2. Do NOT trade the breakout. Most beginners buy breakouts.
This is where they lose.
Instead, wait for: a fake breakout (liquidity sweep) - price to come back
Step 3. Enter after the return.
Example: price breaks above a level, then falls back below, you enter a short. Or the opposite for long trades.
Step 4. Place stop logically.
Put your stop: behind the sweep high/low. If the idea is correct, price should NOT return there.
Totally Key mindset:
Stop thinking: “I want to follow the market.”
Start thinking: “Where are other traders wrong?”
If you trade like the crowd - you become liquidity/ If you understand liquidity - you profit from it. The market doesn’t just move randomly.
It moves: to find liquidity, to trigger stops and then to make a real move. Bitcoin shows this behavior very clearly. Learn to see liquidity and trading becomes much easier.
On my TradingView channel you will find many training posts that will help you improve your trading results. I made a website with a risk management calculator for traders. You can use it for free. I left it in the header of my profile. Education 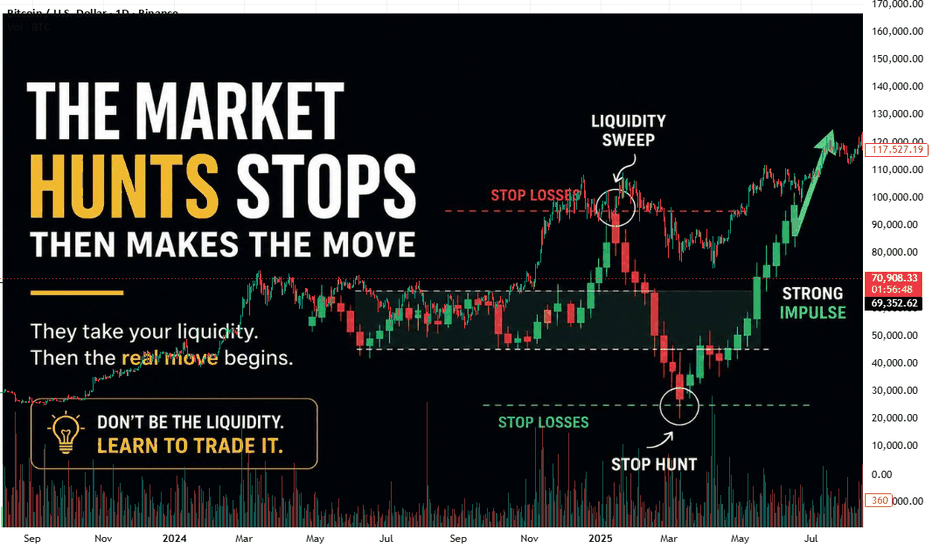
The Point Where Trades Quietly BreakMost trades do not fail at the stop loss. They fail earlier, at a point that is rarely acknowledged. That point is where the original idea stops being supported, even if price has not yet reached invalidation. This is one of the more subtle aspects of trading, and it is where many traders lose control without realizing it.
A trade is built on a narrative. That narrative includes structure, momentum, and participation. When those elements align, the trade has a reason to exist. The market behaves in a way that supports the thesis behind the position, and each movement continues to reinforce the logic of the trade. But when those elements begin to weaken, the trade becomes fragile. The problem is that many traders reduce everything to price alone. As long as price has not hit the stop, the trade is considered valid. In reality, the market provides information long before invalidation is reached. Momentum can slow, structure can weaken, and participation can shift in ways that suggest the original conditions are no longer present.
This does not always mean the trade must be closed immediately, but it does mean the confidence behind the trade should begin to change. A strong trade typically behaves with clarity. If a long position is taken after a structural shift, higher lows should continue forming and price should progress toward the intended objective with reasonable efficiency. Pullbacks should remain controlled, and buyers should continue defending key areas. But if price begins to overlap repeatedly, struggles to extend higher, or consistently rejects important levels, then something within the market dynamic is changing. The trade is no longer behaving as expected, and that change matters even if the stop loss remains untouched.
Ignoring this shift creates one of the most common patterns among struggling traders. Positions are held not because the original thesis is still supported, but because traders become emotionally attached to the possibility that price may eventually move in their favor. Instead of reassessing the conditions objectively, they focus only on whether the stop has been reached. By the time invalidation finally occurs, the loss feels sudden and frustrating, as though the market changed direction without warning. In reality, the deterioration began much earlier. The market had already started communicating weakness through slower momentum, unstable structure, and reduced follow-through, but those signals were ignored because they did not yet produce a complete reversal.
Recognizing this process improves trade management significantly because it changes the trader from a passive participant into an active observer of behavior. Exposure can be reduced, conviction can be adjusted, and partial profits can be protected before the trade fully collapses. This does not mean reacting emotionally to every small fluctuation or exiting positions at the first sign of hesitation. Markets naturally retrace, consolidate, and rotate during healthy trends. The objective is not to avoid uncertainty completely. The objective is to recognize the difference between normal fluctuation and meaningful deterioration in the quality of the trade.
Strong trades usually maintain efficiency. They continue building structure, they respect important areas, and they show consistent participation in the intended direction. Weak trades begin requiring more hope than evidence. The market still appears close to working, but each movement feels less convincing. Continuation becomes difficult, reactions become inconsistent, and progress slows despite repeated attempts to move higher or lower. This is often where emotional attachment becomes dangerous because traders stop evaluating the market objectively and begin defending their position psychologically. Every small move in favor of the trade becomes proof that the thesis is still alive, while warning signs are minimized or ignored.
The market communicates continuously through behavior. Structure, momentum, and participation are constantly revealing information about whether the original idea is strengthening or weakening. Traders who focus only on the final outcome miss the gradual changes that occur before that outcome arrives. They experience losses as isolated events instead of understanding them as processes that developed over time. But markets rarely fail instantly. More often, they deteriorate step by step. Momentum weakens, structure becomes unstable, participation fades, and eventually the move collapses completely.
Learning to recognize this transition changes the way trades are managed. Instead of waiting passively to be proven right or wrong, the trader begins interpreting the quality of the market in real time. Execution becomes less about prediction and more about observation. The focus shifts away from simply asking whether price has hit the stop and toward understanding whether the original conditions behind the trade still exist. That perspective creates adaptability without emotional decision-making, because adjustments are based on changing market behavior rather than fear or hope.
The best traders understand that invalidation is not the only information that matters. Long before the stop is reached, the market is already revealing whether the trade remains healthy or whether the original narrative is beginning to fail. Trades rarely collapse without warning. In most cases, they weaken first, and the ability to recognize that weakness early is what separates disciplined execution from passive hope. Stop loss: why do most people lose money and how to use it?Stop loss is a tool thanks to which you can regulate risk and stay in the market for a long time.
Those who do not use stop loss in trading usually live no more than a year in the market.
What is a stop loss in simple words?
A stop loss is a predetermined point where you admit “my idea was wrong” and at which the trade will be closed at a loss. But this is not an “I lost” button!
This is capital protection, risk control, and a tool for survival in the market.
Professionals don't even try to avoid losses completely.
They make sure that losses are small, and profitable trades cover a series of minuses.
The main mistake of beginners
Newbies think: “If I set a stop, I’ll be knocked out and I’ll lose money.”
In most cases this is true, but it is also true - without a stop, one trade can destroy months of work! The picture shows an example of the result if you invest on emotions without a strategy BINANCE:TRUMPUSDT :
Especially in crypto.
COINBASE:ETHUSD or other altcoin is able to do: −5% in a few hours, −10–15% in a day, and in moments of panic even more -20–40%. If you use your shoulder the situation becomes even more dangerous.
Example of an ETH trade: ETH is trading at $2,500.
You see: strong support, good customer response, confirmation on the junior TF. You go long.
Option №1 - NO STOP:
Price drops: $2450, $2200, $1900…
What beginners do: average a losing position, watch only bloggers who predict growth, hope, wait for a reversal.
As a result: drawdown −20–30%, emotions interfere with decision-making, the deposit is blocked in a losing position. This is no longer trading, but investing “under duress.”
Option №2 - with a stop
You understand in advance:
If ETH breaks the structure, then the idea is broken and there is no point in being in a falling asset. For example: entry: $2500, stop: $2440, risk: $60.
If the stop is triggered:
you lost a small percentage of your deposit, saved your capital, saved your psychology, and you can look for the next deal. It is okay to make a mistake as long as it is then analyzed in the trader's diary. This is exactly how long-distance traders work.
How to set a stop correctly?
❌Error: set a stop “by eye” or a fixed percentage.
✅ Correct approach: Stop is placed where your idea breaks down.
For example: below support, below swing low, below the liquidity zone, beyond the invalidation level.
Why a small stop is not always good
A small stop is good if its in stocks or indices where volatility is minimal.
But beginners like to place very short stops in crypto.
For example: ETH entry: $2500 and stop: $2490.
💢 Problem:
ETH can easily make a normal market noise of 1-2% and knock you out, you will be left out of position and then the chart will move in your direction. Therefore, strong traders take into account: volatility, ATR, liquidity, chart structure.
Difference between stop loss in trading and investing:
This is critically important to understand. In trading, a Stop is always required.
Because the trader: works over short distances, uses precise scenarios, often uses leverage, depends on risk control. The main task of a trader: quickly admit a mistake, analyze and prepare for the next trade.
In investments stop is used differently. An investor buys ETH for 3-5 years, without leverage, with the understanding of strong drawdowns. It can withstand: -30 and -50%, and sometimes even -70%. Because his goal is: long-term asset growth, rather than short-term fluctuations.
It is not a fact that ETH will grow in the future, so no more than 2% of the capital can be allocated to this idea, i wrote about this in the last post.
But there's a big trap here...
Many newbies say: "I'm an investor." But really they entered on emotions, without a plan, on highs, on the advice of a blogger, without their analysis, and then they simply don’t want to record a loss because it hurts. This is not an investment. This is the lack of risk management and strategy.
How to find good trades?
Before entering a trade, ask yourself 4 questions:
1. Where does my idea break down? If there is no answer, you cannot enter.
2. What is the risk as a percentage? Most professionals risk 0.5–2% of their deposit per trade (read previous post on Tradingview)
3. What is the risk/reward?
Minimum: 1:2 is better or 1:3 is very important!
For example: The stock costs $100, the target is $160 (potential profit $60). This means we should put a stop at $80-85 or higher. Even if 60% of trades will be at a loss - you can be profitable with the right risk/reward.
4. Is there confirmation of the structure? Don't enter just because it "looks like it's going to go up" or the news is positive.
What's the result?
Stop loss is not the trader's enemy. This is what allows you to: survive bad trades, preserve capital, stay in the game long enough to catch a really strong move. In the market, it is not the one who gets it right more often who survives.
And the one who: controls risk, cuts losses quickly, and allows profits to grow.
This is why experienced traders first think: "How much can I lose?"
and only then: “How much can I earn?”
On my channel you will find even more free educational posts, Lets earn together!
 Education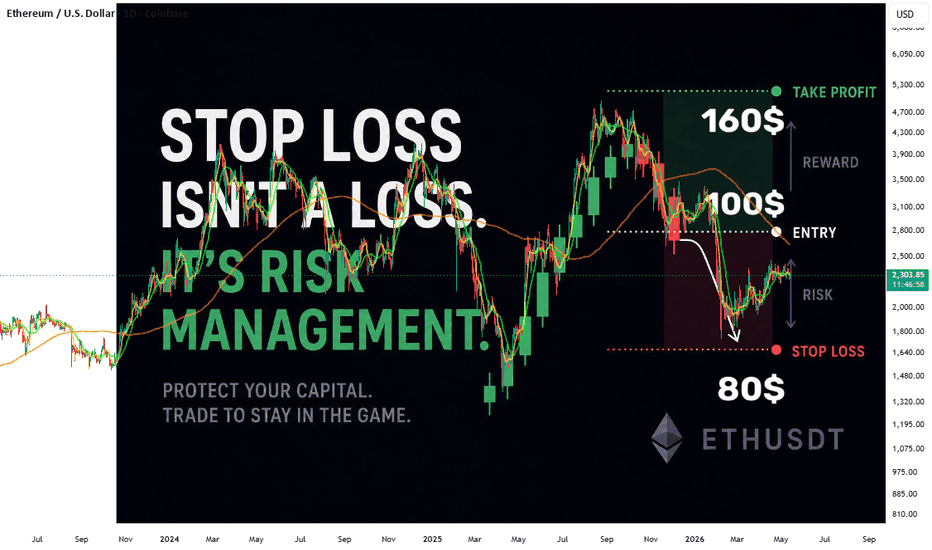
The Hidden Trap Behind “Perfect” Stop PlacementThere are moments in the market when everything seems to line up perfectly.
A clean chart pattern forms.
The structure is textbook.
The entry is obvious.
And yet… the outcome doesn’t follow.
Not because the idea was wrong — but because of where risk was placed.
This article explores one of the most overlooked dynamics in trading: how “perfect-looking” stop placement often becomes the very reason traders are removed from otherwise valid setups.
Using a recent futures market structure as a case study, we’ll break down:
Why classical stop placement can be vulnerable
How liquidity and order flow reshape risk decisions
Where hidden traps form within otherwise clean technical patterns
And how a more adaptive approach may improve trade structuring
The Setup: A Textbook Breakdown Formation
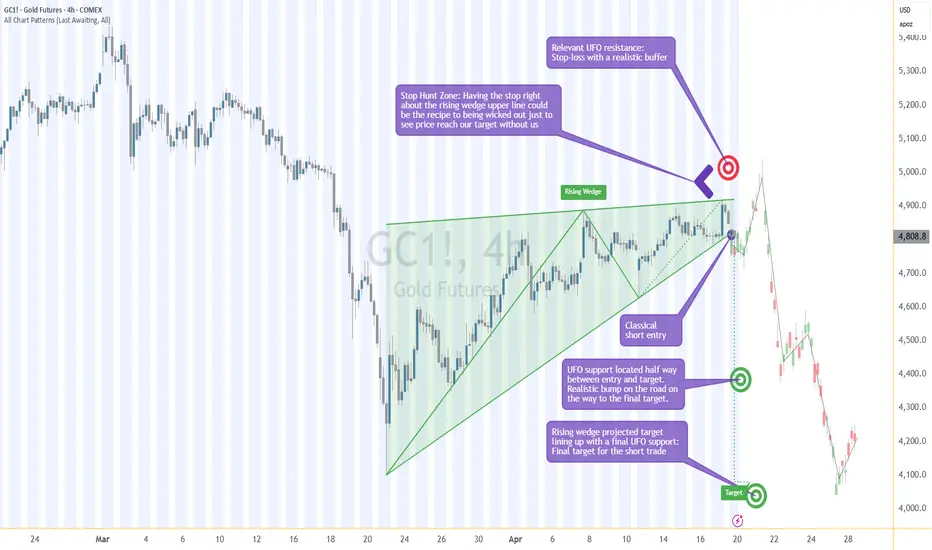
The chart structure under analysis presents a rising wedge pattern on the 4-hour timeframe, gradually compressing price into a tightening range.
This type of structure typically reflects:
Slowing bullish momentum
Increasing imbalance risk
Potential transition from accumulation to distribution
Eventually, the pattern is pierced to the downside, signaling a possible shift in directional control.
Approximate breakdown zone: ~4,815
Projected measured move target: ~4,074
From a purely technical perspective, this is a classic scenario:
Compression → Breakdown → Expansion
But this is where most analyses stop.
And where most problems begin.
The Real Battlefield: Not Entry… But Risk Placement
Many traders focus heavily on:
Finding the right pattern
Timing the entry
Projecting the target
But consistently overlook the most critical question:
Where is everyone else placing their stop?
Because in liquid futures markets, price does not move randomly —
it moves through liquidity.
And that liquidity often sits exactly where:
Stops cluster
Positions become vulnerable
Forced exits can fuel price spikes
The “Perfect” Stop That Isn’t
In a typical wedge breakdown scenario, the textbook stop placement would be:
Just above the upper boundary of the wedge
Approximate level: ~4,922
This placement looks logical:
It invalidates the pattern
It respects structure
It keeps risk tight
But here’s the issue:
👉 It is also the most crowded and predictable location for stop orders.
And that creates a vulnerability.
The Stop Hunt Zone: Where Structure Meets Liquidity
Looking beyond pure structure and into order flow dynamics, a key layer emerges:
A sell-side liquidity zone (resistance) is located above the wedge
This zone extends up to approximately: ~5,050
This creates what can be described as a Stop Hunt Zone:
Lower boundary: wedge resistance (~4,922)
Upper boundary: liquidity zone (~5,050)
Inside this region:
Stops from short positions accumulate
Late breakout buyers may enter
Liquidity becomes dense
This is not random noise.
This is fuel.
What Typically Happens in This Zone
Price may:
Push above the wedge
Trigger clustered stops
Induce breakout participation
Then reverse direction
The result?
Traders with tight stops are removed
Positions are closed at a loss
The original directional idea continues… without them
This is the core paradox:
👉 Being directionally correct but structurally vulnerable.
A More Adaptive Approach to Stop Placement
Instead of anchoring stops to structure alone, a more nuanced approach considers:
Where liquidity is concentrated
Where stops are likely clustered
Where price may temporarily extend before continuation
In this case, a more conservative stop placement could be:
Above the identified liquidity zone (~5,050)
Allowing space for potential stop runs
This does not eliminate risk —
but it acknowledges how price interacts with liquidity before moving.
The Path to Target: Not a Straight Line
While the projected downside target sits near ~4,074, the journey toward that level is unlikely to be linear.
A key intermediate consideration:
Support zone around ~4,416.8
This level sits approximately halfway between:
Entry (~4,815)
Final target (~4,074)
And it introduces an important decision point.
The “Bump in the Road” Problem
Ignoring intermediate levels like this can lead to:
Unrealized gains turning into losses
Premature reversals
Emotional decision-making
This zone may act as:
Temporary support
A reaction point
A place where opposing order flow emerges
Possible approaches around this level include:
Partial position reduction
Risk adjustment
Reassessment of structure
There is no single “correct” action —
but there is clear value in acknowledging the level exists.
Trade Structuring (Illustrative Case Study)
This section presents a hypothetical framework for understanding the setup.
Entry: ~4,815 (on confirmed breakdown)
Stop: Above liquidity zone (~5.050)
Target 1: ~4,416.8 (intermediate support)
Target 2: ~4,074 (projected structure target)
Approximate reward-to-risk:
Full target: ~ 3:1 (depending on execution)
Partial scaling may adjust realized outcome
This example is illustrative only, designed to highlight:
The relationship between structure and liquidity
The impact of stop placement on trade survival
Futures Contract Considerations
Understanding contract structure is essential when applying such setups in futures markets.
Standard Contract: Gold Futures (GC)
Tick size: 0.10 per troy ounce = $10.00
Margin Requirement: ~$34,000 per contract
Micro Contract: Micro Gold Contracts (MGC)
Tick size: 0.10 per troy ounce = $1.00
Margin Requirement: ~$3,400 per contract
One-Ounce Contract: 1-Ounce Gold Futures (1OZ)
Tick size: 0.25 per troy ounce = $0.25
Margin Requirement: ~$340 per contract
These variations allow traders to:
Adjust position sizing
Manage exposure more precisely
Align risk with account size
Margin requirements will vary depending on:
Broker
Volatility conditions
Regulatory framework
Risk Management: The Real Edge
Patterns don’t create consistency.
Entries don’t create consistency.
Risk management does.
Key principles illustrated in this case:
Stop placement should consider liquidity, not just structure
Intermediate levels matter — even in strong directional setups
Tight stops are not always efficient stops
Surviving volatility is part of capturing the move
The goal is not to avoid losses entirely —
but to avoid unnecessary losses caused by predictable positioning.
Final Perspective
This setup is not unique.
It represents a broader principle seen across markets and timeframes:
👉 Markets often move through areas of maximum discomfort before continuing in their intended direction.
And that discomfort is frequently concentrated around:
Obvious stops
Clean technical levels
Widely recognized structures
Understanding this dynamic does not guarantee outcomes.
But it may help shift the focus from:
“Was the trade right?”
to
“Was the trade structured in a way that allowed it to work?”
Data Consideration
When charting futures, the data provided could be delayed. Traders working with the ticker symbols discussed in this idea may prefer to use CME Group real-time data plan on TradingView: www.tradingview.com - This consideration is particularly important for shorter-term traders, whereas it may be less critical for those focused on longer-term trading strategies.
General Disclaimer
The trade ideas presented herein are solely for illustrative purposes forming a part of a case study intended to demonstrate key principles in risk management within the context of the specific market scenarios discussed. These ideas are not to be interpreted as investment recommendations or financial advice. They do not endorse or promote any specific trading strategies, financial products, or services. The information provided is based on data believed to be reliable; however, its accuracy or completeness cannot be guaranteed. Trading in financial markets involves risks, including the potential loss of principal. Each individual should conduct their own research and consult with professional financial advisors before making any investment decisions. The author or publisher of this content bears no responsibility for any actions taken based on the information provided or for any resultant financial or other losses. Education 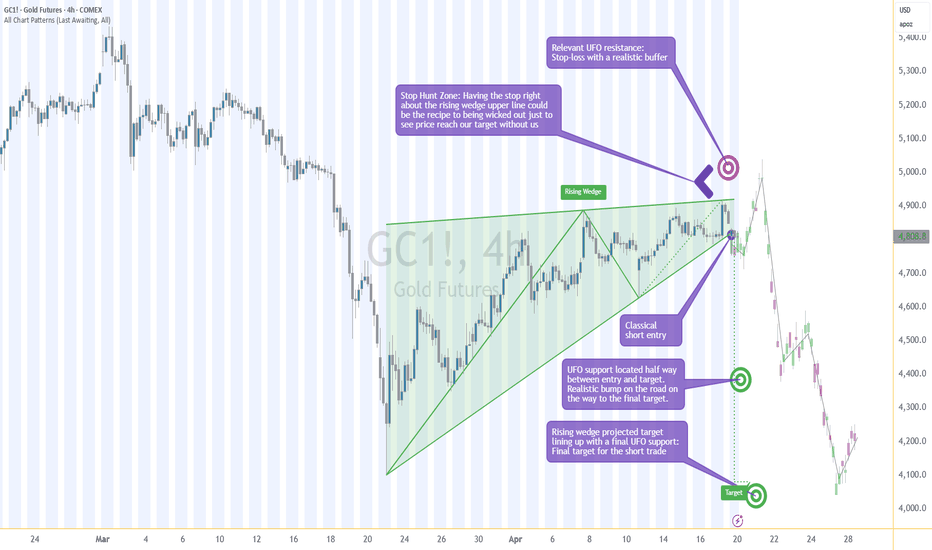
Education 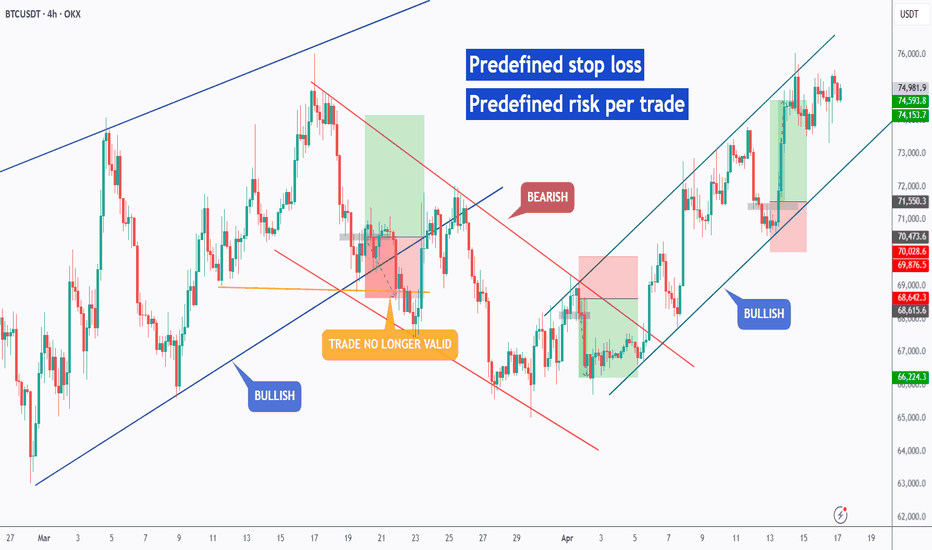
How to Stop Tilting After a Loss-Making DealLosing money in trading can evoke strong emotional reactions, which is a common human response.
The urge to "make back" lost funds can significantly impair judgment and lead to a state known as tilt .
Tilt primarily stems from issues related to self-control , not external market conditions.
When traders lose this control, they risk system failure and may incur even larger financial losses.
Understanding Tilt
Tilt refers to an emotional response to a trading loss that disrupts disciplined decision-making.
Instead of adhering to a predetermined trading strategy, traders may begin making impulsive decisions influenced by feelings of frustration or desperation.
This emotional trading approach typically results in poorer performance and outcomes.
Key Causes of Tilt:
Unrealistic expectations: Disappointment stemming from unattainable goals can set traders up for failure.
Excessive risk: Taking on too much risk in a single trade can amplify anxiety and lead to irrational decisions.
Lack of a clear Trading Plan: Without a well-defined strategy, traders may struggle to maintain focus and discipline.
Emotional attachment to money: Fear of losing capital can cloud judgment and hinder rational decision-making.
Consecutive losses: Experiencing multiple losses in a row can intensify emotional responses and lead to tilt.
Identifying these triggers is essential, as it reveals vulnerabilities within both mindset and trading strategies.
Common Mistakes During Tilt:
Traders often fall into traps such as:
Initiating new trades immediately after being stopped out
Recklessly increasing trade sizes
Ignoring established trading setups
Believing the market will reverse without supporting evidence
A Practical Approach to Recovering from Tilt:
1. Pause trading
Take a break from your trading screen to allow yourself time to calm down.
Once a trade is closed, step away and shift your focus to another activity.
2. Set a fixed stop loss before entering a position
Determine your risk per trade and exit conditions in advance.
Clearly outline your exit plan. Once entered, the stop loss does not move.
3. Review your trading plan
Ensure your rules are clearly defined and achievable.
Create a checklist for entering a position — if conditions are not met, the trade is not opened.
4. Limit risks
Reduce position sizes until confidence and discipline are restored.
Example:
2–3 stop losses per day
Or a daily loss limit of -2%
If these limits are reached — stop trading and rest.
5. Prevent immediate re-entry
Give yourself time to analyze previous trades and evaluate your thinking.
Try to view the market from a different perspective.
6. Limit attempts per trading idea
Allow only two attempts per idea.
If two stop losses occur — the idea is closed for the day.
7. Prioritize the process over the result
Focus on executing trades according to your system, rather than trying to quickly recover losses or chase profits.
Understanding tilt as an emotional challenge rather than a market problem — and implementing disciplined strategies — helps traders regain control after losses and prevent larger setbacks.
Developing self-control is just as important as acquiring technical trading skills.
Mastering self-discipline can significantly improve trading performance and decision-making. Education 
Master the Art of Holding Winning Trades with This Simple TrickTrend swing: how I hold an alt and protect it with a structure-based trailing stop
Let’s talk about the hardest thing in trading: not entries, not TA, not indicators… but holding a winning trade without giving it all back like a clown at the end.
You know that feeling? You catch a clean altcoin breakout, you’re up +35%, your PnL is glowing, and suddenly your brain starts yelling:
“Take it now or the market will take it from you.”
So you close the position, price pulls back a bit… then sends another +60% without you.
Welcome to the mental torture chamber called “trend swing trading”.
I want to show you how I personally hold alts in a trend using a structure-based trailing stop. No magic, no “perfect” tools, just reading price like a story and moving my risk behind the pages that are already written.
Forget fixed take profits for a second. Let’s talk about squeezing the trend until it squeaks.
What is a structure-based trailing stop?
Simple version:
Instead of saying “I’ll take profit at +20% and that’s it”, I move my stop-loss up step by step, behind new swing lows (in an uptrend) or swing highs (in a downtrend).
Price makes a move up → pulls back → continues up.
That pullback low is structure. If the trend is healthy, it should not break that level.
So I do this:
1) Enter after my setup (breakout, retest, whatever you use).
2) Initial stop goes under the last clear swing low.
3) As price makes new higher highs and higher lows, I drag my stop under each new higher low.
4) When structure breaks, I’m out. No drama.
It’s like climbing stairs with a safety net that keeps moving up with you.
How it looks on an alt trend
Imagine an altcoin ripping during a bullish phase:
1) Breakout candle → I enter. Stop is under the last pullback low.
2) Price pumps 15–20%, then dips a bit and forms a new higher low.
That low becomes my new “line in the sand” → I move my stop under it.
3) It rips again. New high, new pullback, another higher low.
I move the stop up again, just under that higher low.
4) At some point, the pullback is deeper, it breaks below the last higher low.
Stop gets hit → I exit.
Sometimes near the top. Sometimes in the middle. Rarely at the bottom. But way better than exiting at +12% “just in case”.
The goal isn’t catching the exact top.
The goal is: if the trend wants to pay me, I stay in the game long enough to get paid.
Why this works better than “take profit at X%”
Fixed targets are like walking into a restaurant with $100 and saying “I’ll only spend $5, no matter what they serve.” Ok, technically safe, but what if they’re serving a 3-course steak menu for $20?
Alts are chaos. They either:
- fakeout and die
- or overperform way more than you expected
If you always cap your winners at +15%, but your losers are -8%, math will eventually punch you in the face.
Structure-based trailing stops do this:
- cut losers when your idea is invalidated
- let winners breathe and grow until the market structurally says “trend is done”
Risk management tweak for beginners
If you’re new and scared to hold:
- Take partial profit at a level you’re comfortable with (say +15–25%)
- Move stop-loss to breakeven or slightly in profit
- Let the rest ride with a structure-based trailing stop
Worst case: market dumps, you walk away green or flat.
Best case: you’re riding one of those stupid +150% alt moves while your emotions are screaming “close it, close it, close it”.
Where exactly do I move the stop?
In an uptrend:
- Use the last clear higher low on the timeframe you’re trading (often 1h / 4h for swings)
- I don’t put the stop exactly at the low, but a bit below it, with a small buffer
- I ignore tiny micro-wiggles and focus on obvious swing points
If I can’t clearly see the swing low with naked eyes, I don’t move the stop yet.
If you need three indicators and a microscope to spot it, it’s probably noise.
Psychological part (where most fail)
This approach sounds logical on paper, but emotionally it’s brutal:
- You watch unrealized profit go from +50% down to +30% during pullbacks
- You’ll exit and watch price bounce from your stop level and go higher
- Sometimes you’ll get wicked out by a fake breakdown
That’s normal. That’s part of trend trading.
The way I see it: “My job is not to milk every move, my job is to be systematic enough to catch the big swings when they come.”
Maybe I’m wrong, but most people don’t lose because of bad strategies. They lose because they betray their own strategy mid-trade.
Quick checklist you can steal
- Uptrend? Higher highs and higher lows on at least one timeframe above your entry.
- Entry? After breakout / retest / your setup, not in the middle of nowhere.
- Initial stop? Below last clear swing low.
- As price trends? Move stop under each new higher low.
- Want safety? Take partial profit, the rest rides with trailing stop.
- Exit? When structure breaks and your stop gets hit. No “what if it bounces”.
You don’t need 20 indicators to hold a trend.
You need a clear structure, a trailing plan, and enough discipline to not sabotage yourself while the market is trying to pay you.  Education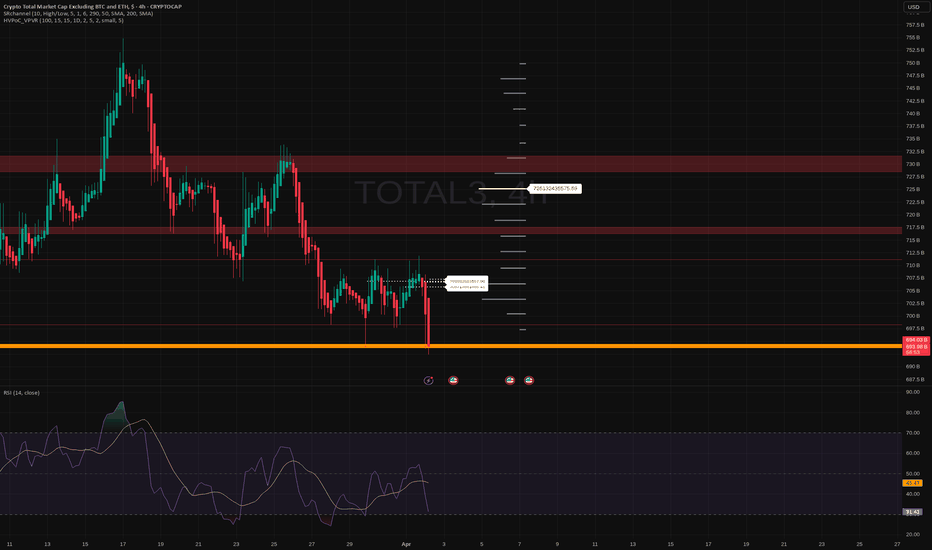
 Long
Long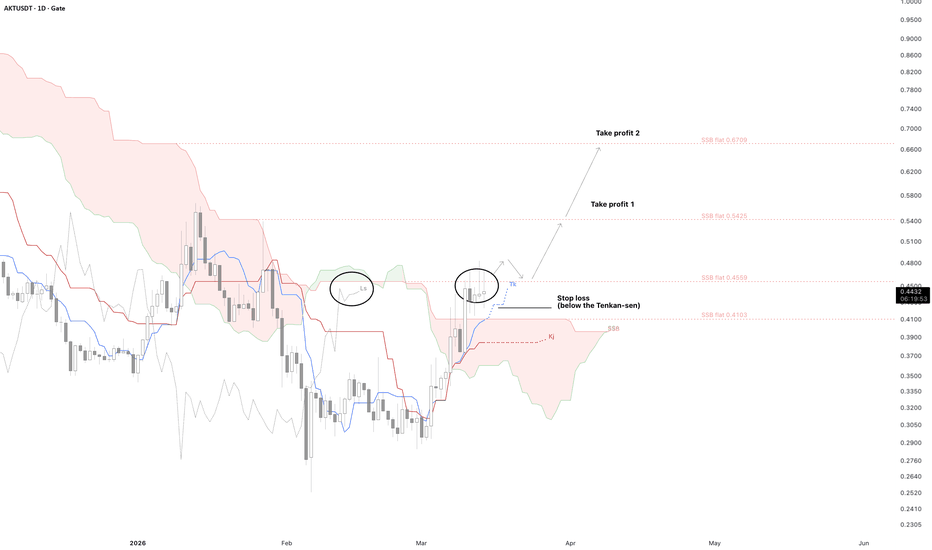
is your leverage strategy rooted in greed or risk management?Let’s talk about leverage – that sweet poison of the market.
Everyone loves it, everyone thinks they can handle it, and most blow up their first account with it. Been there, done that, got the margin-call souvenir.
Today I want to show you a simple idea:
you don’t choose leverage from greed, you choose it from your stop.
Not from “how much I want to make”, but from “how much I can afford to lose”.
Because the market doesn’t care about your goals, only about your risk.
1. Start from the only number that matters: how much you’re ready to lose
Forget profit for a second.
Before you open a trade, ask yourself one simple question:
“If this idea is wrong, how much money am I OK to lose on it?”
For a beginner, that’s usually 1–2% of the account per trade.
Example:
You have a $1,000 account.
You decide: “Max loss per trade – $20” (that’s 2%).
That $20 is your anchor.
Everything else – position size, leverage, entry, stop – builds around that.
2. Your stop decides how big you can go
Now you look at the chart and place a logical stop.
Not random. Not “5 pips because I’m a sniper”.
Stop goes where your idea is invalidated.
Example:
You buy BTC at 60,000.
A logical stop is at 59,400.
That’s a 600-point stop.
So:
Max loss = $20
Stop size = 600 points
Position size = Max loss / Stop size
Position size = 20 / 600 ≈ 0.033 BTC
So your position, without leverage, is:
0.033 × 60,000 = $1,980
But your account is only $1,000.
So to open this position, you need roughly 2x leverage.
Not because “2x sounds safe”.
Because math said so.
This is the key idea:
leverage is not a wish, it’s a consequence.
3. Flip the logic: from YOLO mode to pro mode
How most beginners do it:
1) “I have 100x available, let’s use 25x, I’m not crazy.”
2) Open max position size allowed.
3) Then drag stop randomly so liquidation isn’t too close.
That’s like jumping from a plane and then checking if you packed the parachute.
How pros do it:
1) Define risk in money
2) Place stop where the idea breaks
3) Calculate position size from risk and stop
4) Use just enough leverage to open that position
Same buttons, different mindset.
4. Leverage doesn’t change your risk if you do it right
This part messes with people’s heads.
If you fix your dollar risk and your stop, then increasing leverage doesn’t magically increase risk per trade.
What leverage really changes:
- Required margin (how much of your capital is “frozen” in the position)
- Distance to liquidation (how close you are to getting auto-closed)
What leverage doesn’t change (if you’re disciplined):
- Your defined loss if stop is hit
- Your risk in % of account
So you can technically use 10x, 20x, even 50x on a tiny position, and still risk the same 1–2% of your account if your stop is respected.
The problem is not leverage.
The problem is people using leverage to force huge positions with tiny stops and zero risk logic.
5. Tiny stop + huge leverage = account blender
Another trap:
“Bro, I’ll use a 0.1% stop and 50x, risk is small.”
On paper – maybe.
In reality – spread, slippage, random wick, funding, some whale sneezes – you’re out.
Price doesn’t move in a straight TikTok tutorial line. It spikes, hunts, fakes out, then goes your way… after kicking you out.
Small stop isn’t “pro”.
Logical stop is pro.
Maybe I’m wrong, but 90% of people blowing accounts on leverage aren’t “unlucky” – they’re just sizing from greed, not from their stop.
6. Simple checklist before you hit “Buy” or “Sell”
Next time you open a trade, go through this 20-second routine:
1) What’s my account size?
2) What % am I ready to lose if I’m wrong?
3) Convert that % into dollars – that’s max loss.
4) Where is my invalidation on the chart? That’s my stop.
5) Calculate position size = max loss / stop size.
6) From position size and entry price, see how big the position is.
7) Choose leverage only to match that size, nothing more.
If after calculation you need 3x – use 3x.
If you only need 1.5x – use 1.5x.
If the trade needs 40x to “work” – maybe the setup just sucks.
Last thought
Leverage is like adding spicy sauce to your food.
A bit – enhances the flavor.
Too much – you’re not “eating”, you’re surviving.
Calculate from the stop, not from the dream profit.
Define your loss first, let leverage be the last step, not the first.
That’s how you stop playing leverage roulette and start trading like someone who plans to still have an account next year. Education 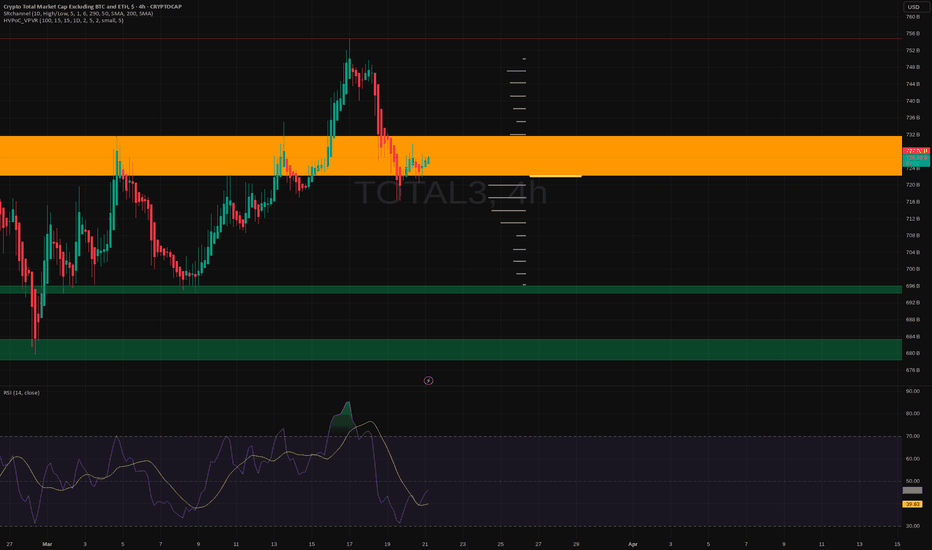
Are your stop losses risking more than they should on alts?“Stop below the nearest low” on alts is the reason many good ideas die early and bad habits live forever.
On majors it’s already shaky. On alts? It’s a donation box.
Think how most newbies do it:
– Open the chart
– See a cute little swing low
– Long
– Stop “just under that low, to be safe”
Safe from what? On many alts that “nearest low” is where the whole world is parking stops. That zone isn’t support, it’s a buffet for whoever’s providing liquidity.
Alts move like drunk mosquitoes. Thin books, wild wicks, bots everywhere. Price dips 3–5% in 10 seconds, tags all those neat textbook stops under the nearest low… then teleports back up and flies without you. You were right on direction and still lost money. That’s the most expensive kind of “right”.
Here’s how I think about stops on alts.
I don’t place my stop at the nearest low.
I place it where my idea is actually wrong.
If I’m buying a pullback in an uptrend, the idea is: “trend continues, higher lows hold.” So my invalidation is below the level that defines the trend, not the closest baby-swing that formed 15 minutes ago.
Nearest low = noise.
Key low = structure.
And because alts wick like crazy, I give some breathing room under that key level. Not 0.1%, more like “what’s a normal shakeout for this coin?” Look left. If this thing routinely wicks 4–6% beyond levels, putting your stop 1% under the low is like standing on the tracks because “the train usually brakes”.
So what do I actually do:
1) Pick the level that breaks my idea if it fails – higher timeframe swing, strong base, major support cluster.
2) Add a small buffer under/over that level, knowing alts love stop hunts.
3) Then I adjust position size so that if that level breaks, I still only lose my fixed risk (for example 1% of the account).
First the idea, then invalidation, then position size.
Not entry first, stop second, “hope” third.
Maybe I’m wrong, but tight stops on alts are one of the main reasons people think “the market is hunting me”. No, you’re just hiding in the obvious bushes with everyone else.
Next time you’re about to slap a stop “just below the nearest low”, ask yourself:
“If price tags this and instantly reverses… will I be surprised?”
If the answer is no – your stop is probably in the kill zone, not in the safety zone. Education 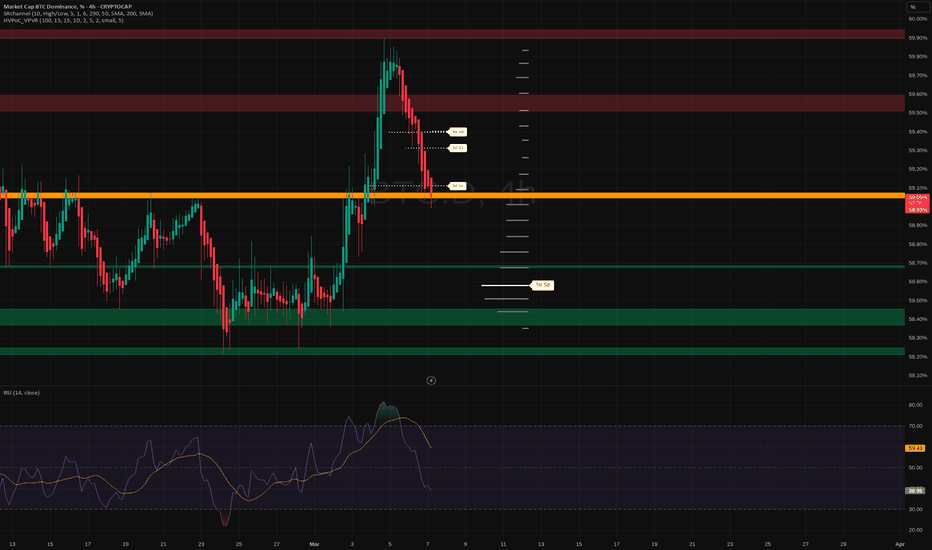
Stop Loss Hunts: LiquidityMany traders describe sharp wicks beyond obvious highs or lows as “stop loss hunts.” The phrase suggests that large players intentionally target retail traders. In practice, what looks like manipulation is usually liquidity-driven execution.
Large market participants cannot enter or exit positions in a single order. Their size requires significant opposing flow. That flow tends to accumulate in predictable areas: above swing highs, below swing lows, around breakout levels, and near range boundaries where stop losses cluster.
These areas form liquidity pools.
When price reaches them, several things happen at once. Breakout traders enter the market, stop losses are triggered, and resting orders become active. This sudden increase in order flow provides the liquidity required for larger participants to execute size efficiently.
What retail traders experience as a “stop hunt” is often the market accessing this liquidity.
The sequence is usually consistent:
Price approaches a clear level where stops are likely resting.
The level is briefly broken as stop orders trigger.
Liquidity enters the market through forced exits and breakout entries.
Larger participants absorb this flow and position themselves.
Once liquidity is exhausted, price often rotates back into the prior range.
This is why many false breakouts occur at obvious levels.
The break itself is not the objective. The liquidity behind the level is.
Understanding this changes how traders interpret price action.
Instead of reacting to the wick itself, the focus shifts to what price does after the liquidity is taken.
If price quickly rejects the level and returns inside the range, it signals that the liquidity objective has been completed and continuation failed.
If price holds above the level and shows acceptance, the breakout may be genuine.
The difference lies in acceptance versus rejection.
Stop runs are also closely connected to market structure. When liquidity is taken below a low and price immediately moves higher, it often creates a structural shift in momentum. The sweep removes weak positioning and allows stronger participants to drive price toward the next objective.
For traders, the practical adjustment is simple.
Avoid placing stops at the most obvious levels where liquidity clusters.
Instead, place invalidation beyond structural noise or wait for liquidity events to occur before entering a position.
The goal is not to avoid stop runs entirely.
The goal is to understand why they happen.
Markets move toward liquidity because liquidity allows transactions to occur. Once that liquidity is accessed, the market reveals its next direction.
When traders begin to view stop hunts as liquidity events rather than manipulation, price behavior becomes far easier to interpret. Education 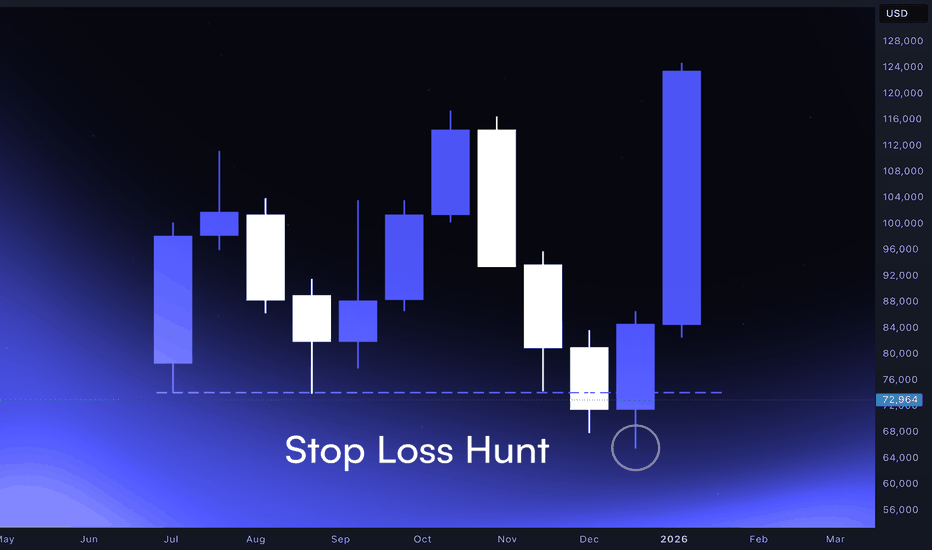
How To Improve And Evolve Our Trading PhilosophyThis weekend video should have been discussing a new section in our personal trading platform, but during the last two weeks many things happened that affected the rules that comprise the trading philosophy part of the trading platform.
One trade hijacked us emotionally, and took with it all previous weeks' profits. This trade made us go back to square one, and start all over for achieving the account doubling strategic objective.
The great thing about what we are doing is that we are learning. This loss made us change things across the board in the trading platform. Something that we did not mention in the video is that during last week's three trades, and because of the changes that we made to the take profit rules, we were able to get back all the profits from the first two weeks and more.
The only winnings we could not get were the ones of GBPUSD trade which was opened along with the losing trade that took all the winnings with it.
The major change to the trading philosophy was that we are no longer standing by the "No Stop Loss" philosophy. We are back to utilizing a stop loss and found a way that we can use it. Once we reach the trading methodology part of our trading platform we will see that we are not targeting any RRR; therefore, the way we are using stop loss is within that spirit of no RRR is controlling our trading decisions.
Re-installing stop loss will have effects on other parts of the trading philosophy. The first part is the "No Friday trading." This one might be deleted now since we have a stop loss involved. The other rule is "Having no losing trades." Now that we do have a stop loss then we will have losing trades, but we are going to keep that for now and see how the trades will go, especially that we made some changes on how we are implementing our trading strategy.
This concludes our weekend video, and hopefully we will be discussing the trading methodology next weekend, unless we face new changes based on next week's trading sessions.
The Investor How Much Can You Lose?Every trade carries two risks. One is visible and measured. The other is hidden and cumulative. Most traders focus on the visible number: the percentage or dollar amount they risk on a single position. What actually ends trading careers is the second risk, the one created by behavior, sequencing, and correlation.
The obvious limit is per-trade risk. This is the amount you are willing to lose if the idea is invalidated. It must be small enough to survive randomness and large enough to matter when the market aligns. In crypto, where volatility expands quickly, this number must account for realistic invalidation distance, not arbitrary percentages. A stop placed inside noise does not reduce risk. It increases failure frequency.
The more important limit is daily and weekly loss tolerance. Losses cluster. A single losing trade rarely causes damage. Multiple losses taken during the same session, often driven by frustration or overconfidence, compound far faster than expected. This is why professional risk frameworks cap daily exposure. When conditions are poor, capital preservation matters more than participation.
Correlation is another silent risk. Taking multiple positions that rely on the same narrative effectively multiplies exposure without appearing to do so. Long BTC, long SOL, and long an alt correlated to risk-on behaviour is one idea expressed three times. When that idea fails, the drawdown feels sudden and unfair, but it was mathematically predictable.
There is also execution risk. Slippage, spread expansion, partial fills, and latency increase effective loss beyond what the chart suggests. Backtested risk rarely matches live risk. In fast markets, the distance between intention and execution widens. Your risk model must assume imperfect fills, especially around liquidity events.
Finally, there is psychological drawdown. After losses, decision quality degrades. Traders increase size to recover, hesitate on valid setups, or abandon rules entirely. These reactions create losses larger than any predefined stop. Risk is no longer controlled by numbers but by emotion.
So how much can you lose? You can lose far more than a single trade suggests if you ignore clustering, correlation, execution friction, and behavioral response. Sustainable trading is not about avoiding losses. It is about defining limits that keep losses contained when the market environment is not supportive. Capital survives first. Opportunity returns later.
Liquidation Heatmaps: Trading Where the Stop Losses AreHave you ever placed a Stop Loss at a "perfect" support level, only to watch the price wick down, hit your stop by $10, and then immediately rocket back up to your target?
You didn't just get unlucky. You got hunted. In 2026, algorithms do not trade patterns; they trade Liquidity. And the biggest source of liquidity is your Stop Loss.
To stop getting wrecked, you need to stop looking at standard candlestick charts and start looking at Liquidation Heatmaps.
1. The Theory: Price is a Magnet
Market Makers (the big players providing liquidity) have a problem: Size. If a Whale wants to buy $50 Million worth of Bitcoin, they cannot just click "Market Buy." The price would slip upwards instantly, and they would get a terrible entry.
They need a seller. And who is forced to sell? A Long trader getting liquidated.
The Mechanism: When a Long trader hits their liquidation price, the exchange force-sells their bag.
The Strategy: The Whale pushes the price down into a cluster of Long Liquidations. The retail traders are forced to sell, and the Whale absorbs that selling pressure to fill their massive Buy Order.
Key Lesson: Liquidation Heatmaps show you exactly where these "Clusters" of stop losses are hiding. These zones act like Magnets for the price.
2. How to Read the Map
Tools like Coinglass, Hyblock, or Kingfisher visualize this data.
The Colors:
Bright Yellow/Red Zones: Massive leverage is piled up here. Billions of dollars will be liquidated if price hits this level. (High Probability Magnet).
Dark/Blue Zones: Very little liquidity. Price will move through these areas quickly (Low resistance).
3. The "Liquidation Cascade" Strategy
We do not trade before the liquidity is taken. We trade after.
The Setup (The Long Sweep):
Identify the Zone: You see a massive bright yellow cluster of liquidity at $94,500. Current price is $95,200.
The Wait: Do not Long at $95,000. Wait.
The Hunt: Price rapidly drops to $94,450.
The Trigger: Watch the order book. Does the price instantly bounce back above the level? This is called a "Swing Failure Pattern" (SFP). The liquidity has been grabbed.
The Entry: Enter Long immediately after the reclaim. The "fuel" for the move down is gone, so the path of least resistance is now UP.
4. Where to Place Your Stop Loss
This is the most actionable tip you will ever read: Never place your Stop Loss in the Yellow Zone.
If the Heatmap shows a massive cluster of stops at $94,000, and you put your stop at $94,000, you are volunteering to be exit liquidity.
The Fix: Place your stop below the cluster (e.g., at $93,800). Let the market hunt the crowd, but survive the wick.
5. The "Delta" Warning
Look at the Liquidation Delta (Longs vs. Shorts).
If there are $5B Long Liquidations below and only $200M Short Liquidations above... guess which way the market is going?
The market always seeks the path of Maximum Pain. If it pays more to wreck the Longs, the price goes down.
Conclusion
Trading without a Liquidation Heatmap is like driving at night with your headlights off. You might stay on the road for a while, but eventually, you will hit a ditch.
Don't be the liquidity.
Trade the reaction, not the prediction.
-TuffyCalls (Team Mubite)  Short
Short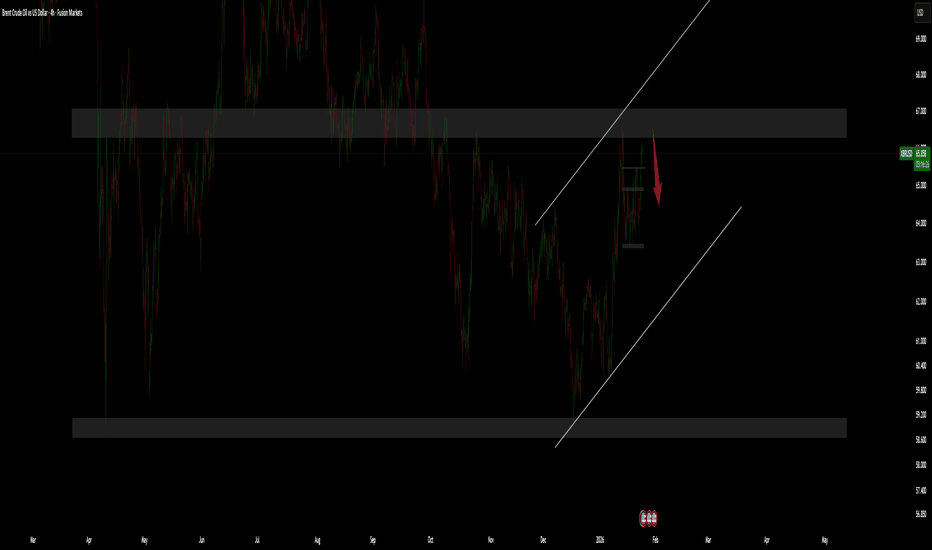
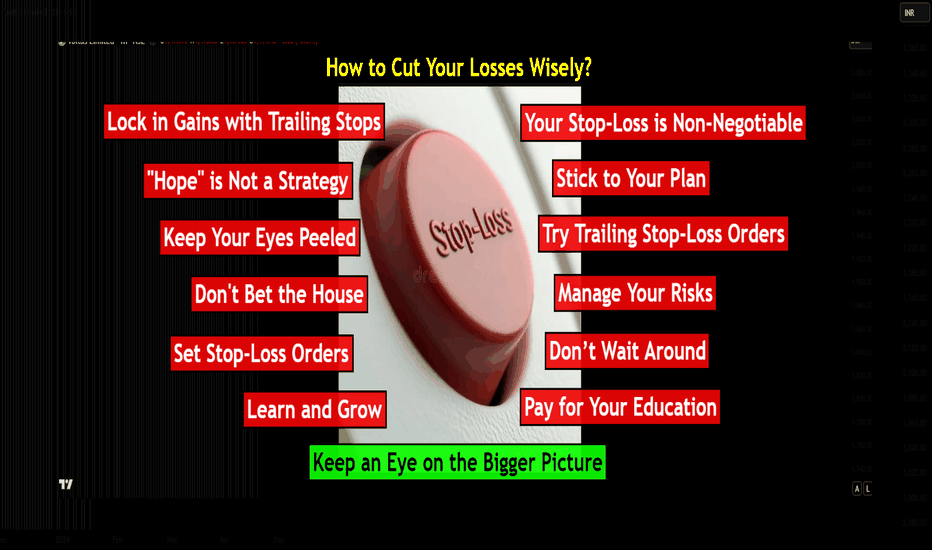
The Art of the Exit: Mastering the "Wise Cut"Hello Friends, Welcom to RK_Chaarts,
Today we are going to understand that what is The Art of the Exit: Why "Cutting Losses" is Your Most Important Skill.
Let’s be real: nobody likes losing money. It stings. But if you’re going to survive in these markets, you have to get comfortable with being wrong.
In trading, a loss is just a business expense. The goal isn’t to avoid them entirely (that’s impossible); the goal is to keep them small enough that they don't take you out of the game.
Here is how to manage your exits without losing your mind—or your account:
1. Your Stop-Loss is Non-Negotiable
Think of a stop-loss as your "insurance policy." You should know exactly where you’re getting out before you ever hit the buy button. By setting a hard exit point, you take the decision-making out of your hands when emotions are running high.
2. Stick to the Script
We’ve all been there: price hits your stop, and you think, "Maybe if I just give it a few more pips, it’ll bounce." Don't do it. That’s how a small, manageable loss turns into a portfolio-killer. Trust your plan, not your gut.
3. Lock in Gains with Trailing Stops
If a trade is moving in your favor, don’t be greedy. Use a trailing stop to follow the price up (or down). This lets you stay in the trend while ensuring that even if the market reverses, you still walk away with a profit.
4. Don't Bet the House
The "Golden Rule" is simple: never risk more than you can afford to lose on a single trade. Most pros only risk 1-2% of their account per setup. This way, even a string of five losses is just a minor setback, not a disaster.
5. Keep an Eye on the Bigger Picture
Markets don't move in a vacuum. High-impact news or economic shifts can wreck a perfectly good technical setup. Stay informed, check the calendar, and be ready to step aside if the environment gets too chaotic.
6. "Hope" is Not a Strategy
Holding onto a losing position and praying for a miracle is the fastest way to blow an account. Cut the dead weight early. There will always be another setup tomorrow. Protect your capital so you can live to trade it.
7. Pay for Your Education
Every time you take a loss, you’ve essentially paid a "tuition fee" to the market. Don't waste it. Review the trade: Did you follow your rules? Was the entry off? Use those mistakes to sharpen your edge for the next one.
The Bottom Line
Trading isn't about being right; it's about math and discipline. If you can keep your losses small and your winners big, the math will eventually work in your favor.
Stop trying to be "right" and start being "profitable."
How do you handle a losing streak? Drop a comment below 👇
I am not Sebi registered analyst.
My studies are for educational purpose only.
Please Consult your financial advisor before trading or investing.
I am not responsible for any kinds of your profits and your losses.
Most investors treat trading as a hobby because they have a full-time job doing something else.
However, If you treat trading like a business, it will pay you like a business.
If you treat like a hobby, hobbies don't pay, they cost you...!
Hope this post is helpful to community
Thanks
RK💕
Disclaimer and Risk Warning.
The analysis and discussion provided on in.tradingview.com is intended for educational purposes only and should not be relied upon for trading decisions. RK_Chaarts is not an investment adviser and the information provided here should not be taken as professional investment advice. Before buying or selling any investments, securities, or precious metals, it is recommended that you conduct your own due diligence. RK_Chaarts does not share in your profits and will not take responsibility for any losses you may incur. So Please Consult your financial advisor before trading or investing.
 Education