Long
Long
 Long
Long
Dassault Systèmes — Bullish Buying SetupDassault Systèmes is developing an interesting bullish opportunity as price action begins to show improving strength from the current area. After the recent movement, the stock is showing signs that buyers are becoming more active and attempting to establish a stronger upward phase.
The key feature of this setup is the change in market behaviour. Instead of focusing solely on the previous weakness, the analysis looks at how price is responding now. Increasing buying interest can provide the foundation for a recovery, particularly if the stock continues to build higher levels and maintain positive momentum.
From a technical standpoint, the setup is based on the interaction between price structure, directional momentum and buyer participation. The objective is to capture the potential upside expansion rather than react to every short-term fluctuation.
The broader technical picture suggests that the current area can become a launching point for a fresh bullish sequence. If buyers continue to strengthen their position, price could progressively move toward higher zones as the recovery gains traction.
📊 Market Structure
The setup is centred around a potential transition from consolidation and weakness into renewed upward momentum.
Price behaviour will remain important as the move develops. A sustained improvement in structure would strengthen the bullish scenario and create a clearer path toward higher levels.
The analysis therefore focuses on where the market is heading based on its current behaviour, rather than relying on a single candle or isolated price movement.
🚀 Bullish Roadmap
Current area → Buyer participation → Structural improvement → Momentum expansion → Higher levels
The projected path allows for normal fluctuations along the way, but the principal direction remains focused on the upside.
If the developing structure continues to support buyers, Dassault Systèmes could enter a stronger recovery phase and gradually extend toward the next areas of interest.
🔍 Setup Overview
- Instrument: Dassault Systèmes
- Ticker: DSY
- Market: Euronext Paris
- Direction: Buy
- Bias: Bullish
- Focus: Upside continuation
- Technical basis: Price structure, momentum and buyer participation
- Scenario: Recovery toward higher levels
🎯 Final View
The current chart presents a developing opportunity on the buy side. The important factor is the emerging improvement in price behaviour and the possibility that this develops into a broader upward sequence.
The market has created the setup. Buyers now have the opportunity to turn that structure into the next upside move. 📈🔥  Long
Long
L’Oréal — Bearish Selling Setup | Target 360L’Oréal — Bearish Selling Setup | Target 360 📉
L’Oréal is currently moving lower, with the bearish structure remaining active and sellers continuing to control the direction of price. The market has already started its downside phase, and the current setup is focused on capturing the continuation of this move toward the 360 target.
From a technical perspective, the price action is showing sustained weakness rather than a simple isolated pullback. The downside momentum has developed progressively, keeping the bearish roadmap intact and creating room for another leg lower.
The key focus is now the continuation of selling pressure. As long as the current structure remains bearish, short-term rebounds can remain part of the broader downward sequence rather than automatically changing the underlying direction.
The analysis is based on price structure, momentum and the behaviour of sellers across the current move. The objective is clearly defined: 360 remains the projected destination.
📉 Bearish Roadmap
Current price action → Continued selling pressure → Lower levels → 360 target
The market has already moved lower, and the setup now focuses on the next phase of that decline. If sellers maintain their dominance, price can continue progressing toward the identified objective.
L’Oréal’s latest closing price was €376.05 on September 18, 2026, while the 52-week range shown in recent market data is €338.85–€405.80. This places the 360 objective within the stock’s established recent trading range.
🔍 Setup Overview
- Instrument: L’Oréal
- Ticker: OR
- Market: Euronext Paris
- Direction: Sell
- Bias: Bearish
- Current phase: Downward movement
- Target: €360
- Focus: Continued downside
- Technical basis: Structure, momentum and price behaviour
This is not a setup based on predicting a reversal from a random level. The market is already demonstrating downside movement, and the analysis is focused on whether that existing bearish momentum can carry price toward the mapped objective.
🎯 Final View
The decline is already underway. Sellers remain active, and the technical roadmap continues to point toward €360.
The move lower has started — now the focus is on completing the downside journey toward 360. 📉🎯  Short
Short
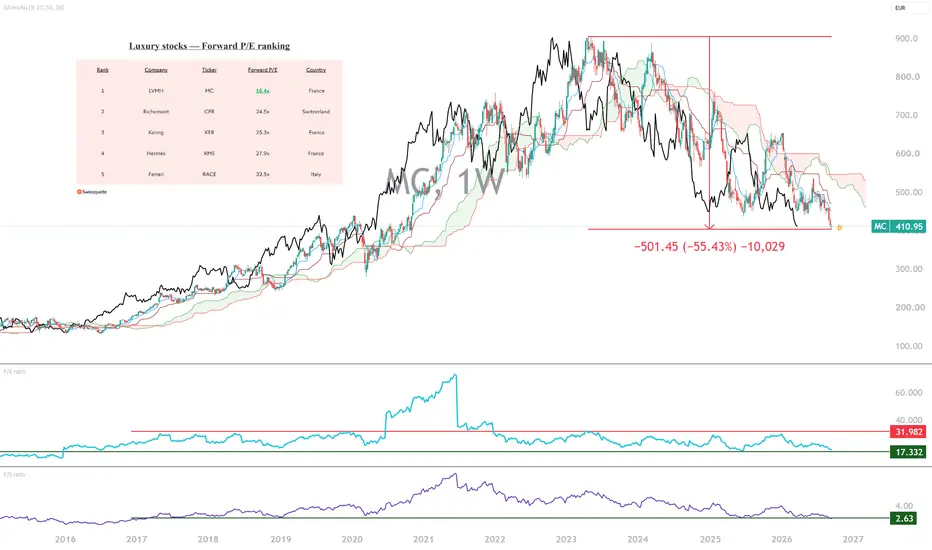
LVMH, after the fall, an opportunity?LVMH’s share price has lost 55% since its all-time high in spring 2023, with the price falling from more than €900 to €400. LVMH is by far the world’s leading company in the luxury sector, so after such a sharp stock market decline, could the stock once again soon represent an opportunity?
To answer this question analytically, I suggest looking at stock market valuation ratios and technical analysis signals from the financial markets.
· Stock market valuation ratios: forward P/E, traditional P/E and Price-to-Sales
· Medium- and long-term technical analysis signals based on the weekly Japanese candlestick chart
But first, let us recall why LVMH’s share price has lost more than 50% since its 2023 record high.
The main reason is the sharp reversal in the luxury cycle after several exceptional years of growth. From 2023 onwards, demand gradually normalized, with a particularly pronounced slowdown in luxury consumption in China, a strategic market for LVMH. The group also suffered from the consequences of the very significant price increases implemented in recent years, which gradually pushed part of its so-called “aspirational” customer base away. In 2024, LVMH’s revenue therefore declined by 2%, followed by another 1% decline in 2025, while recurring operating profit suffered more significantly.
This was compounded by a less favorable macroeconomic environment, geopolitical and trade tensions, as well as uncertainties surrounding consumer spending in the United States and Asia. The stock market primarily penalized the decline in earnings expectations: LVMH was valued at very high multiples at its 2023 peak, based on growth that appeared capable of continuing for a prolonged period. When that growth reversed, the contraction in the valuation multiple amplified the decline in earnings.
The question now is whether this sharp decline has sufficiently priced in the current difficulties to once again offer an attractive entry point.
First piece of good news: from a stock valuation perspective, LVMH is once again an opportunity, especially compared with its competitors.
The table below shows the global top 5 listed companies in the luxury sector, together with their forward P/E ratios. After a 55% decline from its all-time high, LVMH now trades at a significant discount to its competitors in terms of stock market valuation.
However, before returning to a buying position, the technical trend needs to stop being bearish, and the Ichimoku system can be useful in identifying this. The bearish trend will be over when the market is able to move back above the weekly Kumo of the Ichimoku system.
The chart below shows LVMH’s weekly Japanese candlesticks, together with the traditional P/E, forward P/E and Price-to-Sales valuation ratios. The stock remains in a bearish trend as long as the price trades below the weekly cloud of the Ichimoku system.
DISCLAIMER:
This content is intended for individuals who are familiar with financial markets and instruments and is for information purposes only. The presented idea (including market commentary, market data and observations) is not a work product of any research department of Swissquote or its affiliates. This material is intended to highlight market action and does not constitute investment, legal or tax advice. If you are a retail investor or lack experience in trading complex financial products, it is advisable to seek professional advice from licensed advisor before making any financial decisions.
This content is not intended to manipulate the market or encourage any specific financial behavior.
Swissquote makes no representation or warranty as to the quality, completeness, accuracy, comprehensiveness or non-infringement of such content. The views expressed are those of the consultant and are provided for educational purposes only. Any information provided relating to a product or market should not be construed as recommending an investment strategy or transaction. Past performance is not a guarantee of future results.
Swissquote and its employees and representatives shall in no event be held liable for any damages or losses arising directly or indirectly from decisions made on the basis of this content.
The use of any third-party brands or trademarks is for information only and does not imply endorsement by Swissquote, or that the trademark owner has authorised Swissquote to promote its products or services.
Swissquote is the marketing brand for the activities of Swissquote Bank Ltd (Switzerland) regulated by FINMA, Swissquote Capital Markets Limited regulated by CySEC (Cyprus), Swissquote Bank Europe SA (Luxembourg) regulated by the CSSF, Swissquote Ltd (UK) regulated by the FCA, Swissquote Financial Services (Malta) Ltd regulated by the Malta Financial Services Authority, Swissquote MEA Ltd. (UAE) regulated by the Dubai Financial Services Authority, Swissquote Pte Ltd (Singapore) regulated by the Monetary Authority of Singapore, Swissquote Asia Limited (Hong Kong) licensed by the Hong Kong Securities and Futures Commission (SFC) and Swissquote South Africa (Pty) Ltd supervised by the FSCA.
Products and services of Swissquote are only intended for those permitted to receive them under local law.
All investments carry a degree of risk. The risk of loss in trading or holding financial instruments can be substantial. The value of financial instruments, including but not limited to stocks, bonds, cryptocurrencies, and other assets, can fluctuate both upwards and downwards. There is a significant risk of financial loss when buying, selling, holding, staking, or investing in these instruments. SQBE makes no recommendations regarding any specific investment, transaction, or the use of any particular investment strategy.
CFDs are complex instruments and come with a high risk of losing money rapidly due to leverage. The vast majority of retail client accounts suffer capital losses when trading in CFDs. You should consider whether you understand how CFDs work and whether you can afford to take the high risk of losing your money.
Digital Assets are unregulated in most countries and consumer protection rules may not apply. As highly volatile speculative investments, Digital Assets are not suitable for investors without a high-risk tolerance. Make sure you understand each Digital Asset before you trade.
Cryptocurrencies are not considered legal tender in some jurisdictions and are subject to regulatory uncertainties.
The use of Internet-based systems can involve high risks, including, but not limited to, fraud, cyber-attacks, network and communication failures, as well as identity theft and phishing attacks related to crypto-assets.
Short 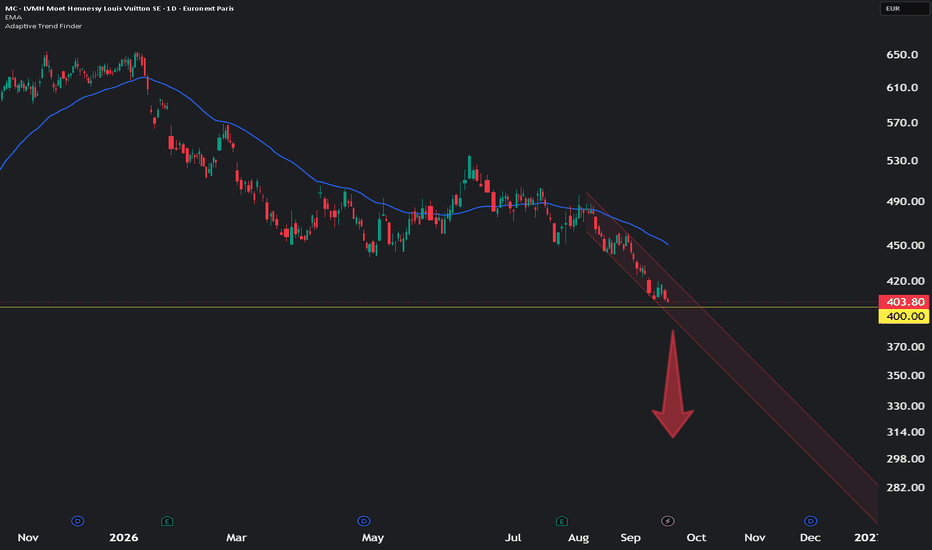
bioMérieux: A Defensive Diagnostics Leader Near a Potential TurnBioMérieux ( EURONEXT:BIM ) is starting to become interesting again after a substantial reset.
The stock has fallen from roughly €125 in 2025 to the €70–75 area, bringing it back toward levels that previously acted as an important accumulation zone. Unlike many stocks showing similarly deep corrections, bioMérieux remains a fundamentally solid and relatively defensive business.
A high-quality diagnostics franchise
bioMérieux is a French leader in in-vitro diagnostics, with a particularly strong position in infectious-disease testing.
Its technologies are used by hospitals, laboratories and industrial customers across areas such as:
microbiology and bacterial identification
antimicrobial susceptibility testing
molecular diagnostics
immunoassays
food and pharmaceutical quality control
That gives the company exposure to structural themes including antimicrobial resistance, faster infectious-disease diagnosis and increasing laboratory automation.
An important feature of the model is its installed base of diagnostic systems. Once laboratories use bioMérieux equipment, they generate recurring demand for reagents and consumables — creating a more resilient revenue stream than a pure equipment manufacturer.
Fundamentals remain respectable
My fundamental model remains constructive:
Business Quality: GREEN
Quality score: 2.5/3
Return on capital: 8.85%
Margin trend: +1.24%
The balance sheet is particularly clean, with debt/equity around 0.1, while the valuation model scores 5.5/7.
The growth picture is more mixed.
Three-year profit growth remains around -4.3%, while three-year sales growth is only about 4.3%. However, the forward model points toward potentially much stronger earnings expansion, with estimated future profit growth above 30%.
So this isn't primarily a hyper-growth story. It is closer to a quality healthcare company undergoing an earnings normalization.
The technical setup is getting interesting
The long-term oscillator has now fallen into an unusually depressed area:
WT1 / WT2: -54.2 / -55.5
At the same time:
Top recent: YES
WT cross: YES
Combined score: GREEN 6/10
Entry quality: EXCELLENT 85%
The scanner currently remains:
WATCH — 2/3
That's an important distinction.
The valuation and long-term setup look attractive, but Band 1 remains RED and the bands are not yet synchronized. In other words, the stock is showing early signs of stabilization rather than a fully confirmed reversal.
The €68–75 region now looks particularly important. Holding this zone while momentum continues to turn upward would materially strengthen the setup.
My view
bioMérieux is one of those situations where I would rather start watching before everything turns green.
The business remains high quality, leverage is low, valuation has improved significantly and long-term momentum is deeply depressed.
But confirmation is still missing.
For now:
WATCH — attractive quality setup, but I want one more technical confirmation before moving to BUY.
A successful stabilization around €70–75 followed by improving momentum could make EURONEXT:BIM a particularly interesting defensive healthcare recovery candidate.
Not financial advice.  Long
Long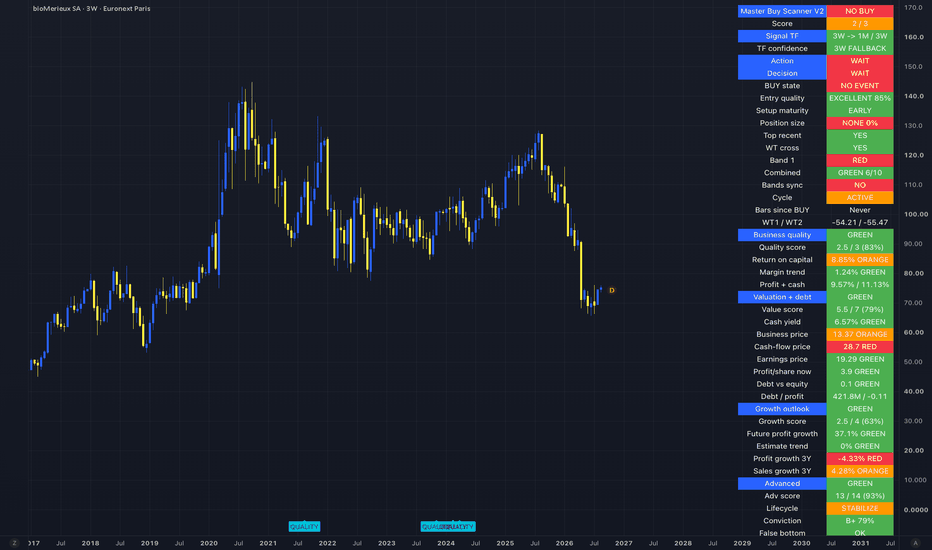
VRLA: The Controlling Shareholder Paid €28 - The Market Says €19
EURONEXT:VRLA is now trading around €19–20, more than 50% below its 2021 high and, perhaps more interestingly, roughly 30% below the €28.30 tender-offer price paid by BWGI just last year.
That immediately makes Verallia worth another look.
The company is Europe's leading glass-packaging producer, cash generation is improving, EBITDA has stabilized and management just reconfirmed its 2026 targets.
Yet the market remains deeply skeptical.
Master Buy Scanner V2 — Monthly
Score: 3/3
Decision: GROWTH WATCH
BUY state: NO EVENT
Entry quality: EXCELLENT — 100%
Setup maturity: EARLY
Position size: NONE — 0%
WT cross: YES
Band 1: GREEN
Combined: GREEN 5/10
Bands synchronized: YES
Cycle: ACTIVE
WT1 / WT2: -54.57 / -55.24
This is an unusual configuration.
Almost every technical building block has turned bullish: the WT cross is confirmed, Band 1 is green, the bands are synchronized and the cycle is active.
But the scanner still classifies it as GROWTH WATCH rather than BUY.
In other words:
The bottoming process looks advanced, but the fundamental-growth filter is stopping the model from committing capital.
The business is stabilizing
Verallia's H1 2026 results were considerably better than the share-price trend suggests.
Revenue: €1.699B, -1.4%
Volumes: stable
Adjusted EBITDA: €352M, essentially flat
EBITDA margin: 20.7%, +33 bps
Free cash flow: €102M vs €66M
Net leverage: 2.6x, improving from 2.7x
Management also maintained its full-year targets of approximately €700M adjusted EBITDA and €220M free cash flow.
That's an important distinction.
Verallia is not currently growing, but the deterioration in profitability appears to be stabilizing.
2025 was the real reset
The current weakness makes more sense when looking back one year.
In 2025, revenue fell 3.6% to €3.33B, while adjusted EBITDA dropped from €842M to €692M. EBITDA margin compressed from 24.4% to 20.8%.
But free cash flow doubled from €83M to €166M.
So the company entered 2026 with a fairly simple task:
Stop the EBITDA decline, improve cash conversion and reduce leverage.
H1 suggests it is beginning to accomplish that.
Verallia is cutting capacity where demand no longer justifies it
Management isn't simply waiting for glass demand to recover.
The company is restructuring its European manufacturing footprint, including plans involving the Essen site in Germany, a furnace at Châteaubernard in France and production capacity in the UK, while shifting toward more efficient assets.
Those measures are already beginning to benefit results, and management expects a larger contribution during H2 2026.
This matters because glass manufacturing has very high fixed costs.
When demand falls, underutilized furnaces destroy margins quickly.
Reducing excess capacity can therefore improve profitability even without strong revenue growth.
Energy risk is also becoming more manageable
Energy is one of Verallia's largest variable costs.
The company entered 2026 with more than 80% of its energy requirements hedged, giving management much greater visibility on its cost base.
Longer term, Verallia is also investing heavily in furnace electrification.
Its Cognac facility operates what the company describes as the world's first 100% electric furnace for food-grade glass packaging, cutting CO₂ emissions by around 60% versus a conventional furnace. In 2026, it also inaugurated its first hybrid furnace in Spain.
I don't see decarbonization as the main reason to own VRLA.
But lower energy intensity and more modern production capacity could become meaningful competitive advantages in an energy-intensive European industry.
The most intriguing number isn't on the scanner
In 2025, BWGI launched a tender offer for Verallia at €28.30 per share.
The offer succeeded, and BWGI became the controlling shareholder.
Today, the controlling shareholder ultimately sits behind approximately 77.2% of Verallia's capital, while the public float is only about 12.3%.
And yet the shares now trade around €19.
That does not automatically mean €28.30 represents fair value today. Operating conditions have weakened since the transaction.
But it is still useful context:
A sophisticated controlling shareholder was willing to deploy significant capital at a price materially above today's market value.
Low free float cuts both ways
That ownership structure creates an unusual setup.
A committed controlling shareholder can support long-term investment and allow management to focus less on quarterly market pressure.
But only about 12% of the shares are publicly held.
That means:
Lower liquidity
Potentially greater price volatility
Less influence for minority shareholders
Governance decisions increasingly dominated by the controlling shareholder
I would therefore apply some minority-shareholder discount rather than simply comparing today's price with the €28.30 offer.
Valuation looks better than earnings alone suggest
The scanner gives Verallia:
Value score: 4/7
Cash yield: 9.62% — GREEN
Business-price: 6.83 — GREEN
Cash-flow price: 22.24 — ORANGE
Debt/equity: 2.21 — RED
The headline scanner earnings multiple of 47.6x makes the stock look expensive, but I wouldn't use that metric in isolation for Verallia given restructuring effects, depreciation and the capital-intensive nature of glass manufacturing.
I'd focus more on enterprise value versus normalized EBITDA and free cash flow.
Management expects about €700M of EBITDA and €220M of FCF in 2026, versus a share price that has fallen below €20.
That's where the valuation argument becomes more interesting.
Debt is still the major constraint
This isn't a pristine balance-sheet story.
Net leverage remains 2.6x EBITDA, despite the recent improvement.
S&P also downgraded Verallia from BBB- to BB+ in March 2026.
So cash flow can't simply be returned aggressively to shareholders.
A meaningful portion needs to support deleveraging and restructuring.
For me, this is probably the biggest reason the stock deserves a valuation discount compared with higher-quality industrial compounders.
The scanner's growth score needs context
The scanner gives:
Growth score: 2/4
Future profit growth: +99.16%
3Y profit growth: -35.95%
3Y sales growth: -0.2%
Advanced score: 11/13 — 85%
I would not take the 99% future-profit-growth number literally.
The actual fundamental thesis is much more modest.
Verallia doesn't need 100% earnings growth.
It needs:
stable volumes + restored margins + restructuring savings + stronger cash flow + lower leverage.
If that happens, earnings could recover sharply from a depressed base without requiring meaningful revenue growth.
Key technical levels
Immediate support: €18–19
Major support: €16–17
First resistance: €20.50–21
Next resistance: €23–24
Major rerating level: €27–28
2025 tender price: €28.30
The oscillator is already deeply oversold and beginning to turn.
What makes this setup particularly interesting is that the WT cross and synchronization are already there.
Unlike many of the WATCH setups I've covered recently, VRLA isn't waiting for momentum to turn.
It's waiting for the growth/fundamental component to justify the technical reversal.
My classification: RECOVERY WATCH
What interests me:
3/3 scanner score
100% entry quality
Confirmed WT cross
Synchronized bands
Active cycle
EBITDA stabilization
Improving free cash flow
Restructuring benefits coming through
€28.30 controlling-shareholder tender price
Shares now around €19
What keeps me cautious:
Weak organic growth
2.6x leverage
Margin recovery still incomplete
Capital-intensive business
Very small public float
No formal BUY event yet
This is therefore not a growth stock that suddenly became cheap.
It's a cyclical industrial where the market may be pricing in a much longer downturn than the latest operating numbers suggest.
Current verdict: GROWTH WATCH — technically close, fundamentally improving, but I want evidence that the EBITDA recovery can continue.
What would you do?
A) Start small around €19
B) Wait for the scanner to move from WATCH to BUY
C) Wait for a reclaim of €21
Master Buy Scanner V2
Not financial advice. FDJ United: The Jackpot Is Not the ThesisEURONEXT:FDJU has fallen from above €50 to roughly €22, leaving the stock more than 50% below its 2021 peak.
But FDJ today is no longer simply the French national lottery operator investors bought at the 2019 IPO.
After the acquisition and integration of Kindred, the company now combines French lottery, retail betting, Unibet, online gaming and international lottery operations. The share price has moved in the opposite direction while the business has become significantly larger.
And for the first time in a while, the Master Buy Scanner V2 is giving a genuinely strong long-term signal.
Master Buy Scanner V2 — Monthly
Score: 3/3
Action: BUY GROWTH
Decision: GROWTH BUY
BUY state: WAIT CLOSE
Entry quality: EXCELLENT — 100%
Setup maturity: EARLY
Position size: NORMAL 50%
Top recent: YES
WT cross: YES
Band 1: GREEN
Combined: GREEN 6/10
Bands synchronized: YES
Cycle: ACTIVE
WT1 / WT2: -52.06 / -51.07
This is one of the stronger configurations I've seen recently.
The bullish WT cross is confirmed, Band 1 has turned green, the bands are synchronized and the cycle is active — all while momentum remains near an extreme long-term oversold zone.
There is one important detail:
WAIT CLOSE.
The August monthly candle is still open. I would therefore treat this as a developing BUY rather than assume the signal is locked in already.
FDJ has become a very different company
The Kindred integration is now complete, giving FDJ United a significant European online betting and gaming business alongside its traditional French lottery franchise.
That diversification matters.
The French lottery remains the cash engine, but FDJ now has exposure to online gaming across multiple European markets through brands including Unibet.
The problem is that 2026 has exposed some weaknesses in that transformation.
H1 revenue fell 4.5% to €1.782B, while gross gaming revenue declined only 1.3%. The difference is largely explained by higher gaming taxation. Recurring EBITDA reached €404M, representing a still-solid 22.7% margin.
So this is not a collapse in underlying gambling activity.
It's partly a tax-and-mix problem.
The French lottery is weaker — but not structurally broken
French lottery GGR declined 2.1% in H1, partly because there were fewer large EuroMillions jackpot cycles and unusually hot weather reduced retail traffic.
Strip out those long EuroMillions cycles and lottery GGR actually increased 1%, while online lottery GGR grew 6%.
That distinction matters.
Lottery revenue can be surprisingly volatile depending on jackpot cycles even though the underlying franchise changes very little.
Management is also preparing a refresh of EuroMillions and Loto for 2027 alongside new instant games and further digital investment.
For me, that's a much healthier explanation for weakness than declining customer relevance.
Kindred is where the execution risk sits
The online betting and gaming division is less reassuring.
H1 GGR was stable at €702M, but revenue declined 7.4% to €431M.
However, excluding the UK and Netherlands:
GGR increased 6.6%
Revenue increased 0.6%
The Netherlands improved materially between Q1 and Q2, but the UK remains difficult and management does not expect its turnaround measures to begin producing results until late 2026.
That makes the investment case quite clear.
France isn't the main turnaround. Kindred is.
If management can stabilize the UK and Netherlands while the healthier markets continue growing, the earnings mix should improve considerably.
The biggest enemy is taxation
FDJ is operating in one of the most heavily regulated industries in Europe.
Gaming-tax increases already cost the company more than €50M in 2025, and management originally expected approximately another €90M of additional taxation in 2026.
This has progressively pressured guidance.
At the start of the year, management expected slight revenue growth. By July, guidance had moved to:
Stable GGR
Low-single-digit revenue decline
23–24% recurring EBITDA margin
That downward guidance progression is probably the most important fundamental reason not to become overly enthusiastic about the BUY signal.
The business is stabilizing. It is not yet accelerating.
But the cash generation is difficult to ignore
In 2025, FDJ United generated:
€902M recurring EBITDA
€782M free cash flow
87% EBITDA-to-FCF conversion
Adjusted net income of €487M
Net financial debt of €1.72B
That cash-generation profile is probably more useful than the scanner's headline earnings multiple.
The scanner currently shows:
Business-price: 6.65 — GREEN
Cash-flow price: 12.09 — GREEN
Earnings price: 173.87 — RED
That enormous discrepancy exists partly because reported earnings contain acquisition, integration, amortization and other accounting effects.
For example, 2025 reported net income was only €176M, versus €487M adjusted net income.
For FDJ, I therefore care more about:
adjusted earnings + EBITDA + free cash flow + leverage
than the headline GAAP P/E.
The dividend adds another layer
FDJ paid €2.10 per share for FY2025, up from €2.05, and management has committed to increasing the annual dividend based on a payout ratio of at least 75% of adjusted net income.
With the stock now around the low €20s, shareholder distributions have become a much more meaningful part of the investment case than when the stock traded near €40–50.
But the dividend ultimately depends on the company's ability to maintain cash generation while deleveraging after Kindred.
The scanner itself shows the trade-off
The interesting thing about FDJ is that this isn't a perfect quality setup.
Business quality: ORANGE — 1.5/3
Return on capital: 5.44%
Margin trend: -3.15% — RED
But:
Valuation: GREEN — 4.5/7
and:
Growth outlook: GREEN — 3/4
The advanced score is also unusually strong at 12/13 — 92%.
So the scanner's thesis isn't:
“This is currently an exceptional business.”
It's closer to:
“The price has reset enough that improving future conditions could create an asymmetric recovery.”
I think that's the right way to look at FDJ today.
Key technical levels
From the long-term chart:
Immediate support: €21–22
Major support: €19–20
First resistance: €24
Recovery zone: €26–28
Major resistance: €30–32
Structural recovery: €35+
Previous highs: €48–50
The interesting part is that the BUY signal is forming almost directly on long-term support.
A confirmed monthly close with the scanner remaining 3/3 would make the €21–24 region particularly interesting.
My classification: GROWTH BUY — BUT LET THE MONTH CLOSE
FDJ United now combines:
3/3 monthly BUY
100% entry quality
Confirmed WT cross
Green Band 1
Synchronized bands
Active cycle
Strong free cash generation
Attractive adjusted valuation
Large dividend distribution
Potential Kindred turnaround
Against:
Falling 2026 revenue
Higher gaming taxes
UK weakness
Netherlands regulatory pressure
Higher post-Kindred leverage
Weak current margin trend
This is therefore not a simple rebound trade in the old Française des Jeux.
It's a bet that the market is valuing FDJ like a stagnating French lottery operator while the company is gradually becoming a more diversified European gaming platform.
Current verdict: GROWTH BUY — 50% position if the monthly signal confirms.
What would you do?
A) Start around €22
B) Wait for the August monthly close
C) Wait for a reclaim of €24–25
Not financial advice.  Long
Long
 Long
Long
Assassin’s Creed Could Be Ubisoft’s Comeback Weapon Ubisoft is getting another chance to prove that its biggest franchises still have value
Assassin’s Creed Black Flag Resynced, a full remake of the 2013 pirate adventure, launched on July 9. The original title reached more than 34 million unique players, making it one of Ubisoft’s most successful releases
The strategy is clear, follow the path of Capcom and bring back proven franchises through high quality remakes.. Remakes are attractive because they come with lower development risk, established audiences, and more predictable commercial outcomes. Ubisoft CEO Yves Guillemot has already confirmed that multiple Assassin’s Creed remakes are in development
The timing is interesting because the market is valuing Ubisoft as if the company is heading toward a major crisis. Its enterprise value is around €1.2 billion, despite generating nearly €2 billion in average annual net bookings. Even a 3x valuation multiple would only bring Ubisoft closer to the level of struggling publisher Square Enix
The current valuation suggests investors are pricing Ubisoft like a company slowly being dismantled rather than one facing temporary execution problems. Around 14% of Ubisoft shares on Euronext Paris are short, showing that many investors are still betting against a recovery
So what is really happening inside Ubisoft?
A New Structure and Fresh Capital
In January, Ubisoft reorganized its business into five Creative Houses, moving away from its previous centralized structure. The most valuable assets ended up inside Vantage Studios, which controls major franchises including Assassin’s Creed, Far Cry, and Rainbow6
The remaining studios are focused on different parts of the portfolio, including multiplayer franchises like Ghost Recon and The Division, live service games such as The Crew, and family-oriented brands like Rayman
Tencent invested €1.2 billion into Vantage Studios in November 2025, receiving a 26% economic stake while Ubisoft maintained control and continued consolidating the studio’s results. The investment valued Vantage Studios at a €3.8 billion enterprise value before the deal
That valuation is important because it suggests Tencent sees more value in Ubisoft’s core franchises than the public market currently assigns to the entire company. However, Ubisoft’s ownership structure, the Guillemot family’s control, and Tencent’s right of first refusal make a full acquisition unlikely
The investment also strengthened Ubisoft’s balance sheet. At the end of FY26, the company had €1.3 billion in cash and adjusted net debt of only €200 million, a major improvement from the financial pressure investors feared a year earlier
However, the pressure has not disappeared. Ubisoft faces roughly €500 million in bond repayments in November, followed by another €700 million in late 2027. Those obligations could consume most of its current cash reserves before the upcoming game pipeline has time to generate meaningful free cash flow
The company’s future depends heavily on refinancing and execution
The Back Catalog Is Doing the Heavy Lifting
Ubisoft’s older games are currently carrying the business
In FY26, its back catalog generated €1.3 billion in net bookings, while new releases contributed only around €200 million. That means roughly 84% of Ubisoft’s revenue came from games released in previous years
This highlights the strength of Ubisoft’s intellectual property. Assassin’s Creed, Rainbow Six, Far Cry, and other franchises continue generating revenue long after launch. The shift toward digital gaming also helps because there is no used-game market reducing the long-term value of older titles.
The challenge is not whether Ubisoft has valuable franchises. The challenge is whether it can consistently create new hits
A Recovery Depends on the Pipeline
Ubisoft’s recent performance shows the problem:
-FY24: Net bookings reached €2.3 billion, helped by Assassin’s Creed Mirage, The Crew Motorfest, and strong catalog sales
-FY26: Net bookings dropped to €1.5 billion as the company lacked major new releases
-FY27: Management expects another decline, with net bookings estimated around €1.4 billion
Black Flag Resynced is the biggest release in the near term, but expectations are extremely low. That creates an opportunity. The game does not need to become a record breaking blockbuster to improve investor sentiment. A solid performance alone could remind the market that Ubisoft’s franchises still have value
The timing could also help, with an Assassin’s Creed Netflix adaptation expected in the coming months potentially bringing more attention to the brand
The bigger test comes later. Ubisoft expects FY28 and FY29 to bring a stronger lineup, including Assassin’s Creed Hexe, Far Cry 7, and a new Ghost Recon title. If those games perform well, bookings could move back toward the €2 billion range
The biggest risk is delays! Ubisoft has a long history of postponements, and another wave of delays could create a serious cash flow problem
The Cash Burn Problem
Ubisoft’s biggest weakness remains free cash flow
The company has reported negative free cash flow in four of the last five fiscal years, including:
- FY24: approximately -€500 million
- FY26: approximately -€400 million
Management expects FY27 free cash flow usage to remain below €500 million, but that does not leave much room for mistakes
The positive scenario is that Ubisoft expects cumulative free cash flow to turn positive between FY27 and FY29. That would significantly improve its financial position, but it depends entirely on the upcoming games actually launching and performing
The company has already started reducing expenses. Fixed costs declined from €1.75 billion in FY23 to €1.44 billion in FY26, with a target of €1.25 billion by FY28. Ubisoft has also reduced its workforce from around 20,000 employees to roughly 16,000.
The smaller cost base lowers the break even point, but it does not fix everything. Ubisoft still needs successful games to generate enough revenue
Why Investors Should Pay Attention
The market is pricing in a serious solvency risk
Investors are not only worried about weak games. They are worried Ubisoft may need to raise capital if cash flow does not improve, which could lead to dilution. The catalog provides stability, but the company has little room for another major disappointment
The upside could be significant if cash flow returns
A valuation below 1x annual bookings only makes sense if investors believe Ubisoft’s franchises are losing value. However, the company’s back catalog has remained surprisingly strong, generating more than €1 billion annually. The bar for improvement is relatively low
Tencent has already assigned value to Ubisoft’s best assets
The Vantage Studios deal valued the company’s core franchises at €3.8 billion, far above Ubisoft’s current market valuation. That does not guarantee success, but it shows strategic buyers see long-term value.
Ubisoft still has reputation problems
The company has dealt with workplace controversies, game quality issues, delays, cancellations, and criticism over leadership structure. The Guillemot family maintaining tight control remains a point of debate among investors
Ubisoft does not need a miracle. The company still owns some of gaming’s strongest franchises, its back catalog generates over €1 billion annually, and its cost structure is finally moving in the right direction
But the next few years will decide everything. Ubisoft needs to successfully launch its upcoming games, stabilize free cash flow, and prove that its smaller organization can generate consistent profits.
At around 0.6x average net bookings, the market is pricing Ubisoft as if the recovery will fail. After years of delays and disappointing launches, investors are not buying the story anymore.. They want proof
For Ubisoft, the next major release is not just another game launch, It is a test of whether one of gaming’s biggest publishers can rebuild trust
 Long
Long
Buy Candidate: Thales SAIdea sourced via technical screener.
Thales (Euronext Paris: HO) is a global leader in advanced technologies for the Defence, Aerospace, and Cyber & Digital sectors. Its portfolio of innovative products and services addresses several major challenges: sovereignty, security, sustainability and inclusion.
The Group invests more than €4 billion per year in Research & Development in key areas, particularly for critical environments, such as Artificial Intelligence, cybersecurity, quantum and cloud technologies.
Thales has more than 83,000 employees in 68 countries. In 2024, the Group generated sales of €20.6 billion.
Strategy: Re-emerging momentum within a base.  Long
Long
Legrand, an “AI” stock that is still cheap?The Legrand stock, a French company listed on the Paris Stock Exchange, is following a strong long-term bullish trend in the equity markets. The company is a pure specialist in building electrical infrastructure and has made a massive strategic shift in recent years toward AI data centers and digital infrastructure in general.
This transformation has enabled Legrand to reach record operating margins and achieve excellent current and future profitability.
So one question arises: is it still time to buy Legrand shares?
Legrand is currently benefiting from an extremely favorable structural trend: the explosion of electricity demand linked to the global digital transformation. The development of generative artificial intelligence is driving spectacular growth in investments in data centers, which require increasingly efficient, secure, and resilient electrical infrastructures.
The French group is particularly well positioned in this market thanks to its low-voltage electrical distribution solutions, cabling systems, equipment for computer rooms, and smart building management solutions. This exposure to data centers is gradually bringing Legrand closer to the artificial intelligence theme, even though the company does not directly manufacture AI chips or software.
The quality of Legrand’s business model is also based on strong innovation capabilities, a portfolio of globally recognized brands, and a targeted acquisition strategy that regularly expands its technological offering.
The table below compares LEGRAND shares with its European competitors based on the forward P/E valuation criterion. LEGRAND stock is the cheapest of all and has strong earnings growth prospects thanks to AI data centers.
Regarding valuation, Legrand remains cheaper than several major European competitors exposed to the same electrification and digitalization trends. With a forward price-to-earnings ratio of around 20 times expected earnings, the stock can still be considered inexpensive within its sector.
The chart below displays weekly Japanese candlesticks for LEGRAND shares together with stock market valuation ratios: forward P/E, P/E ratio, and Price-to-Sales. A forward P/E of 20 can be considered reasonable in the AI sector (here, data centers).
With a strategic position at the heart of the energy and digital revolution, Legrand could therefore remain one of the most attractive European companies to indirectly benefit from the development of artificial intelligence.
The chart below represents the same data as the previous chart but adds the Ichimoku system. You can observe that the weekly Ichimoku cloud is acting as support.
DISCLAIMER:
This content is intended for individuals who are familiar with financial markets and instruments and is for information purposes only. The presented idea (including market commentary, market data and observations) is not a work product of any research department of Swissquote or its affiliates. This material is intended to highlight market action and does not constitute investment, legal or tax advice. If you are a retail investor or lack experience in trading complex financial products, it is advisable to seek professional advice from licensed advisor before making any financial decisions.
This content is not intended to manipulate the market or encourage any specific financial behavior.
Swissquote makes no representation or warranty as to the quality, completeness, accuracy, comprehensiveness or non-infringement of such content. The views expressed are those of the consultant and are provided for educational purposes only. Any information provided relating to a product or market should not be construed as recommending an investment strategy or transaction. Past performance is not a guarantee of future results.
Swissquote and its employees and representatives shall in no event be held liable for any damages or losses arising directly or indirectly from decisions made on the basis of this content.
The use of any third-party brands or trademarks is for information only and does not imply endorsement by Swissquote, or that the trademark owner has authorised Swissquote to promote its products or services.
Swissquote is the marketing brand for the activities of Swissquote Bank Ltd (Switzerland) regulated by FINMA, Swissquote Capital Markets Limited regulated by CySEC (Cyprus), Swissquote Bank Europe SA (Luxembourg) regulated by the CSSF, Swissquote Ltd (UK) regulated by the FCA, Swissquote Financial Services (Malta) Ltd regulated by the Malta Financial Services Authority, Swissquote MEA Ltd. (UAE) regulated by the Dubai Financial Services Authority, Swissquote Pte Ltd (Singapore) regulated by the Monetary Authority of Singapore, Swissquote Asia Limited (Hong Kong) licensed by the Hong Kong Securities and Futures Commission (SFC) and Swissquote South Africa (Pty) Ltd supervised by the FSCA.
Products and services of Swissquote are only intended for those permitted to receive them under local law.
All investments carry a degree of risk. The risk of loss in trading or holding financial instruments can be substantial. The value of financial instruments, including but not limited to stocks, bonds, cryptocurrencies, and other assets, can fluctuate both upwards and downwards. There is a significant risk of financial loss when buying, selling, holding, staking, or investing in these instruments. SQBE makes no recommendations regarding any specific investment, transaction, or the use of any particular investment strategy.
CFDs are complex instruments and come with a high risk of losing money rapidly due to leverage. The vast majority of retail client accounts suffer capital losses when trading in CFDs. You should consider whether you understand how CFDs work and whether you can afford to take the high risk of losing your money.
Digital Assets are unregulated in most countries and consumer protection rules may not apply. As highly volatile speculative investments, Digital Assets are not suitable for investors without a high-risk tolerance. Make sure you understand each Digital Asset before you trade.
Cryptocurrencies are not considered legal tender in some jurisdictions and are subject to regulatory uncertainties.
The use of Internet-based systems can involve high risks, including, but not limited to, fraud, cyber-attacks, network and communication failures, as well as identity theft and phishing attacks related to crypto-assets.
MC - Support in Focus Within the Broader Downtrend!MC (LVMH Moët Hennessy Louis Vuitton SE) is the world's largest luxury goods company, with a portfolio of globally recognized brands across fashion, jewelry, cosmetics, wines, and spirits. The stock is widely followed as a benchmark for the global luxury sector.
From a technical perspective, MC remains overall bearish, continuing to trade inside the red descending channel. Price is now testing a major support area that has produced multiple bullish reactions in recent months, making it an important technical region to monitor. At the same time, a developing bullish divergence is adding more confluence to the bullish scenario and may serve as an early indication that bearish momentum is beginning to weaken.
⭕As long as this support area continues to hold, we can start looking for buy setups on lower timeframes, targeting a medium-term recovery toward the upper boundary of the descending channel as a corrective move within the broader bearish trend.
⭕From a longer-term perspective, buyers would need to break above both the red descending channel and the last major high, highlighted by the green trigger area, to provide the first major indication that momentum is shifting from bearish to bullish.
The reaction around this support zone may reveal whether buyers can develop another corrective rally, or if sellers have other plans.
⚠️ Disclaimer: This analysis reflects my personal market view and is not financial advice.
Rayan Nasser
#MC #LVMH #Stocks #Luxury #TechnicalAnalysis #PriceAction #Investing #MarketStructure Long 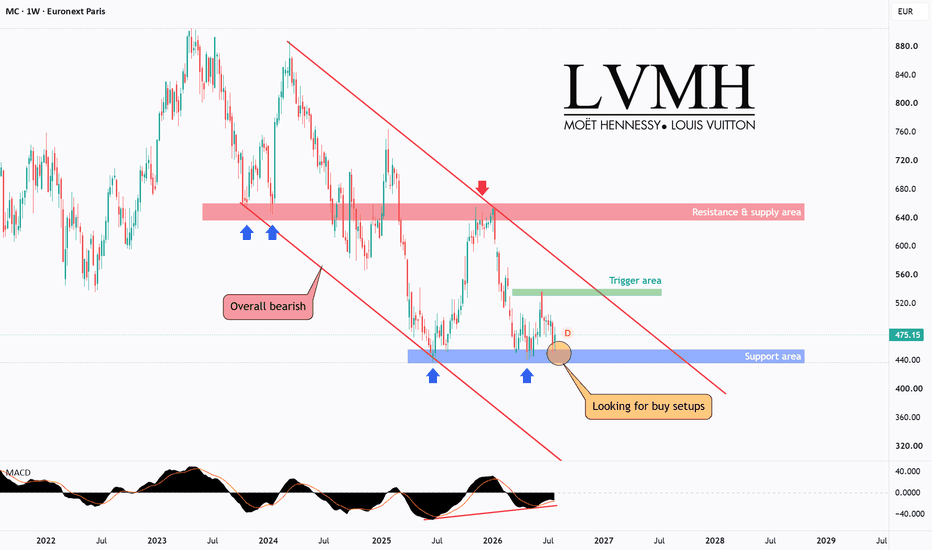
Rémy Cointreau: Cognac Is Waking Up AgainRémy Cointreau ( EURONEXT:RCO ) has suffered a brutal valuation reset.
After peaking above €200 in 2021, the stock collapsed toward €40 before beginning to stabilize around €48–50.
My Master Buy Scanner V2 now gives the technical setup a full 3/3 score—but the final decision remains GROWTH WATCH rather than BUY.
That distinction is important.
Momentum is improving and the latest sales report contains encouraging signs. However, margins, earnings and cash generation remain far below their previous levels.
THE SCANNER’S MESSAGE
The two-month setup currently shows:
• Technical score: 3/3
• Action: WATCH
• Decision: GROWTH WATCH
• Buy state: NO EVENT
• Entry quality: GOOD — 75%
• Setup maturity: CONFIRM
• Model position size: NONE — 0%
• Combined technical reading: GREEN — 7/10
• Technical cycle: ACTIVE
The momentum cross has appeared, the bands are synchronized and the recovery has been confirmed.
But there is still no formal buy event.
The scanner is effectively saying:
“The recovery may be starting—but the growth thesis needs more evidence.”
THE LATEST RESULTS ARE ENCOURAGING
Rémy Cointreau’s first-quarter 2026–27 sales reached €223.2 million:
• Organic sales growth: +1.3%
• Reported sales growth: +1.1%
• Cognac organic growth: +7.7%
• Liqueurs & Spirits organic growth: -6.6%
Cognac delivered the most important improvement.
Sales grew strongly across Asia outside China, while the United States showed solid growth and a sequential improvement in consumer sell-through. China remained difficult, but the decline was limited and in line with management’s expectations.
Rémy Martin also recorded more than 12% sales growth during China’s 6.18 e-commerce festival.
The weaker Liqueurs & Spirits performance was partly attributed to shipment timing. Management said underlying consumption trends remained positive across Cointreau, The Botanist, Bruichladdich and Mount Gay. (news.remy-cointreau.com)
This is not yet a complete recovery—but it is considerably better than another quarter of broad-based contraction.
WHY THE SCANNER STILL DISTRUSTS GROWTH
The scanner’s growth outlook remains RED:
• Growth score: 0.5/4 — 13%
• Expected profit growth: 6.58%
• Estimate trend: -32.33%
• Three-year profit growth: -35.89%
• Three-year sales growth: -15.47%
These figures are backward-looking and therefore do not fully reflect the latest Cognac rebound.
However, they accurately show the damage inflicted during the downturn.
For the full 2025–26 financial year:
• Sales: €935.3 million
• Organic sales growth: +0.2%
• Reported sales decline: -5.0%
• Current operating profit: €165.4 million, down 23.8%
• Operating margin: 17.7%, down from 22.0%
• Net profit: €78.7 million, down 35.1%
• EPS: €1.51, down 36%
Gross margin fell from 70.6% to 65.8%, affected by tariffs, unfavorable price mix, production costs and currency movements. (news.remy-cointreau.com)
One positive quarter cannot erase that deterioration.
VALUATION IS NOT YET OBVIOUSLY CHEAP
The scanner rates valuation and debt ORANGE:
• Value score: 3.5/7
• Cash yield: 2.09%
• Business-price multiple: 13.52x
• Cash-flow multiple: 65.12x
• Earnings multiple: 32.33x
The share price is dramatically below its former peak, but that does not automatically make the stock inexpensive.
At approximately €48–50, Rémy Cointreau still trades at more than 30 times the scanner’s current earnings figure. Free cash flow was only €8 million in 2025–26, despite better working-capital management.
Net debt reached €690.4 million, while net debt to EBITDA increased from 2.40x to 3.22x.
The balance sheet is manageable, but it reduces flexibility. Management intends to keep leverage below 3.5x during 2026–27.
The dividend was also reduced from €1.50 to €0.75 per share. At the current share price, that represents a yield of only around 1.5%—not enough to compensate investors if the recovery fails.
THE TURNAROUND PLAN
Management has launched RC Forward, a transformation programme targeting approximately €100 million of value creation by 2028–29.
Its priorities include:
• Rebuilding momentum in the United States and China
• Accelerating non-Cognac brands
• Expanding emerging-market sales
• Recovering Travel Retail
• Reducing overhead costs
• Protecting brand investment
• Improving operational efficiency and cash generation
The group expects a return to sustainable organic sales growth in 2026–27 and a slight organic improvement in operating margin.
However, customs duties are expected to cost approximately €20 million, while currency movements could reduce annual sales by around €15 million and operating profit by €5–8 million.
The recovery must therefore overcome meaningful external pressure.
THE TECHNICAL SETUP
The chart is attempting to establish a long-term bottom after a decline of roughly 75% from its peak.
Key levels I am watching:
• €43–46: immediate support and potential accumulation zone
• €38–40: major structural support
• €50–55: first confirmation zone
• €60–65: next important resistance
• €75–80: major long-term recovery level
The current rebound above €48 is constructive, but the €50–55 area remains the first real test.
A confirmed close above €55 followed by a successful retest would indicate that the market is beginning to price in a genuine earnings recovery.
A failure below €43 would weaken the setup. A sustained loss of €38–40 would suggest that the bottoming process has failed.
THE BULL CASE
• Cognac returned to organic growth
• US consumption trends are improving
• Rémy Martin continues gaining traction in Asia
• China’s decline is becoming more controlled
• Strong portfolio of premium global brands
• Technical recovery confirmed from oversold levels
• RC Forward could improve costs and cash generation
• Expectations are far lower than at the 2021 peak
THE BEAR CASE
• Profit and EPS remain sharply below previous levels
• Margins have contracted significantly
• Free cash flow remains weak
• Leverage has increased
• Liqueurs & Spirits sales declined in Q1
• China and European demand remain uncertain
• Tariffs and currency movements create additional pressure
• Valuation is not especially low relative to current earnings
• There is still no formal scanner buy event
MY CURRENT FRAMEWORK
I would treat Rémy Cointreau as an improving recovery watch—not yet as a confirmed growth investment.
My framework would be:
• Avoid chasing the first rebound
• Watch whether €43–46 holds on a pullback
• Consider a starter only after a confirmed break above €50–55
• Increase conviction if Cognac growth continues and margins stabilize
• Monitor leverage and free-cash-flow recovery
• Reassess the technical thesis below €38–40
The latest quarter suggests that the business may finally be turning.
But for the scanner to move from GROWTH WATCH to BUY, Rémy Cointreau must prove that stronger Cognac sales can translate into improving earnings, margins and cash flow.
TRY THE SCANNER
Master Buy Scanner V2 distinguishes between a potential growth recovery and a fully confirmed investment setup.
Add it to your TradingView charts here:
THE QUESTION
At approximately €50, what matters most?
A — Cognac’s return to growth
B — Confirmation above €55
C — Margin and cash-flow recovery
D — Avoid because the valuation remains too high
Comment A, B, C or D—and share your Rémy Cointreau thesis.
This is not financial advice. Always conduct your own research and manage risk according to your investment horizon.
 Long
Long
Wolters Kluwer: AI Fears Crushed Valuation. BUY Signal Has FiredWolters Kluwer ( EURONEXT:WKL ) has delivered remarkably consistent revenue, margin, earnings and cash-flow growth for years.
Yet its shares have collapsed by approximately 60% from their peak as investors question whether generative AI will strengthen its professional-information platforms—or eventually replace them.
The monthly chart remains cautious, but the faster three-week timeframe has now generated a full 3/3 BUY signal.
That multi-timeframe distinction is central to this setup.
THE THREE-WEEK BUY SIGNAL
Master Buy Scanner V2 currently shows:
• Overall signal: BUY — 3/3
• Signal timeframe: 3W → 1M/3W
• Timeframe confidence: 3W FALLBACK
• Action: BUY / BUILD
• Decision: INVEST
• Buy state: QUALITY ACTIVE
• Entry quality: EXCELLENT — 90%
• Setup maturity: QUALITY
• Model position size: FULL — 100%
• Technical cycle: FIRED
• Bars since BUY: 1
• Combined signal: GREEN — 8/10
The advanced layer is even stronger:
• Advanced score: 14/14 — 100%
• Lifecycle: CONFIRM
• Conviction: A — 92%
• Recovery: CONFIRMED
• False-bottom test: OK
• Value-trap test: OK
• Relative strength: +15.45% — OK
• Volume: ACCUMULATION
• Failure warning: NO
This is materially different from the monthly view, which still says WAIT because its slower oscillator has not completed a bullish cross.
That is not necessarily a contradiction.
The three-week signal is identifying an earlier entry, while the monthly timeframe still requires more evidence before confirming a full long-term trend reversal.
AN EXCEPTIONAL BUSINESS
Wolters Kluwer provides information, software and workflow solutions to healthcare, legal, tax, accounting and compliance professionals.
These are critical areas where accuracy, regulatory expertise and trusted data matter. Replacing an established system can create operational, legal and financial risk for customers.
The scanner gives business quality a perfect score:
• Quality score: 3/3 — 100%
• Return on capital: 25.65%
• Margin trend: positive
• Profitability and cash generation: GREEN
The latest operating performance also remains strong.
During Q1 2026:
• Revenue grew 5% organically
• Recurring revenue grew 7% organically
• Recurring products represented 85% of total revenue
• Cloud software revenue grew 14% organically
• Adjusted operating profit increased 11% at constant currencies
• Adjusted free cash flow increased 15% at constant currencies
Those are not the results of a company currently experiencing fundamental collapse.
Management also reiterated its 2026 outlook:
• Adjusted operating margin: approximately 28%
• Adjusted free cash flow: €1.30–1.35 billion
• Return on invested capital: 18–19%
• Adjusted EPS growth: high single digits at constant currencies
THE AI DEBATE
The bear case is easy to understand.
General-purpose AI agents are becoming capable of automating legal research, tax preparation, compliance analysis and clinical decision support.
If customers can obtain comparable answers without paying for specialized platforms, Wolters Kluwer could eventually face:
• Slower subscription growth
• Pricing pressure
• Lower switching costs
• Higher development spending
• Margin compression
However, Wolters Kluwer is not simply defending a declining publishing model.
Approximately 70% of its digital revenue already comes from AI-powered solutions. The company is increasing product-development spending to 12–13% of revenue and embedding generative and agentic AI across its platforms.
More than half of its US enterprise healthcare customers had signed up to adopt UpToDate Expert AI by the end of April. Its CCH Axcess agentic AI modules are also seeing early adoption among accounting firms.
The real question is therefore:
Does AI commoditize Wolters Kluwer’s information—or make its trusted data, professional expertise and embedded workflows even more valuable?
THE VALUATION RESET
The scanner now rates valuation and debt GREEN:
• Valuation score: 6.5/7 — 93%
• Cash yield: approximately 9.9%
• Earnings multiple: approximately 12.8x
• Current profit per share: €5.64
• Debt-to-equity: 1.66 — ORANGE
A recurring-revenue company with rising margins, strong free cash flow and a return on capital above 25% would historically command a significantly higher multiple.
However, the market is no longer valuing WKL on its historical execution. It is pricing uncertainty about the durability of its moat.
The scanner reflects this tension:
• Three-year profit growth: 12.01% — GREEN
• Three-year sales growth: 3.95% — ORANGE
• Future profit growth: -6.63% — RED
The historical business remains exceptional. Future expectations have been dramatically reset.
THE TECHNICAL SETUP
After falling from approximately €180, WKL tested the €55–60 area before rebounding toward €72.
The three-week oscillator has now completed a bullish turn from deeply oversold territory. The WT cross is confirmed, the bands are synchronized and accumulation volume is present.
Key levels I am watching:
• €65–66: immediate pivot and pullback zone
• €55–60: major structural support and invalidation area
• €72–75: first resistance and breakout test
• €85–90: stronger recovery confirmation
• €100–110: major long-term resistance
A sustained three-week close above €72–75 would reinforce the BUY signal.
A constructive pullback that holds €65 could also provide a more favorable entry than chasing the first rebound.
The slower monthly chart would likely need additional recovery before generating its own BUY signal.
THE BULL CASE
• Fresh 3/3 BUY signal on the three-week timeframe
• Entry quality rated EXCELLENT at 90%
• Advanced confirmation score of 14/14
• 85% recurring revenue
• 14% organic cloud growth
• 25.65% scanner return on capital
• Rising operating margins
• Strong free-cash-flow generation
• Trusted proprietary professional content
• Early adoption of Wolters Kluwer’s own AI products
• Major valuation reset
THE BEAR CASE
• The monthly timeframe has not confirmed the reversal
• AI agents may commoditize some professional information
• Customers could develop competing internal tools
• Product-development spending is increasing
• Future-profit expectations remain negative
• Debt is higher than for several previous scanner setups
• The first rebound has already been sharp
• Losing €55–60 would invalidate the emerging base
MY CURRENT FRAMEWORK
I would treat WKL as a confirmed three-week BUY—but still distinguish it from a confirmed monthly reversal.
My approach would be:
• Consider an initial position in the €65–72 area
• Prefer a controlled pullback over chasing a vertical rebound
• Add if €65 becomes established support
• Increase conviction after a confirmed close above €75
• Look for the monthly signal to confirm above €85–90
• Reassess the thesis below €55–60
• Monitor the August 5 half-year results closely
The scanner’s 100% model position size reflects the strength of the detected setup. It should not automatically be interpreted as a recommendation to deploy an entire personal position immediately, particularly before earnings.
TRY THE SCANNER
This WKL example shows why Master Buy Scanner V2 uses multiple timeframes.
The monthly chart still says WAIT, but the three-week timing layer has already identified a high-quality BUY with improving momentum, accumulation and strong fundamental support.
Add the indicator to your TradingView charts here:
Run it across your watchlist and share the next ticker you want analyzed.
THE QUESTION
How would you approach Wolters Kluwer?
A — Start building after the three-week BUY signal
B — Wait for a pullback toward €65
C — Wait for monthly confirmation above €75–90
D — Avoid because AI could permanently weaken the moat
Comment A, B, C or D—and share your WKL thesis.
This is not financial advice. Always conduct your own research and manage risk according to your investment horizon.
 Long
Long
 Long
Long
LVMH: Arnault seeks stability as luxury faces challengesBy Ion Jauregui – Analyst at ActivTrades
Bernard Arnault, Chairman and CEO of LVMH, has rejected speculation about an alleged succession battle among his five children over control of the world’s largest luxury conglomerate.
The message aims to reinforce the group’s stability at a time when investors are focusing their attention on business performance. The main challenge for LVMH will be to preserve the value of its brands, protect its margins and restore growth in an environment of weaker luxury consumption momentum.
A model based on unique brands
LVMH’s success is based on a portfolio of brands with strong global positioning. Louis Vuitton remains one of the group’s main growth drivers, alongside brands such as Christian Dior, Tiffany & Co., Bulgari, Celine, Loewe and Fendi.
Arnault’s strategy has consisted of acquiring historic brands and providing them with global resources while preserving their identity. Control over distribution, investment in design and product exclusivity have allowed the group to maintain strong pricing power. However, the sector is undergoing a normalisation phase after the strong growth experienced following the pandemic. The slowdown in Chinese consumption and greater buyer caution have reduced the pace of expansion, particularly in some fashion categories.
Fundamental analysis: business quality in an adjustment phase
LVMH maintains one of the strongest competitive positions in the luxury sector. The group closed 2025 with revenues close to €80 billion and a recurring operating margin of around 25%, reflecting the strength of its brands and its pricing power.
The Fashion & Leather Goods division, driven by Louis Vuitton and Dior, continues to be the main profit engine, although it is also the most exposed to the slowdown in consumption, particularly in China.
The group maintains a solid financial structure, with strong cash generation and the ability to continue investing in its brands. However, the market has lowered its expectations after several years of strong growth and is demanding new signs of recovery in sales and margins.
The main catalysts will be the evolution of Asian consumption, the recovery of Louis Vuitton and Dior, and the group’s ability to maintain the distinctive value of its brands.
Technical analysis: bearish trend and consolidation
LVMH shares remain in a long-term bearish trend following the formation of a head-and-shoulders pattern between July 2022 and July 2024.
The share price reached a high of €904.6 per share in 2023, subsequently beginning a correction with lower highs at €886.4, €762.7 and €654.3, the latter recorded in January.
The stock found support around the €436.55 area, a level tested in June 2025 and again in May 2026. Since then, the share price has entered a sideways phase, trading around €478.80.
The technical structure remains negative. The moving average crossover confirms the bearish trend, while the recent expansion between them reflects the persistence of selling pressure.
The Point of Control (POC) is located around €616.8, a level that could act as a significant resistance zone in a potential recovery. The MACD shows gradual improvement, although it remains in negative territory.
The RSI stands at 45.38%, within a neutral zone with still-weak momentum, although far from oversold levels.
LVMH continues to hold value
LVMH continues to maintain one of the most valuable collections of brands in the world, but the market requires new growth signals before confirming a sustained recovery.
The family succession will remain relevant in the long term, although the share price performance will depend mainly on the group’s operational ability to restore growth, maintain margins and preserve the exclusivity that supports the value of its brands.
*******************************************************************************************
The information provided does not constitute investment research. The material has not been prepared in accordance with the legal requirements designed to promote the independence of investment research and such should be considered a marketing communication.
All information has been prepared by ActivTrades ("AT"). The information does not contain a record of AT's prices, or an offer of or solicitation for a transaction in any financial instrument. No representation or warranty is given as to the accuracy or completeness of this information.
Any material provided does not have regard to the specific investment objective and financial situation of any person who may receive it. Past performance and forecasting are not a synonym of a reliable indicator of future performance. AT provides an execution-only service. Consequently, any person acting on the information provided does so at their own risk. Political risk is unpredictable. Central bank actions can vary. Platform tools do not guarantee success.
Interparfums: Did the Market Stop Paying for Perfection?TITLE:
Interparfums: The Market Stopped Paying for Perfection—My Scanner Just Turned BUY
DESCRIPTION:
Interparfums ( AMEX:ITP ) was once priced like an unstoppable luxury-growth story. Since peaking above €50, the shares have fallen toward €25 as the fragrance market slowed, currencies turned unfavorable and several important brands lost momentum.
Yet the underlying business remains profitable—and my Master Buy Scanner V2 has now generated a fresh 3/3 BUY signal.
This is not a bet on an immediate return to rapid growth. It is a second-entry setup built on business quality, a normalized valuation and early technical recovery.
THE SIGNAL
The monthly scanner currently shows:
• Overall signal: BUY — 3/3
• Action: ADD / SECOND ENTRY
• Decision: INVEST
• Buy state: QUALITY ACTIVE
• Entry quality: EXCELLENT — 90%
• Setup maturity: QUALITY
• Technical cycle: FIRED
• Bars since BUY: 1
• Advanced score: 13/14 — 93%
The oscillator is also turning upward from a deeply oversold area. That suggests selling pressure may be exhausting, although it does not guarantee that the long-term downtrend is finished.
WHY THE BUSINESS STILL DESERVES ATTENTION
Interparfums develops and distributes fragrances for brands including Coach, Jimmy Choo, Montblanc, Lacoste, Rochas, Lanvin, Moncler and Van Cleef & Arpels.
Despite the current slowdown, the scanner still classifies business quality as GREEN:
• Quality score: 2.5/3 — 83%
• Return on capital: 15.46%
• Profitability: 17.74%
• Cash generation: 14.07%
• Margin trend: -0.76% — ORANGE
The latest operating data also show that the portfolio is not uniformly weak.
During the first half of 2026:
• Coach sales rose 3%, or 9.6% at constant exchange rates
• Jimmy Choo rose 1%, or 6.5% at constant exchange rates
• Montblanc declined 1%, but grew 3.4% at constant exchange rates
• The US subsidiary increased sales by 8% in dollars
• Interparfums continued gaining US market share
• Chinese sales increased strongly, while Asian activity rebounded in Q2
This resilience matters. It suggests that part of the reported decline comes from currencies, geographic disruption and uneven launch schedules—not simply collapsing demand for every brand.
THE SLOWDOWN IS REAL
First-half revenue still fell to €414.3 million:
• Down 7.3% at current exchange rates
• Down 3.7% at constant exchange rates
The weakest areas included:
• Lacoste: -21%
• Rochas: -12%
• Lanvin: -26%
• Western Europe: -17%
• Eastern Europe: -20%
• Middle East: -32%
Management now expects full-year sales between €850 million and €870 million, representing a moderate decline of approximately 3% at constant exchange rates.
This is why the scanner’s future-profit-growth reading remains RED at -2.05%, even though its three-year sales and profit-growth measures remain positive.
Interparfums is still a quality business—but it is currently between growth cycles.
THE VALUATION RESET
The clearest change is valuation.
The scanner now gives Interparfums a perfect 7/7 valuation and debt score:
• Cash yield: 5.83%
• Business-price multiple: 9.75x
• Cash-flow multiple: 15.53x
• Earnings multiple: 16.02x
• Debt-to-equity: 0.18
Those are far more reasonable levels than the premium valuation investors were willing to pay during the fragrance boom.
Interparfums also ended 2025 with a 19.5% operating margin and €63 million of net cash. Management expects the first-half 2026 operating margin to remain between 19% and 20% despite weaker sales.
In other words, revenue has slowed—but profitability has not collapsed.
THE NEXT POTENTIAL CATALYST
Management is preparing approximately 20 major initiatives across 2027 and 2028.
These include new franchises or important launches for Coach, Montblanc, Lacoste, Jimmy Choo and other portfolio brands.
The investment case therefore depends on whether Interparfums can navigate the current soft period without sacrificing margins—and then convert that launch pipeline into renewed organic growth.
The September 9 first-half results should provide an important update on profitability, cash flow and the durability of management’s guidance.
THE TECHNICAL SETUP
The shares are attempting to establish a base after falling from above €50 toward €21–22.
Key levels I am watching:
• €24–25: immediate pivot and second-entry zone
• €21–22: major structural support
• €27–28: first recovery confirmation
• €30–32: more meaningful trend improvement
• €34–36: major resistance from the previous breakdown
The technical cycle has fired, volume shows accumulation and the scanner marks recovery as CONFIRMED.
However, relative strength remains negative. A move above €27–28 would provide stronger evidence that the rebound is becoming a genuine trend reversal rather than another temporary bounce.
THE BULL CASE
• High-margin fragrance platform
• Strong portfolio of international brands
• 15.46% return on capital
• Excellent 7/7 valuation score
• Very low debt-to-equity
• Continued growth from Coach and Jimmy Choo
• US market-share gains
• Large 2027–2028 launch pipeline
• Technical recovery from deeply oversold conditions
THE BEAR CASE
• First-half sales are still declining
• Lacoste and Lanvin remain weak
• European and Middle Eastern demand is soft
• Currency movements are hurting reported results
• Near-term profit growth remains negative
• Relative strength has not recovered
• The licensing model depends on maintaining valuable brand relationships
• A break below €21–22 would seriously weaken the base
MY CURRENT FRAMEWORK
I would treat Interparfums as a quality second-entry setup—not as a confirmed momentum trade.
My framework would be:
• Consider exposure around the €24–25 pivot
• Keep initial sizing measured while relative strength remains weak
• Add conviction above €27–28
• Watch September’s results for margin and cash-flow confirmation
• Reassess the technical thesis below €21–22
The scanner displays a model position size of 100%, but that should be interpreted within each investor’s own portfolio construction and risk limits.
TRY THE SCANNER
Master Buy Scanner V2 separates technical timing, business quality, valuation, debt and growth instead of producing an unexplained BUY label.
Add it to your TradingView charts here:
Run it across your watchlist and share the next ticker you want analyzed.
THE QUESTION
How would you approach Interparfums near €25?
A — Begin or add to a position
B — Wait for a breakout above €28
C — Wait for the September results
D — Avoid until revenue growth returns
Comment A, B, C or D—and share your Interparfums thesis.
This is not financial advice. Always conduct your own research and manage risk according to your investment horizon.
 Long
Long
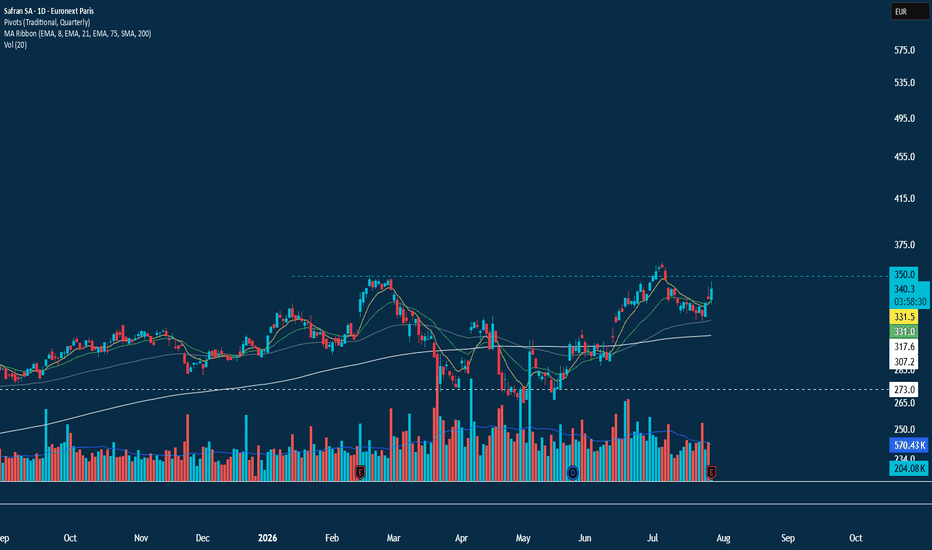
Buy Candidate: Safran (SAF)Idea sourced via technical screener.
Safran SA engages in the design, manufacture, and sale of aircraft, defense, and communication equipment and technologies. It operates through the following segments: Aerospace Propulsion, Aircraft Equipment, Defense, and Aerosystems, Aircraft Interiors. The Aerospace Propulsion segment designs, develops, produces, and markets propulsion and mechanical power transmission systems for commercial aircraft, military transport, training and combat aircraft, civil and military helicopters, and drones. The Aircraft Equipment, Defense, and Aerosystems segment covers the full life cycle of systems and equipment for civil and military aircraft and helicopters; and is involved in landing gear and brakes, nacelles and reversers, avionics, security systems, onboard computers, and fuel systems. The Aircraft Interiors segment engages in the manufacture of Cabin interiors for regional, medium-haul, long-haul, business and military aircraft. The Aircraft Interiors segment is composed of aircraft seats for passengers and crew, cabin equipment, overhead bins, class dividers, passenger service units, cabin interior solutions, chilling systems, galleys, electrical inserts and trolleys, and cargo equipment. The company was founded on August 16, 1924 and is headquartered in Paris, France.
Additional info: Record financial performance and upgraded outlook driven by strong aftermarket and defense  Long
Long