Groupe SEB Surges 16% — Turnaround Confirmed or Relief Rally?Groupe SEB ( CBOE:SK ) has collapsed from around €160 to below €45 as profitability, cash flow and growth weakened.
Following encouraging half-year results, the stock has rebounded to approximately €53—and my Master Buy Scanner V2 now shows a confirmed 3/3 BUY.
THE SIGNAL
• Overall signal: BUY — 3/3
• Action: ADD / SECOND ENTRY
• Decision: INVEST
• Buy state: SETUP READY
• Entry quality: EXCELLENT — 90%
• Setup maturity: CONFIRM
• Model position size: NORMAL — 50%
• Technical cycle: FIRED
• Bars since BUY: 2
• Combined technical reading: GREEN — 7/10
• Bands synchronized: YES
Unlike an early speculative signal, the technical indicators are synchronized. However, after a 16% monthly rebound, I would avoid blindly chasing the move.
WHY SEB CAUGHT MY ATTENTION
Groupe SEB owns a powerful portfolio of household and professional brands:
• Tefal
• Moulinex
• Rowenta
• Krups
• WMF
• All-Clad
• Supor
The company remains the global leader in small household equipment, but 2025 was difficult: organic sales barely grew, profitability declined and free cash flow weakened.
Management responded by launching the Rebound plan, targeting approximately €200 million of recurring annual savings by the end of 2027.
THE RECOVERY IS STARTING
First-half 2026 results showed measurable progress:
• Sales: €3.74 billion
• Organic growth: 1.7%
• Consumer growth: 2.3%
• Operating Result from Activity: €172 million, up 44%
• Operating margin: 4.6%, up from 3.2%
• Free cash flow: €53 million, versus -€213 million
• Structure costs reduced by approximately €25 million
North America grew 9.5% organically, including 15% growth during Q2, while China returned to slight growth.
However, the Professional division declined 2.8%, reflecting cautious investment by food-service customers.
THE ACCOUNTING WARNING
Reported net profit attributable to SEB was a loss of €124 million.
This was mainly caused by €178 million of exceptional charges related to the Rebound restructuring.
Excluding those charges, adjusted net profit was €41 million, compared with only €1 million one year earlier.
The operational recovery therefore appears stronger than reported earnings suggest—but the restructuring still has a genuine cash and execution cost.
VALUATION AND DEBT
The scanner shows:
• Business quality: GREEN — 67%
• Valuation and debt: ORANGE — 57%
• Business-price multiple: 6.28x — GREEN
• Earnings multiple: 24.52x — ORANGE
• Cash yield: 0.76% — RED
• Cash-flow multiple: 229x — RED
• Debt-to-equity: 0.78 — GREEN
• Growth outlook: RED
The weak cash-flow valuation reflects the poor recent cash-generation cycle. H1 improvement is encouraging, but one positive period does not yet prove normalization.
Official net financial debt stood at €2.52 billion, representing 2.8x adjusted EBITDA. Management aims to return leverage toward 2x by 2027.
The €2.80 annual dividend represents a yield of approximately 5.2% at the current price—but its long-term sustainability depends on cash flow continuing to recover.
THE MAIN RISKS
• Growth outlook remains RED
• Professional sales are declining
• Reported H1 earnings were negative
• Debt and financial costs remain meaningful
• Consumer demand and retailer inventories are uncertain
• Currency movements can materially affect results
• Part of the margin improvement came from tariff refunds and favorable currencies
• The Rebound plan still carries execution risk
THE TECHNICAL SETUP
Key areas I am watching:
• €50–52: immediate support
• €45–47: secondary accumulation zone
• €41–43: major structural support
• €57–60: first resistance
• €65–70: important confirmation zone
• €75–80: major recovery target
The technical setup is confirmed, but the stock is already testing its first resistance after a powerful monthly move.
I would consider partial exposure while €50 holds, then add after a convincing close above €57–60. Losing €45 would materially weaken the recovery thesis.
TRY THE SCANNER
SEB shows why a BUY signal needs context.
The technical setup is strong and business quality is positive—but valuation is mixed, cash generation remains weak and the growth outlook is RED.
Master Buy Scanner V2 combines these elements and distinguishes between QUALITY BUY, VALUE BUY, GROWTH WATCH, TACTICAL and NO BUY setups.
Add it to your TradingView charts here:
THE QUESTION
How would you approach Groupe SEB around €53?
A — Buy because the Rebound plan is already improving margins
B — Wait for confirmation above €57–60
C — Avoid because cash flow, debt and growth remain weak
Comment A, B or C—and share your SEB thesis.
This is not financial advice. Always conduct your own research and manage risk.
 Long
Long
Arkema at €55: Deep Value bef Earnings or a Chemical Value Trap?Arkema ( EURONEXT:AKE ) is trading near its lowest level since the pandemic, almost 60% below its 2022 peak.
The stock appears inexpensive, offers an indicated dividend yield of approximately 6.5% and is showing several positive monthly technical signals.
My Master Buy Scanner V2 even gives the technical setup a full 3/3 score and an 80% entry-quality rating.
Yet its final verdict is unambiguous:
NO BUY.
That apparent contradiction is exactly what makes Arkema interesting.
The technical conditions may be improving, but the scanner has not yet detected the fundamental recovery required to justify a position.
THE CURRENT SIGNAL
The monthly scanner shows:
• Overall verdict: NO BUY
• Technical score: 3/3
• Action: WAIT
• Decision: WAIT
• Buy state: NO EVENT
• Entry quality: EXCELLENT — 80%
• Setup maturity: CONFIRM
• Model position size: NONE — 0%
• Combined technical reading: GREEN — 8/10
• Bands synchronized: YES
• Technical cycle: ACTIVE
• Bars since last BUY: 206
Technically, many of the ingredients are present:
• Recent momentum turn
• Positive WaveTrend cross
• Green primary band
• Synchronized signals
• Attractive position on the long-term chart
However, there is still no formal BUY event.
The previous monthly BUY signal occurred during the 2009 crisis—206 bars ago. The current setup is improving, but the scanner refuses to anticipate a recovery that has not yet been confirmed.
WHY THE SCANNER IS BLOCKING THE TRADE
Master Buy Scanner V2 separates each opportunity into several layers:
• Technical timing
• Business quality
• Valuation and debt
• Growth outlook
• Recovery confirmation
• False-bottom and value-trap checks
For Arkema, the picture is divided:
• Technical setup: STRONG
• Entry quality: ATTRACTIVE
• Valuation: PARTLY ATTRACTIVE
• Business quality: WEAK
• Growth outlook: WEAK
• Recovery: NOT CONFIRMED
This is why the scanner recommends waiting despite the 3/3 technical score.
A cheap stock with positive momentum can still become cheaper if earnings and margins continue to deteriorate.
THE LATEST FUNDAMENTALS
Arkema’s first-quarter results remained under pressure:
• Sales: €2.182 billion, down 8.4%
• Volumes: down 0.2%
• Prices: down 3.0%
• Currency impact: negative 5.1%
• EBITDA: €283 million, down 14.0%
• EBITDA margin: 13.0%, down from 13.8%
• Recurring operating income: €118 million, down 26.3%
• Net income: €27 million, down 44.7%
• Adjusted net income: €65 million, down 34.4%
• Adjusted EPS: €0.86, down from €1.31
The business is not collapsing, but earnings are declining much faster than revenue.
That operating leverage works in both directions. If volumes and prices recover, profits could rebound sharply—but if weak conditions persist, margins may remain under pressure.
THE BUSINESS-QUALITY WARNING
The scanner rates Arkema’s current business quality RED:
• Quality score: 1/3 — 33%
• Return on capital: 0.36% — ORANGE
• Margin trend: -3.13% — RED
• Profitability: WEAK
• Cash generation: POSITIVE BUT LIMITED
The low return on capital and negative margin trend explain why the scanner will not classify Arkema as a QUALITY BUY.
Arkema has spent years transforming itself from a traditional chemical producer into a specialty-materials company.
Approximately 85% of 2025 sales came from Specialty Materials:
• Adhesive Solutions
• Advanced Materials
• Coating Solutions
However, the current financial performance still behaves like that of a highly cyclical chemicals group.
The strategic transformation is credible—but the market is waiting for the improved portfolio to produce more resilient margins and returns.
THE POSITIVE SIDE OF THE STORY
There are several reasons why the next recovery could be meaningful.
While overall volumes were almost flat, Arkema reported approximately 15% year-over-year volume growth in attractive markets including:
• Batteries
• Sports applications
• 3D printing
• Healthcare
• High-performance polymers
• New-generation fluorospecialties
Asia also continued to grow, while conditions in Europe and North America remained soft.
Arkema is investing in products linked to structural themes rather than purely traditional chemicals:
• PVDF materials for batteries
• Specialty polyamides
• Bio-based polymers
• Advanced adhesives
• Thermal-management and cooling materials
• Electronics and semiconductor applications
• Data-centre infrastructure
• Lightweight materials for transport
• Sustainable coatings
These businesses could eventually produce a better growth and margin profile than Arkema’s legacy portfolio.
THE GROWTH PROJECTS
Several recently completed projects are expected to contribute approximately €50 million of additional EBITDA in 2026.
They include:
• Expanded PVDF capacity for batteries
• New fluorospecialty capacity in the United States
• Increased DMDS production for renewable fuels and refining
• Tripled Rilsan Clear capacity in Singapore
• Additional high-performance polymer capacity in Asia and North America
Management expects these projects to support stronger momentum in Advanced Materials and High Performance Polymers.
Arkema also targets approximately €100 million of data-centre-related sales by 2030 through products used in:
• Building insulation and waterproofing
• Electronic-component protection
• Power cables and energy storage
• Cooling and air conditioning
• Chip thermal management
The long-term portfolio has attractive qualities. The unresolved question is how quickly these projects can compensate for weakness in traditional end markets.
THE VALUATION CASE
The valuation and debt section is GREEN, with a score of 4.5/7:
• Cash yield: 8.57%
• Business-price multiple: 6.6x
• Cash-flow multiple: 26.08x
• Earnings multiple: 103.11x
• Debt-to-equity: 0.82
• Current reported profit per share: €0.54
Arkema looks inexpensive relative to sales and enterprise value—but expensive relative to currently depressed earnings and cash flow.
This is an important distinction.
The 6.6x business-price multiple suggests that the market is pricing in substantial pessimism.
However, the earnings multiple above 100x shows that profitability has already fallen dramatically.
Arkema is only genuinely cheap if earnings recover.
Without that recovery, the low enterprise-value metrics could be misleading.
THE BALANCE SHEET
Arkema ended the first quarter with approximately €3.34 billion of net debt and hybrid bonds.
That represented around 2.8 times trailing EBITDA.
The balance sheet is manageable, but it reduces the company’s flexibility during a prolonged downturn.
Management is therefore focusing on:
• Strict working-capital management
• Controlling fixed costs
• Simplifying the organisation
• Reducing headcount by approximately 3% annually over three years
• Limiting 2026 capital expenditure to around €600 million
These measures should protect cash flow, but cost reductions alone will not create a durable recovery. Arkema ultimately needs better demand, pricing and product mix.
THE DIVIDEND
Arkema maintained its annual dividend at €3.60 per share for 2025.
At a share price of €55.35, that represents an indicated historical yield of approximately 6.5%.
The dividend has also grown considerably over the long term, from €0.70 in 2007 to €3.60.
However, the current yield should not be treated as risk-free income.
Arkema generated adjusted EPS of €4.34 in 2025, meaning the €3.60 dividend represented approximately 83% of adjusted earnings.
If profits recover, the dividend becomes more comfortable. If earnings remain depressed, the payout could become increasingly difficult to maintain without using more of the company’s cash flow.
THE GROWTH OUTLOOK REMAINS RED
The scanner currently shows:
• Growth score: 1.5/4 — 38%
• Three-year profit growth: -65.73%
• Three-year sales growth: -7.75%
• Estimate trend: NEUTRAL
• Recovery status: NO
The extraordinarily high future-profit-growth figure displayed by the scanner is largely a base effect.
When current earnings are extremely depressed, even a modest recovery can produce a very large percentage increase.
That does not automatically mean the business is entering a high-growth phase.
Investors need to distinguish between:
• Earnings recovering from an unusually low base
• A genuinely durable long-term growth trend
At present, Arkema has only demonstrated the possibility of the first.
THE JULY 30 CATALYST
Arkema will publish its first-half 2026 results on July 30.
This is the most important near-term catalyst for the setup.
I will be watching for:
• Improvement in Advanced Materials
• High Performance Polymers momentum
• Progress in Adhesive Solutions
• EBITDA margin stabilization
• Pricing actions offsetting input-cost inflation
• Better recurring cash flow
• Changes to the 2026 outlook
• Confirmation of slight EBITDA growth at constant currencies
• Any dividend or balance-sheet concerns
A strong report could create the missing recovery confirmation.
A weak report could explain why the scanner continues to show NO BUY despite the attractive chart.
THE TECHNICAL SETUP
Arkema is attempting to form a long-term base after falling from approximately €130 in 2022 to below €50 in 2026.
Key levels I am watching:
• €52–55: immediate support
• €47–50: major structural support and potential accumulation zone
• €58–60: first resistance and confirmation level
• €64–66: major breakout zone
• €72–75: secondary recovery target
• €85–90: major long-term resistance
The stock recently rebounded from below €50 to approximately €65 before falling back toward €55.
That failed breakout means the recovery is still incomplete.
A monthly close above €60 would be constructive. A move above €65–66 would provide much stronger evidence that a durable reversal is developing.
A sustained loss of €47–50 would invalidate the current bottoming structure and expose Arkema to further downside.
THE BULL CASE
• The stock trades almost 60% below its 2022 peak
• Technical entry quality is rated 80%
• The combined technical score is GREEN — 8/10
• Arkema has substantial exposure to specialty materials
• Attractive-market volumes grew approximately 15%
• Battery, sports, healthcare and 3D-printing demand remains strong
• Major projects should contribute around €50 million of additional EBITDA
• The indicated dividend yield is approximately 6.5%
• The business-price multiple appears inexpensive
• The false-bottom and value-trap checks remain positive
• A cyclical earnings recovery could produce significant operating leverage
THE BEAR CASE
• The scanner explicitly says NO BUY
• No new BUY event has been generated
• Business quality is rated RED
• Return on capital is extremely weak
• Sales, EBITDA and adjusted earnings are declining
• Margins continue to contract
• Europe and North America remain soft
• Net debt and hybrid bonds exceed €3.3 billion
• Current cash-flow and earnings multiples are expensive
• The dividend payout ratio has increased substantially
• The recovery has not been confirmed
• A weak July 30 report could send the stock back toward €47–50
MY CURRENT PLAN
I would treat Arkema as a pre-recovery watchlist idea—not as an active BUY.
My framework would be:
• Wait for the July 30 first-half results
• Avoid buying solely because the stock appears cheap
• Watch whether €52–55 continues to hold
• Consider a small position only after improving margins and cash flow
• Prefer a confirmed monthly close above €60
• Add greater conviction above €65–66
• Consider €47–50 only if a clear reversal develops
• Reassess the thesis below €47
• Monitor debt, dividend coverage and the ramp-up of growth projects
Arkema may eventually become an attractive cyclical-recovery investment.
But the scanner is demanding evidence before committing capital.
TRY THE SCANNER
Arkema demonstrates why Master Buy Scanner V2 does not generate a BUY simply because technical indicators turn green.
The scanner evaluates:
• Technical timing
• Entry quality
• Business quality
• Valuation and debt
• Growth outlook
• Recovery confirmation
• False-bottom risk
• Value-trap risk
• Model position size
AKE receives a 3/3 technical score and an 80% entry rating—but still gets a 0% position because the fundamental recovery is missing.
That distinction is designed to help investors avoid buying every apparently cheap falling stock.
Add Master Buy Scanner V2 to your TradingView charts here:
Run it across your watchlist and comment with the next ticker you want me to analyse.
THE QUESTION
What would you do with Arkema around €55 before its results?
A — Start a small position because the bad news is already priced in
B — Wait for the July 30 results and confirmation above €60
C — Avoid because weak returns and declining margins suggest a value trap
Comment A, B or C—and share your Arkema thesis below.
This is not financial advice. Always conduct your own research and manage risk according to your investment horizon.
ASMLASML Full Overview + Long-Term Chart Analysis (Shavyfxhub Style)
1. Origin of ASML
Founded: 1984 in the Netherlands (Veldhoven)
Originally a joint venture between Philips (Netherlands) and Advanced Semiconductor Materials International (ASMI)
Full name: ASML Holding N.V.
Became independent and publicly listed later. It is now one of the most important technology companies in the world.
2. Main Business Model
ASML is a pure-play semiconductor equipment company.
Its core business is designing, manufacturing, and selling lithography systems — the machines that print the tiny circuits on silicon wafers.
Revenue Model:
Sale of highly advanced lithography machines (EUV, DUV)
High-margin service contracts and upgrades (recurring revenue)
Spare parts and software
Extremely high barriers to entry (almost a monopoly in extreme ultraviolet / EUV technology)
3. Role in Lithography & AI Infrastructure
Lithography Leader: ASML is the only company in the world that can produce Extreme Ultraviolet (EUV) lithography machines.
These machines are essential for manufacturing the most advanced chips (3nm, 2nm, and below).
AI Infrastructure: Every advanced AI chip (NVIDIA, AMD, TSMC, Intel, Samsung) depends on ASML’s EUV machines. Without ASML, the current AI boom (GPUs, high-performance computing) would not be possible at scale.
Customers: TSMC, Samsung, Intel, and other leading foundries.
4. Long-Term Chart Analysis (Weekly Chart – Shavyfxhub Strategy)
Overall Structure:
ASML is in a powerful long-term ascending channel (black and red trendlines) since 2018–2019.
Clear higher highs and higher lows — strong bullish market structure.
Key Levels:
Demand Floor (Green): Major support zones around €800 – €1,000 and the current higher demand area near €1,193.
Supply Roof (Red): Upper channel resistance currently around €1,800 – €2,000+.
Current price is trading near €1,563 after a strong rally.
Long-Term Outlook (Shavyfxhub Style):
The structure remains strongly bullish.
As long as price holds above the green demand floor and the ascending channel, the uptrend is intact.
Next upside targets: Upper red channel lines (potential continuation toward €2,000 – €2,600 in a strong cycle).
A deep pullback to the green demand floor would be a high-probability buying area in the long-term structure.
Verdict: ASML shows a textbook long-term bullish structure. The company is a pure-play on AI and advanced semiconductor manufacturing, which supports the technical strength.
#ASML  Long
Long
No one will realize how cheap the share price is until 2027 hitsL’Oréal S.A. (Euronext Paris: OR) remains fundamentally one of the strongest companies in the global beauty industry, while its technical outlook suggests improving momentum following a healthy consolidation phase. Technical indicators show a cautiously bullish picture: the RSI (≈51) is neutral, indicating the stock is neither overbought nor oversold, the MACD has turned positive with a bullish crossover, and the 50-, 100-, and 200-day moving averages continue to support a long-term upward trend despite recent short-term price weakness. Momentum oscillators, including the Stochastic Oscillator and ADX, indicate the stock is consolidating rather than entering a downtrend, providing a favorable setup for a medium-term recovery if buying volume strengthens. Over the past two years, L’Oréal has significantly strengthened its competitive position through strategic acquisitions, including Color Wow (professional haircare), Medik8 (premium skincare), Kering Beauté (bringing luxury brands such as Creed and future Gucci beauty rights), an increased ownership stake in Galderma to capitalize on the fast-growing aesthetics market, and the majority acquisition of Innovist to accelerate expansion in India’s rapidly growing beauty sector. These investments broaden the company’s exposure to high-growth categories while reinforcing its Beauty Tech, dermatological, luxury fragrance, and emerging-market strategies. Financially, the company continues to demonstrate exceptional health, reporting €44.05 billion in 2025 revenue, a 74.3% gross margin, 20.2% operating margin, rising free cash flow, and double-digit e-commerce growth, while first-quarter 2026 sales outpaced the global beauty market. Considering both the improving technical indicators and strong underlying fundamentals, L’Oréal appears well positioned for continued growth over the next six months. Although macroeconomic conditions may create short-term volatility, the combination of robust financial performance, disciplined acquisitions, pricing power, and sustained innovation supports a moderately bullish outlook, with future appreciation expected to be driven primarily by earnings growth and successful integration of recent acquisitions rather than speculative market expansion.
Sources
1. L’Oréal 2025 Annual Results.
2. L’Oréal First Quarter 2026 Sales Update.
3. L’Oréal Finance – Investor Relations and Financial Results.
4. L’Oréal 2025 Universal Registration Document (acquisitions and strategy).  Long
Long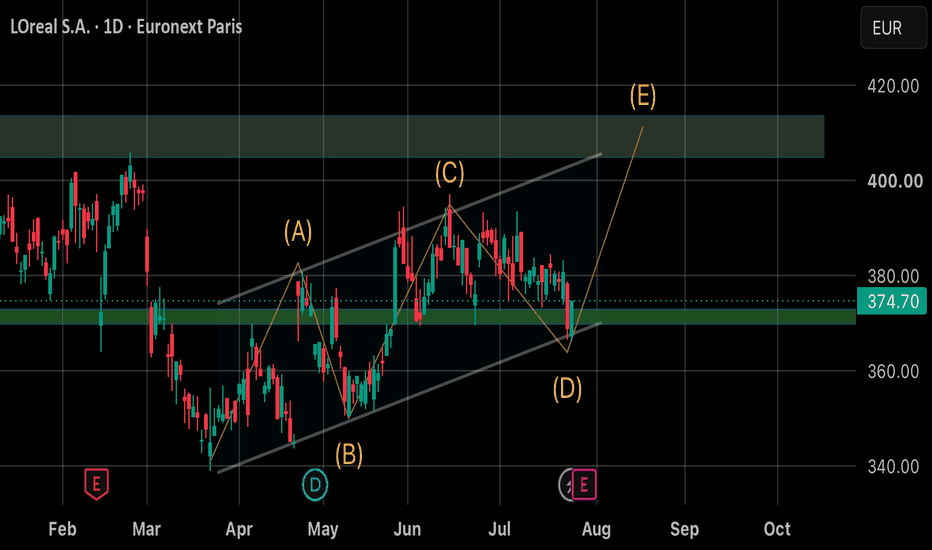
UNILEVER Critical Crossroads and/or Nice Longterm Entrypoint! Unilever is currently trading at a highly significant technical level . Looking at the long-term historical price structure, the stock has pulled back into an area that has repeatedly acted as major support over the years. At the same time, price action continues to respect the ascending support trendline that has been in place since roughly 2002 ( at least based on the for me available chart history ).
At the moment, price is hovering near the upper boundary of this long-term rising structure, attempting to maintain strength while waiting for renewed momentum to enter the market. From a bullish perspective, the key factor here is whether buyers can successfully defend the current zone. Ideally, we would want to see volume return alongside a strong continuation move higher. If momentum shifts back in favor of the bulls, a retest of the all-time high around €67.12 — reached on February 13, 2026 — could imply approximately 38% upside potential from current levels.
That said, downside risk should not be ignored. There is a realistic possibility that price enters a broader consolidation range, illustrated by the green box on the chart ( with the questionmark in it ). Historically, a very similar ranging environment occurred between December 2014 and February 2017, during which the stock traded within a maximum fluctuation range of roughly 30%. If history were to rhyme, this could also suggest the potential for a deeper corrective move before a larger trend continuation develops.
From a fundamental perspective, Unilever is in the middle of a major strategic transformation focused on simplifying and streamlining its operations. The company has already divested its ice cream division — including brands such as Magnum — and in March 2026 announced the merger of its food division with McCormick & Company. As a result, the “new” Unilever will become a more focused consumer goods company centered entirely around Beauty & Wellbeing, Personal Care, and Home Care.
Investor sentiment around this transition remains mixed. On one hand, underlying business performance remains relatively solid, with Q1 2026 underlying sales growth coming in at 3.8%, which demonstrates resilience on an organic basis. On the other hand, reported revenue in euro terms declined by 3.3% year-over-year versus Q1 2025, largely due to unfavorable currency effects. This creates a market environment where both bullish and bearish interpretations remain valid depending on whether investors prioritize operational growth or top-line contraction.
Overall, the current price region appears attractive from a long-term investment perspective, especially considering the historical technical support and the company’s strategic repositioning. However, in the short term, traders should continue monitoring both price action and macro/fundamental developments closely, as volatility in either direction remains highly possible.
Not financial advice. Trade safe <3 !
 Long
Long
Long 
 Long
Long
 Long
Long
 Long
Long
SBM Offshore -- Bullish reversalSBM Offshore is currently trading around an important historical price level near 31.60. This level has acted as a significant decision zone multiple times in the past, making it a key area to watch from a price action perspective.
Earlier on the chart, price reacted strongly around the 31.60 area, where it faced resistance and got rejected. After that rejection, price moved lower and created a lower low. This showed that, at that time, sellers were still in control around this level.
Later, price managed to recover from the lower zone and pushed above the 31.60 area, eventually creating a higher high. This was the first sign that buyers were gaining strength and that the previous resistance level was becoming less dominant.
After that move, price returned once again to the 31.60 zone. At that moment, the level still acted as an important reaction area, and price moved lower again. However, from that lower point, buyers stepped in strongly and pushed price all the way to new highs. This showed that demand was still present and that the broader bullish structure had not completely failed.
Now, price has returned to the 31.60 level once again. The important difference this time is that price appears to be holding this area as support instead of rejecting from it as resistance. The current bullish bounce from this level suggests that buyers are defending the zone.
From a technical perspective, this could indicate a possible support/resistance flip, where a previous resistance level is now turning into support. If this level continues to hold, 31.60 could act as a potential base for a new upward move.
The current reaction is bullish, but confirmation is still needed. A stronger bullish signal would come if price continues to hold above 31.60, forms a higher low, and then breaks above the recent lower highs. If that happens, a move back toward the previous highs becomes a more realistic bullish scenario.
The main level to watch is therefore 31.60. As long as price remains above this level, the bullish scenario remains valid. However, if price loses 31.60 with strong candle closes below it, the bullish setup weakens. In that case, the level could turn back into resistance, and price may look for lower support zones.  Long
Long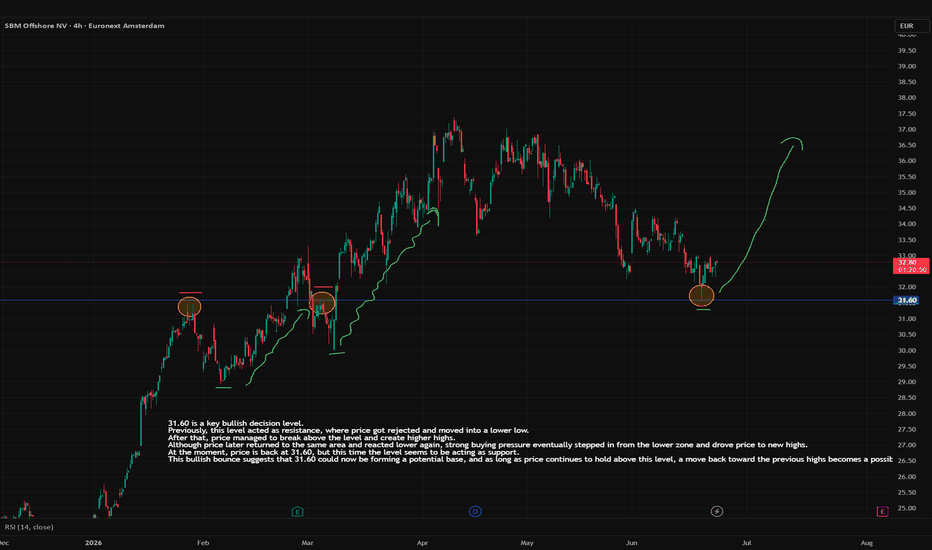
 Long
Long
Ryanair ensures stability: Michael O'Leary as CEO until 2032
By Ion Jauregui – Analyst at ActivTrades
Ryanair shares could see movement at the opening of the session after the company confirmed the renewal of Michael O'Leary as Chief Executive Officer until 2032, thereby extending the mandate of the executive who has led the airline for more than three decades.
The decision removes uncertainty over the future direction of the group at a time when the company is consolidating its position as the largest European airline by number of passengers.
Ryanair carried nearly 200 million passengers in its last fiscal year and recorded a net profit of more than 1.6 billion euros in 2025, supported by strong travel demand in Europe, despite a moderation in fares compared to post-pandemic levels.
O'Leary, who has been at the head of the company since 1994, has been the main driver of the low-cost model that has defined Ryanair’s strategy, based on operational efficiency, high fleet utilisation, and route expansion in key European markets.
Strategic visibility and growth targets
The continuity of the executive comes in parallel with the airline’s plans to reach 300 million passengers annually by 2034, compared to current levels of around 200 million, supported by the incorporation of Boeing 737 MAX aircraft and the expansion of capacity at secondary European airports.
The company also maintains a leading position in operational indicators, ranking among the most punctual airlines in Europe over the past year, with rates above 85% in various periods of the fiscal year.
Market impact and valuation
With a market capitalisation of around 25 billion euros, Ryanair has maintained a positive performance on the stock market in recent years, supported by the recovery in air traffic and improvements in operational efficiency.
Investors will continue to closely monitor the evolution of demand during the summer season, as well as the group’s ability to execute its growth plan in an environment shaped by the delivery of new aircraft and the evolution of operating costs.
Technical analysis
From a technical perspective, Ryanair maintains a broader bullish structure, with a gradual recovery from May lows and the formation of higher highs and higher lows. The stock is trading around 25.82 euros, consolidating the recent rebound phase.
The RSI at 59.22 reflects a positive bias without entering overbought territory, while the MACD maintains a bullish crossover with a positive histogram, confirming upward momentum.
In terms of key levels, resistance is located between 27.60 and 28.32 euros, whose breakout would open the way towards previous highs. On the downside, immediate support is found around 25 euros, a key level to preserve the current structure.
Moving averages show gradual improvement: the 50-day average has crossed above the 100-day average, although the price is still below the 200-day average, a key reference for confirming a fully established long-term trend.
Conclusion
The renewal of Michael O'Leary until 2032 strengthens Ryanair’s strategic visibility in an environment of expansion in European air traffic. For the market, the move consolidates the continuity of an operating model that has supported the group’s growth and profitability over the past decades.
The market reaction will depend on whether investors interpret the news as an additional catalyst within an already established trend or as a confirmation factor of the existing strategy.
*******************************************************************************************
The information provided does not constitute investment research. The material has not been prepared in accordance with the legal requirements designed to promote the independence of investment research and such should be considered a marketing communication.
All information has been prepared by ActivTrades ("AT"). The information does not contain a record of AT's prices, or an offer of or solicitation for a transaction in any financial instrument. No representation or warranty is given as to the accuracy or completeness of this information.
Any material provided does not have regard to the specific investment objective and financial situation of any person who may receive it. Past performance and forecasting are not a synonym of a reliable indicator of future performance. AT provides an execution-only service. Consequently, any person acting on the information provided does so at their own risk. Political risk is unpredictable. Central bank actions can vary. Platform tools do not guarantee success.
 Long
Long
 Long
Long
 Long
Long
 Long
Long
Long 
CAP GEMINI: A Tech Stock That Is Still InexpensiveWhen using TradingView’s stock screener and filtering for technology companies with a market capitalization above USD 100 billion, the resulting list is dominated by American and Asian companies, with very few European firms represented.
Here is the link to the TradingView global stock screener:
fr.tradingview.com
In reality, there are only three European technology companies with a market capitalization exceeding USD 100 billion: ASML, ARM, and Infineon.
Can investors still find European technology companies that remain attractively valued from a stock market perspective? I conducted the research, and the answer is yes.
To do so, one must look at European technology companies with market capitalizations below USD 100 billion. Within this category, there are numerous high-quality European firms with very promising earnings prospects linked to artificial intelligence.
To determine whether these companies represent attractive investment opportunities, I focused on two criteria:
• Forward P/E, which relates the stock price to expected earnings
• The medium- and long-term technical chart structure
Several opportunities emerge from this analysis, but my preferred choice from both a technical and fundamental standpoint is Capgemini, listed on the Paris Stock Exchange. This French company has strong fundamental potential related to AI, and its valuation remains very reasonable based on its Forward P/E, trailing P/E, and Price-to-Sales ratios.
The results of my research can be found in the table attached to this analysis. I encourage you to review it and examine the charts of these European technology stocks.
The table below highlights European technology and AI companies whose valuations remain attractive and that may offer catch-up potential relative to the leading U.S. technology stocks.
From a technical analysis perspective, the stock is currently trading at a major support level corresponding to the 78.6% Fibonacci retracement of the previous major bullish phase.
The chart below displays Capgemini’s weekly Japanese candlesticks along with its trailing P/E and Price-to-Sales valuation ratios.
DISCLAIMER:
This content is intended for individuals who are familiar with financial markets and instruments and is for information purposes only. The presented idea (including market commentary, market data and observations) is not a work product of any research department of Swissquote or its affiliates. This material is intended to highlight market action and does not constitute investment, legal or tax advice. If you are a retail investor or lack experience in trading complex financial products, it is advisable to seek professional advice from licensed advisor before making any financial decisions.
This content is not intended to manipulate the market or encourage any specific financial behavior.
Swissquote makes no representation or warranty as to the quality, completeness, accuracy, comprehensiveness or non-infringement of such content. The views expressed are those of the consultant and are provided for educational purposes only. Any information provided relating to a product or market should not be construed as recommending an investment strategy or transaction. Past performance is not a guarantee of future results.
Swissquote and its employees and representatives shall in no event be held liable for any damages or losses arising directly or indirectly from decisions made on the basis of this content.
The use of any third-party brands or trademarks is for information only and does not imply endorsement by Swissquote, or that the trademark owner has authorised Swissquote to promote its products or services.
Swissquote is the marketing brand for the activities of Swissquote Bank Ltd (Switzerland) regulated by FINMA, Swissquote Capital Markets Limited regulated by CySEC (Cyprus), Swissquote Bank Europe SA (Luxembourg) regulated by the CSSF, Swissquote Ltd (UK) regulated by the FCA, Swissquote Financial Services (Malta) Ltd regulated by the Malta Financial Services Authority, Swissquote MEA Ltd. (UAE) regulated by the Dubai Financial Services Authority, Swissquote Pte Ltd (Singapore) regulated by the Monetary Authority of Singapore, Swissquote Asia Limited (Hong Kong) licensed by the Hong Kong Securities and Futures Commission (SFC) and Swissquote South Africa (Pty) Ltd supervised by the FSCA.
Products and services of Swissquote are only intended for those permitted to receive them under local law.
All investments carry a degree of risk. The risk of loss in trading or holding financial instruments can be substantial. The value of financial instruments, including but not limited to stocks, bonds, cryptocurrencies, and other assets, can fluctuate both upwards and downwards. There is a significant risk of financial loss when buying, selling, holding, staking, or investing in these instruments. SQBE makes no recommendations regarding any specific investment, transaction, or the use of any particular investment strategy.
CFDs are complex instruments and come with a high risk of losing money rapidly due to leverage. The vast majority of retail client accounts suffer capital losses when trading in CFDs. You should consider whether you understand how CFDs work and whether you can afford to take the high risk of losing your money.
Digital Assets are unregulated in most countries and consumer protection rules may not apply. As highly volatile speculative investments, Digital Assets are not suitable for investors without a high-risk tolerance. Make sure you understand each Digital Asset before you trade.
Cryptocurrencies are not considered legal tender in some jurisdictions and are subject to regulatory uncertainties.
The use of Internet-based systems can involve high risks, including, but not limited to, fraud, cyber-attacks, network and communication failures, as well as identity theft and phishing attacks related to crypto-assets.
 Long
Long