The Laggard That Just Started Leading Alpha Bank's Valuation GapAlpha Bank sits at €4.42 with a €9.97bn market capitalisation, the smallest of the four Greek systemics and the clear laggard of 2026 with a year-to-date gain of 23.46% against 47.01% for Piraeus, 30.98% for Eurobank and 26.15% for National. That is the headline number everyone quotes. It is also the one that is now out of date. Over the past month Alpha is up 8.47%, the best of the group; over the past week it is up 5.94%, more than double the second-placed Piraeus at 2.55%. On the session in question it is the only one of the four trading higher, and with 2.40m shares changing hands at €4.42 it carries roughly €10.6m of turnover, the highest value traded in the sector that day. Leadership in price, leadership in volume, and the only green tick in a red sector is the standard signature of rotation rather than noise.
Working backwards from the performance columns, the stock opened the year around €3.58, sat near €4.07 a month ago and €4.17 a week ago. The entire weekly move therefore came after the 31 July results, which tells you the market is repricing on new information rather than drifting. The €4.17–4.20 zone was the pre-results ceiling and has been broken on volume; on a conventional reading it converts to first support. Below that, €4.07 is the base of the last month and its loss would invalidate the setup. Above, the first meaningful marker is €4.49 — the level at which Alpha trades level with Eurobank in absolute terms, which matters psychologically in a market where retail investors anchor on nominal price. The Alpha/Piraeus ratio has fallen roughly 16% since January, from 0.527 to 0.443, and the past week is the first genuine recovery in that ratio all year.
The reason the technical picture matters is that the valuation gap behind it has not closed. Tangible net asset value came in at €7.8bn at the half year, which puts the stock at roughly 1.28x P/TBV. Eurobank Equities had it at 1.17x in June against approximately 1.5x for the other three systemics, and even after the rally the discount remains double-digit. What makes that hard to defend is the return profile: Alpha posted a 15.5% return on tangible equity in the second quarter against 15.6% for National Bank. Essentially identical profitability, materially different multiple. On earnings the picture is the same — with guidance revised up to €0.41 EPS from €0.40, the stock trades on about 10.8x 2026 earnings for a 9.5% earnings yield. Closing the gap to 1.40x implies €4.84; closing it to the peer 1.5x implies €5.18, or roughly 17% upside.
The results themselves were not a marginal beat. Adjusted profits came in at €275m, 17% above consensus, while reported net profit exceeded forecasts by around 30% — the largest surprise in the sector. Half-year net profit reached €497.2m. Fee income rose 34% year on year, or 24% on a comparable basis, with AXIA advising on more than €10bn of transactions in six months. Loans grew 4% in the quarter and 12% year on year, the strongest credit expansion of the four, which is difficult to reconcile with a narrative of structural underperformance. Cost/income ran at 38%, cost of risk at 39bps, NPEs at 3.6% and CET1 at 14.3%. Management booked a €273m distribution provision for the half and intends to pay an interim dividend of roughly €124m in Q4, alongside a buyback programme of up to 205m shares — close to 9% of the share count — launched on 31 July.
Then there is the index event. Greece enters FTSE Russell's developed market indices at the September 2026 review, with STOXX applying the change to its main European indices on the same date and MSCI following in May 2027. The banking sector is regarded as the primary recipient of the associated flows given its heavy weighting in international indices. Passive money buys on capitalisation and free float, not on local sentiment, so Alpha's smaller size means less absolute passive demand than its peers. But for the active developed-market managers who arrive afterwards, the comparison set changes entirely — a Greek bank earning 15.5% on tangible equity at 1.28x book stops being measured against three domestic peers and starts being measured against southern European banking, where the discount is wider still. The UniCredit partnership moving into implementation and the persistent M&A optionality sit on top of that and appear nowhere in the multiple.
None of which makes the discount a gift. Alpha runs the thinnest capital buffer of the four at 14.3% CET1 against National's 17.3%, asset quality remains the weak link with NPEs at 3.6% versus 2.4%, and the 2.16% net interest margin is structurally below Eurobank's 2.48%. The quarter also contained a €39.6m PRODEA dividend inside the fee line, which is not recurring. And JP Morgan's target price of €4.40 sits fractionally below the current market — consensus has not yet caught up to the second-quarter print, but nor is it treating it as a break in trend. The argument is not that Alpha deserves Eurobank's multiple. It is that the RoTE gap to peers has narrowed from six points in 2024 to under three today while the valuation has not travelled the same distance, and the tape of the last four weeks suggests the market has finally started to notice.  Long
Long
 Short
Short
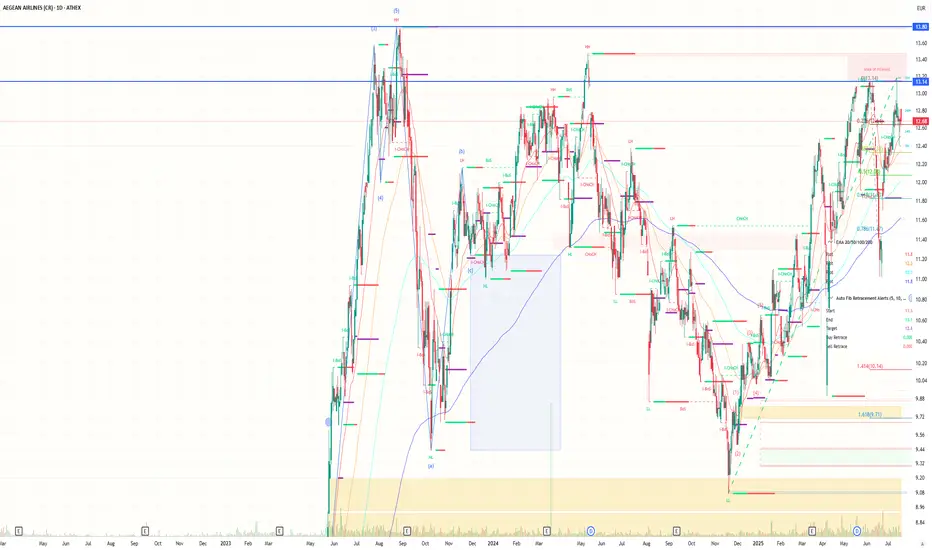
Aegean: Shares fall below €13 - Vassilakis (CEO) messageAegean is bracing for a challenging 2026, with management warning that geopolitical tensions in the Middle East and persistently high energy costs are creating an especially difficult environment, particularly in the first half of the year.
The stock has fallen to €12.92, slipping below the €13 threshold as well, a move that reflects the pressure currently weighing on the share. The decline is unfolding against a broader backdrop of weakness in the market, where negative sentiment and heightened investor caution are fueling sell-offs and curbing appetite for risk.
Speaking at the company’s general shareholders’ meeting, chairman Eftichios Vassilakis said the initial plan had called for a 7% to 8% increase in available capacity. However, developments in the wider region, which directly affect around 6% of the airline’s network, together with adjustments made between April and June, are now leading to more subdued expectations. Based on current data, growth is ultimately expected to come in at 4% to 6%.
At the same time, the sharp rise in fuel prices is adding significant pressure, intensifying strain across the broader aviation sector. Although Aegean has hedged roughly 60% of its fuel needs, the remaining 40% is still directly exposed to market volatility. According to management, with fuel prices remaining about twice as high as last year, the additional burden in the first half is estimated at between €40 million and €65 million.
A similar picture is expected in the second half of the year, provided prices remain at current levels. Under that scenario, the total cost impact for 2026 could reach €90 million to €115 million, even after the effect of hedging. The company notes that without this policy in place, the financial burden would have been far greater.  Short
Short
Bally’s Intralot: Short Pressure Meets a Bullish Technical TurnBally’s Intralot had spent several weeks trading in a sluggish range between €0.85 and €0.98, giving the impression that the €1.10 capital raise level had already been left behind. The market looked comfortable with that view. Short positioning appeared well established, and the broader tone suggested that sellers were in control.
That kind of environment often creates the conditions for a reversal.
The recent move higher is not just a random rebound inside a weak chart. Technically, the structure is starting to shift in a meaningful way. After repeatedly holding the €0.85 area, the stock formed a base and began to break out of its descending pattern. What had been a sequence of lower highs and lower lows is now being challenged by a change of character, followed by higher lows and stronger upside impulses.
At the same time, the broader buy back is improving. The €40 million interim financing from Deutsche Bank acts as more than just liquidity support. It signals that the larger €1.6 billion transaction pipeline is moving forward with credible institutional backing. That kind of development tends to change how the market prices risk.
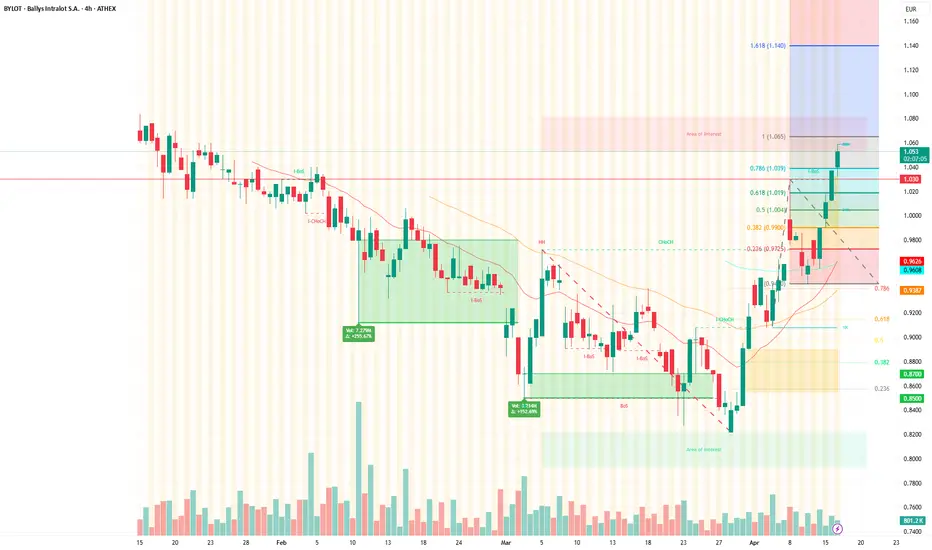
From a chart perspective, the move from the recent low near €0.84 into the current zone has respected key Fibonacci levels. The 0.382 retracement near €0.99 acted as the first barrier, the 0.618 zone around €1.02 was reclaimed, and price is now testing the 0.786 area near €1.04 to €1.05. That is a technically important zone, often acting as the final resistance before a full retracement.
The reclaim of €1.03 is particularly important. That level had acted as a ceiling, and the market is now attempting to turn it into support. If that holds, the bullish structure strengthens significantly.
The next key area sits around €1.06 to €1.08, where the chart shows clear overhead supply. A sustained break above that region would likely open the path toward €1.10, a level that carries both technical and psychological weight.
What makes this setup more compelling is the positioning dynamic. When a stock trades for weeks in a compressed range, short sellers tend to build conviction. But once price starts reclaiming levels that had looked secure, the balance shifts. Pressure moves away from buyers and onto sellers, who may be forced to cover.
That is how squeeze conditions develop. Not through sudden announcements, but through steady price acceptance above key levels.
The current structure reflects exactly that risk. Price is now above both short-term and medium-term moving averages, which are starting to turn higher. Momentum is improving, and the trend is stabilizing after a prolonged decline.
As long as Bally’s Intralot holds above €1.03, the short-term outlook remains constructive. A pullback into the €1.00–€1.02 zone would still be consistent with a healthy retest. A break above €1.06 would likely accelerate upside momentum and increase pressure on short positions, potentially driving a move toward €1.10 and beyond.  Long
Long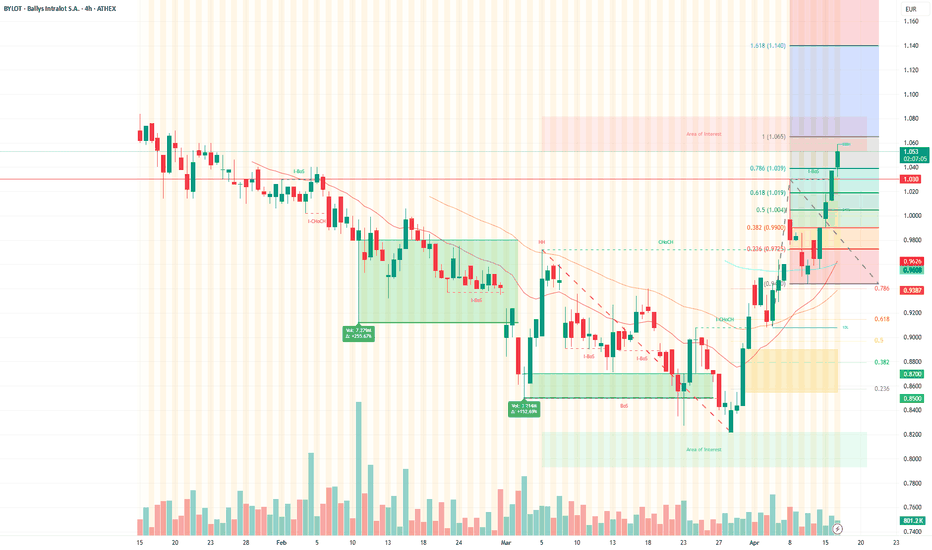
PPC: The Most Undervalued Utility Stock in EuropePublic Power Corporation (PPC), Greece’s largest utility company, remains significantly undervalued on the stock market, despite its strong fundamentals and ambitious growth strategy. While European utility stocks are gradually re-rating, PPC continues to trade at a steep discount, indicating a disconnect between its financial outlook and market valuation.
Where PPC’s Valuation Stands Today
In its latest report, Eurobank Equities raised its price target for PPC to €18 (from €17), reiterating a "Buy" recommendation. However, the stock still trades well below that level, highlighting its undervaluation.
Key valuation multiples versus European peers:
Metric PPC 2025 Peer Average EuroStoxx Utilities
P/E 11.9x 14.3x 13.8x
P/E 2026 10.3x 13.1x 13.8x
EV/EBITDA 2025 6.2x 8.0x 7.6x
EV/EBITDA 2026 6.3x 7.7x 7.6x
Across all key years, PPC trades at a 20–30% discount to both its peer group and sector indices, despite offering equal or superior growth prospects.
Strong Growth Prospects: +10% EBITDA CAGR
PPC is forecast to grow its EBITDA at an average annual rate of 10% between 2024 and 2027, based on conservative projections by Eurobank Equities. The company itself has set a more aggressive EBITDA target of €2.7 billion by 2027, compared to the broker’s estimate of €2.4 billion — a discrepancy that reflects the cautious stance of analysts.
Comparison with Major European Players
Company Forecast EBITDA Growth (2024–2027) EV/EBITDA 2025 Notes
PPC +10% 6.2x Strongest growth and among the cheapest
Engie (France) +2.5% 5.7x Low valuation, but weak growth
Orsted (Denmark) +9% 8.1x Decent growth, expensive stock
Iberdrola (Spain) +6% 8.5x Established leader, premium pricing
PPC delivers the highest projected EBITDA growth among its European peers while maintaining one of the lowest valuations, a clear sign that the market is overly discounting execution risks.
Leverage and Investments: A Manageable Strategy
Despite embarking on a €7.5 billion investment plan for 2024–2026, PPC maintains a healthy capital structure. The net debt/EBITDA ratio is projected to remain around 3.5x, which is considered reasonable for a utility with regulated cash flows.
The investment focus includes:
Renewables: Targeting 5 GW of installed capacity by 2026
Grid upgrades and smart meters
Gradual lignite phase-out and plant modernization
These are long-term value-generating investments, boosting efficiency, lowering risk, and enhancing sustainability.
Why Is the Market Ignoring PPC’s Upside?
PPC’s stock has failed to track the rally in both European utilities and non-financial Greek equities. Investors seem wary of the bold targets set by management and are pricing in high execution risk.
Yet this caution appears disconnected from the company’s track record and financials. PPC has:
Delivered consistent earnings growth
Improved margins year over year
A clear and methodical expansion strategy
The market’s hesitation leads to a valuation mismatch that appears unjustified based on fundamentals.
Re-rating Has Yet to Materialize
While European utility stocks have experienced a mild re-rating, PPC has lagged. Should it converge even partially with sector averages, its stock price could see substantial upside. A simple alignment of PPC’s EV/EBITDA multiple with the peer average (8x) would imply a fair value well above €20, even using conservative 2025 EBITDA estimates.
Bottom Line: Undervalued with Strong Fundamentals
PPC is not just cheap — it’s the cheapest major utility stock in Europe, with:
Leading growth forecasts
Prudent debt management
High-return, forward-looking investments
Reasonable targets that remain underappreciated
As market perception catches up with performance, revaluation potential is significant. PPC stands out as one of the most attractive value plays on any European exchange, not just within Greece.  Long
Long
 Long
Long
Jumbo: A Conservative Model in the Wrong Era (SHORT)The choice of a “Japanese-style” model, focused on cash accumulation, low leverage, and steady dividend distribution, is presented as a formula for resilience. According to modern schools of economic thought, however, this approach was shaped in different decades, in different markets, with slower competitive dynamics and limited technological disruption.
The core of the criticism is clear. In markets where innovation, scale, and speed determine the winner, excessive emphasis on maintaining high cash reserves is seen as a defensive stance. Economists who study retail growth models argue that capital returns stem from aggressive deployment of resources rather than continuous accumulation.
In an environment where competitors invest heavily in logistics, automated warehouses, and data analytics, limiting reinvestment to strict percentage thresholds may prove outdated. Markets evolve at a pace that does not tolerate delay. If a company operates with a 1990s mindset while its rivals move with a platform-driven logic, the gap widens.
A second issue concerns opportunity cost. High liquidity reduces financial risk but increases the cost of inactivity. In periods when interest rates stabilize and access to borrowing is controlled yet available, complete avoidance of leverage is no longer viewed as an unquestioned virtue. Modern capital structure theory accepts that balanced use of debt can enhance return on equity.
At the same time, retail is no longer linear. Physical presence connects with e-commerce, personalized advertising, and dynamic pricing. Maintaining a model that prioritizes stability over flexibility may create rigidity. Companies that dominate internationally today are characterized by rapid adaptation, frequent product renewal, and aggressive geographic expansion.
Critics also argue that placing dividend policy at the center of corporate identity sends a message of preservation rather than ambition. In mature companies, this may satisfy investors in the short term. In changing markets, however, prioritizing cash returns over footprint expansion creates strategic risk.
There is also the issue of management psychology. Models that emphasize control and avoidance of external financing often stem from a culture wary of risk. Contemporary analysts argue that risk is not eliminated through cash accumulation. It is transformed. If a company fails to invest on time, the risk shifts to loss of market share.
International experience shows that firms attached to older capital management standards struggled to compete with businesses using flexible financing and high technological investment. Stability is an advantage only when it does not undermine growth momentum.
The “Japanese” discipline framework makes sense in periods of uncertainty. In highly competitive markets, however, excessive conservatism may become dangerous. Modern economists stress that value is created through adaptability and execution speed. Those who choose to move slowly must prove that the market will wait.
The Capital Discipline Model of Jumbo
Jumbo follows what contemporary financial literature describes as conservative capital allocation. The company maintains strong liquidity, avoids bank borrowing, and applies a stable dividend policy. Growth is organic and based on strict return-on-investment criteria.
This philosophy aligns with the pecking order theory. Internal funds are used first, borrowing is considered later. The main objective is resilience during crises and volatility. Profitability takes precedence over speed. The model rests on stability and long-term balance sheet strength.
The advantage is low financial risk. The drawback is that expansion depends exclusively on generated profits rather than aggressive capital deployment.
The Scale-Driven Expansion Model of Action
Action operates with an aggressive growth strategy. It relies on economies of scale and rapid geographic expansion. The company invests quickly in new stores, uses centralized logistics, and seeks continuous market share gains.
In modern economic theory, this connects to the scale economics model. As the network grows, average cost per unit declines. Bargaining power with suppliers strengthens. The advantage arises from size, not only from margin per store.
Risk is higher, but the strategy aims to capture markets before competition matures.
The Value Retail Model with Aggressive Geographic Penetration of Pepco
Pepco adopts a value-driven expansion model. Its strategy centers on low prices, standardized store concepts, and rapid entry into multiple markets simultaneously. Capital is directed toward network expansion and maximizing presence.
The economic rationale focuses on market share maximization. Return on equity improves through scale rather than conservative liquidity management. Priority is filling geographic gaps before competitors do.
The Platform Capitalism and Blitzscaling Model of Temu
Temu represents the digital scale model. Its operations are platform-based, supported by dynamic pricing and data analytics. In academic literature, this is described as platform capitalism, while its rapid growth strategy is known as blitzscaling.
Immediate profitability is not the priority. Rapid penetration and massive transaction volume are. The model is asset-light. Investments focus on technology, marketing, and customer acquisition. Competitive advantage stems from data and scale.
Trapped in an Old Model in a Market That Changes Without Warning
In this environment, the real question is not whether the current model works today. It is whether it will work tomorrow. Modern economic theory is clear. When competition intensifies, stability alone is insufficient. Firms that insist on rigid management structures risk losing ground to more flexible players.
Mr. Vakakis appears committed to a framework that delivered results for years. Markets, however, reward adaptation. Data from today’s competitive economy show that as rivalry intensifies, companies must reassess structures, growth speed, and capital policy.
Persistence in a reality shaped by different conditions may prove costly. Resilience is not achieved solely through a strong cash position. It requires flexibility, resource reallocation, and strategic adjustment before the market imposes its own terms.
In the current economic cycle, those who fail to change in time are usually forced to change later at a higher cost.  Short
Short
Technical Picture Under PressureShares of Alpha Bank are undergoing a sharp correction on the Athens Stock Exchange, having moved noticeably away from their recent highs. The picture in recent sessions has been clearly negative, with consecutive closes in the red and a significant erosion of the gains recorded earlier in the year.
A key factor behind the shift in sentiment was the stance taken by UniCredit. The Italian group’s CEO, Andrea Orcel, made it clear that a public offer to acquire all shares of the Greek bank is not on the agenda. That statement removed a scenario which, for many investors, had been acting as a valuation support mechanism.
Pressure Beyond the Takeover Scenario
The correction cannot be attributed solely to the absence of a corporate catalyst. A comparison with the broader performance of the banking sector raises additional questions. If the stock has declined more sharply than its peers, concerns about relative underperformance naturally emerge.
In this environment, investors are looking for answers: is this an overreaction, or is the market pricing in weaker fundamentals ahead?
Pricing in Lower Profitability for 2025?
Attention is already shifting toward the 2025 financial year. The expected decline in interest rates and the gradual normalization of net interest income could compress profit margins across the sector. If that scenario materializes, the current pressure may reflect a more conservative valuation outlook in anticipation of lower profitability.
Some market participants believe that large institutional portfolios are locking in gains after an extended rally in bank stocks. Others argue that current price levels are beginning to look attractive for investors who see resilience in the bank’s core fundamentals.
A Crossroads for the Stock
At present, Alpha Bank appears to be the most heavily pressured stock among the major Greek banks. Whether this proves to be temporary turbulence or a sign of a deeper shift in expectations will likely become clearer with the 2025 financial results.
Until then, the market will continue to weigh two opposing forces: on one hand, the absence of a full takeover scenario; on the other, the possibility that the recent correction has already factored in a more demanding environment for the banking sector.
Technical Picture Under Pressure: Weak Momentum and Key Support at €3.70
The stock is currently trading at €3.742, showing short-term weakness with negative daily and weekly performance, despite remaining positive over a three- and six-month horizon.
From a technical standpoint, the price is trading slightly below the 20- and 50-day exponential moving averages and remains under the 100-day moving average as well, a sign that upward momentum has weakened. The Relative Strength Index (RSI) stands around 46, a neutral to slightly negative level that does not yet signal oversold conditions. Meanwhile, the MACD remains in negative territory, with the MACD line positioned below the signal line, confirming short-term bearish momentum.
Key support is identified in the €3.70–€3.65 zone. Only a move back above €3.85–€3.90, followed by stabilization at those levels, would meaningfully improve the technical outlook. Short 
ELPE vs. MOH: Two Similar Energy Groups, 1Bil-Euro Valuation GapThe comparison between HELLENiQ Energy (ELPE) and Motor Oil Hellas (MOH) is one of the most indicative cases of valuation asymmetry in the Greek stock market. Although both are vertically integrated energy groups with similar operational scale, comparable Enterprise Values, and a similar strategic transition toward energy and renewables, the market has consistently assigned MOH a significant premium in terms of market capitalization. This divergence is not sufficiently explained by long-term profitability or total shareholder returns and therefore warrants reassessment.
Market Capitalization, Enterprise Value, and Balance Sheet Structure
In terms of equity value, MOH is currently valued at approximately €3.76 billion, with a share price of €33.98 and 110.8 million shares outstanding. ELPE, with a share price of €8.89 and 305.6 million shares, is valued at €2.72 billion. The market capitalization gap approaches €1 billion and forms the basis of the narrative around MOH’s “quality superiority.”
However, at the Enterprise Value level, the picture changes materially. ELPE, with net debt of approximately €2.36 billion, has an EV close to €5.1 billion. MOH, with lower leverage but higher market capitalization, is valued at an EV of around €5.4–5.5 billion. In other words, the market values the two companies as almost equivalent in terms of total operating value, despite the pronounced divergence in equity value.
This observation is critical, because from an institutional perspective EV is the primary valuation metric for capital-intensive, cyclical businesses, where balance sheet structure fluctuates throughout the cycle.
EV / EBITDA and Normalized Profitability
The valuation gap at the equity level is partly based on the perception that MOH has superior earnings quality and stability. Indeed, MOH has historically shown lower EBITDA volatility and better cash flow visibility. That said, this does not imply that ELPE is fairly valued.
The year 2025 is a characteristic example of cycle-driven distortion. ELPE’s reported EBITDA for the first half amounted to €235 million, heavily affected by inventory losses due to falling oil prices. On a comparable basis, adjusted EBITDA reached approximately €400 million, translating into an annualized run rate of around €800 million.
With EV of roughly €5.1 billion, ELPE trades at an EV/EBITDA multiple of about 6.4x on a normalized basis. MOH, by contrast, trades at EV/EBITDA of 7–8x, reflecting a premium for stability and a future growth narrative. This gap is not extreme on its own, but it becomes problematic when combined with historical shareholder returns.
Dividends and Total Shareholder Return
The real differentiation between the two groups lies in total capital return. From 2005 to 2024, ELPE has distributed cumulative dividends of €8.37 per share. At today’s price of €8.89, shareholders have already recovered almost the entire current market value in cash.
In total value terms, ELPE shares correspond to €17.26 (price plus cumulative dividends), implying a total value of approximately €5.28 billion. MOH, while having distributed higher absolute dividends per share (around €15.5), maintains a much higher share price. Its total value (price plus dividends) stands at roughly €5.48 billion.
The key conclusion is that in terms of total shareholder value, the two companies are nearly equivalent. Despite this, the market assigns MOH an equity premium of around €1 billion, fully discounting ELPE’s long-term outperformance in capital returns.
Forward Dividend Capacity and Downside Protection
In a normalized margin environment, ELPE can support a dividend of €0.50–0.70 per share, corresponding to a forward dividend yield of 6%–8% at current price levels. This yield provides meaningful downside protection for investors.
By contrast, MOH, with a yield of 4%–5%, has already priced in the predictability of its distributions. Its yield serves more as valuation confirmation than as an investment cushion.
Renewables and Unpriced Future Value
Both groups target renewable portfolios of around 2 GW by 2030. MOH has been more effective in communicating its strategy and has incorporated part of this value into its valuation. ELPE, through HELLENiQ Renewables, is developing a comparable pipeline, with mature projects and long-term project finance structures.
Even using a conservative valuation of €0.8–1.0 million per MW, ELPE’s renewable portfolio implies potential value exceeding €1.5 billion at full development. This value is not currently reflected in EV and effectively represents an unpriced option.
MOH justifies a relative premium due to stability, narrative simplicity, and visibility. The question, however, is not whether it deserves a premium, but whether the premium assigned is reasonable relative to ELPE.
At the Enterprise Value level, the two groups are nearly equivalent. On EV/EBITDA, ELPE trades cheaper. In terms of total shareholder return, ELPE has already returned almost its entire current valuation in cash. The market is penalizing the cycle and ignoring total value.
For a medium-term investor, this asymmetry is a clear signal. The bullish case for ELPE is not based on a recovery thesis, but on arithmetic, valuation, and historically proven capital return data.  Long
Long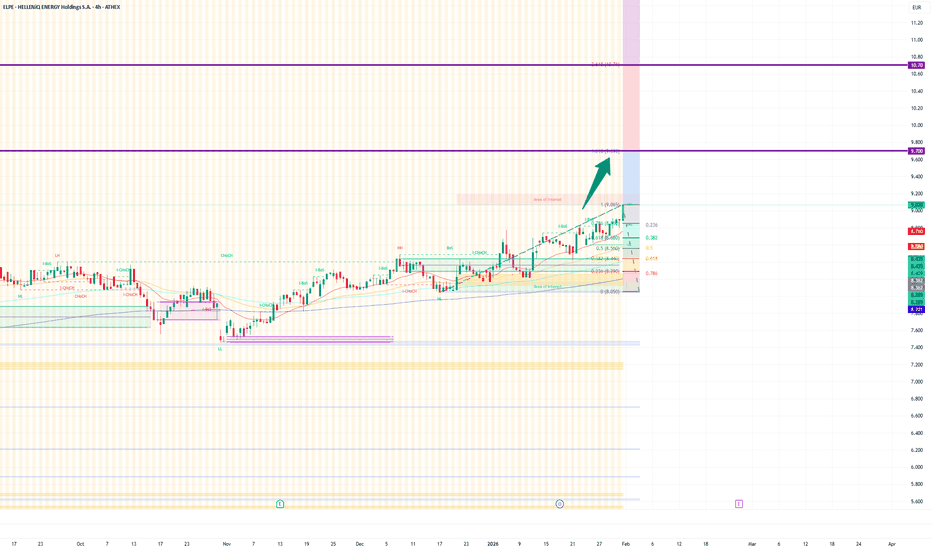
Mythical €300 Million Gains for QualcoThe market made clear yesterday just how seriously it views the role that Qualco appears poised to take on in the redesign of the debt-collection architecture for overdue social security contributions at EFKA. The disclosure of a direct award for the initial study, which concerns the full restructuring of the collection system and the operational model of the Centre for the Collection of Social Security Debts (KEAO), confirmed what had been circulating in financial circles for weeks.
Qualco’s share reacted immediately. It closed at €6.38, up nearly 4%, in a session marked by strong investor interest from the opening bell. The move signals that the market is already pricing in the possibility that Qualco is on track to secure a project with enormous financial weight and long-term revenue potential.
The overdue-debt portfolio connected to the project exceeds €40 billion, with the part tied specifically to social security funds approaching €45 billion, according to the original report. It is one of the largest initiatives ever undertaken by the Greek state in the field of public-sector collections, and a significant portion of the arrears are considered particularly difficult due to age, business closures or insolvencies.
Within this landscape, Qualco appears well positioned to claim a decisive role in shaping the new model. The award of the initial study was the first clear signal. Yesterday’s disclosure that the company has already been assigned the task of designing how EFKA’s overdue-debt recovery system should be rebuilt strengthened the perception that it has gained an advantage heading into the next and much larger phase of the project.
The report notes that the process resembles patterns seen in other major public contracts, where the firm conducting the preliminary study often secures a practical edge in the final tender. Qualco, which has deep experience in receivables management and technology systems for the financial sector, is viewed by many as the most capable candidate to oversee the full redesign and implementation.
If scenarios circulating in the market materialise, Qualco could eventually manage up to 40% of the overdue debts incorporated into the new system. The remaining portion may be split among other major servicers such as doValue, Intrum and Cepal, although no final decisions have been made.
The financial potential attached to the project is striking. Market estimates suggest that Qualco’s revenues over the next five years could reach €300 million, depending on the final structure of the system, the volume of debts allocated for management, and the efficiency gains ultimately delivered by the new model.
Adding to this momentum is the fact that the company undertook, in October 2024, a separate assignment valued at €27,280 including VAT, aimed at mapping out the reorganisation of EFKA’s overdue-debt collection architecture. Although modest in cost, the study is regarded as a vital precursor to the larger competitive process and helps frame the operational blueprint for the next stage.
For Qualco, the timing could hardly be better. The sharp rise in its share price reflects not only the potential profit stream but also the growing recognition that the company may secure a strategic role in an area of public administration that has long been considered in need of modernisation.
The coming months will show whether the market has correctly anticipated the outcome. For now, one thing is clear: Qualco has moved to the centre of a public-sector project that could become one of the most profitable of the decade, and investors have already begun positioning themselves accordingly.  Long
Long
Intralot Becomes a Collaboration Target After UK Tax ShiftThe increase in taxation in the United Kingdom did not only cause disruption in the market. It brought to the surface a deeper strategic shift that had already been in motion. The major players in the industry are reassessing their operating models, looking for ways to strengthen their presence in international markets, and exploring new partnerships that will allow them to operate with greater flexibility and technological capability. In this process, Intralot emerges as the clear winner.
The company is at the center of attention for a simple reason. The tax change in England does not restrict the sector, it redefines it. British companies now need partnerships with providers that offer strong technology, an international footprint, and the ability to deploy solutions quickly across multiple markets. Intralot possesses all of these and has already proven it through its successful restructuring with BII, which created a new, strengthened entity with a clear international focus.
Its strategic plan includes strong growth in Europe, North America, and South America. The market knows that Intralot is in the best position in years to take advantage of the new environment. Its technology covers the entire spectrum of iGaming, lotteries, and digital systems, while its operational structure is ready to support high volumes and complex regulatory demands.
The tax shift in Britain immediately triggered interest from domestic players. Funds and operators who until recently followed a more conservative strategy are now turning to Intralot, seeking access to a strong technological hub. They are not only exploring partnership opportunities but also possible equity stakes. Their goal is to leverage the rapid growth of Intralot's new structure and secure a position in a company that is on a path of international expansion.
This picture becomes even stronger due to the actions of the company’s key shareholders. The decision by Bally’s and Intracom to increase their positions, and especially the purchase of 6.7 million shares by Vice Chairman Soohyung Kim, sent a clear message of confidence. Kim invested during a period of strong volatility, showing that he considers the stock undervalued and the company ready for the next step. The market followed, and the immediate rise from 0.92 to 1.042 euros confirmed the shift in sentiment.
Intralot’s fundamentals reinforce this new narrative even further. Nine-month AEBITDA reached 90.1 million euros, with a margin of 37.2 percent, one of the highest internationally. Operating cash flows stand at 86.4 million, net debt is steadily declining, and leverage is easing. All these elements paint the picture of a company that has fully regained control of its trajectory and is ready to capitalize on emerging opportunities.
Reports from Jefferies, Ambrosia Capital, and Euroxx confirm the same conclusion. Intralot is moving up a category. Its international position is strengthening, its prospects are expanding, and the stock remains priced below what its metrics justify. The market is already beginning to anticipate that, as strategic moves from the United Kingdom take shape, Intralot will be at the center of even greater investment developments.
Technical Analysis: INTRALOT
Sharp Drop Without Fundamental Justification
INTRALOT’s stock suffered an extremely steep drop from 1.124 euros to 0.880 euros, recording losses of about 21.7 percent within hours. This move coincided with the announcement of the new UK taxation, which caused nervousness in markets. However, the intensity and speed of the decline are not justified by the company’s fundamentals nor by sector conditions. Instead, there are signs of margin calls being triggered, meaning automatic selling due to collateral breaches in leveraged portfolios. This likely caused a chain reaction of technical liquidation.
Technical Reversal and Market Re-Entry
After the sell-off, the stock showed an impressive V-shaped recovery, returning to the 1.04 to 1.05 euro zone, which aligns with the 0.618 Fibonacci retracement level. This technical zone acts as a key resistance point and a measure of recovery strength. The fact that the price returned there quickly suggests that the sell-off was excessive and temporary.
Technical Indicators: MACD and RSI
On the 1-hour chart, the MACD shows stabilization and is approaching a positive crossover. There is no sign of strong downward momentum anymore. Meanwhile, the RSI is moving in the equilibrium zone (50–53) on both the 1-hour and 15-minute charts, indicating that the market is trying to find direction after the strong volatility.
Volume and Zones of Interest
During the drop, trading volume exceeded 30 million shares, confirming massive liquidation. However, there is growing interest near 0.946 to 1.014 euros, a region that shows strong accumulation and potential support according to the volume profile.
Fibonacci Extensions
Using the upward wave from 0.880 to 1.050 euros, the following Fibonacci extension levels appear as potential targets for higher prices:
Extension Target Price
1.272x 1.093 euros
1.414x 1.113 euros
1.618x 1.135 euros
2.0x 1.190 euros
2.618x 1.276 euros
3.618x 1.412 euros
4.236x 1.495 euros
The 1.093 to 1.135 euro area may act as the first meaningful resistance zone and a take-profit target for traders. Breaking above 1.05 euros with strong volume is necessary to confirm continued upward movement.
The drop in INTRALOT’s stock was mainly technical, without a fundamental cause, and likely resulted from mass margin calls. The rapid recovery and technical indicators support stabilization and the potential for further upside. The 1.05 euro level remains critical. Fibonacci levels point to significantly higher price targets starting at 1.093 euros and potentially reaching 1.276 to 1.412 euros in the medium term. AKTOR Group Sets New Highs in Growth - A Year of AccelerationAKTOR Group is closing 2025 with a momentum rarely seen in the Greek business landscape. Activity has gone into overdrive across all key production pillars. From construction and concessions to energy and real estate, the Group presents a picture of full mobilization, with simultaneous investments, new agreements and expansion into markets that are expected to reshape the landscape of the coming decade.
At the same time, the share is trading at the best levels in its history. New highs, strong inflows and constant signs that the stock is on the radar of major institutional investors. The market is pricing in that the Group’s next moves will play a central role in the infrastructure sector, in energy and in concessions, where AKTOR now holds a position of strength. Interest is peaking, as everyone is waiting for announcements of new deals and acquisitions just before the end of the year.
The picture that emerges is clear. AKTOR Group is at the most productive and strategically critical point of its trajectory and appears ready to seize every opportunity the market has to offer.
A landmark move: The bond issue of up to €140 million and funding growth
The first bond issue in the Group’s history is far from a routine move. It is a sign of maturity, strategic freshness and determination to take expansionary steps. The prospectus was approved on 3 December and paves the way for raising up to €140 million.
The largest part, up to €111.9 million, will be directed to investments in PPPs, concessions, infrastructure projects, RES and real estate. These are sectors that already deliver strong returns but at the same time require a solid financial base in order to scale up. The remaining amount, up to €24.3 million, will be used to repay existing debt, further strengthening the Group’s capital structure and supporting clean growth.
Choosing a public bond was no accident. Management judged that the timing is ideal, with strong demand, a stable investment climate and rising opportunities in the projects market. The market appears to be rewarding the move, as the issue has sparked intense interest from institutional investors who are closely monitoring the Group’s transformation into a fully integrated player in the infrastructure and energy markets.
Targeting revenue above €3 billion and EBITDA of €460 million by 2030
The five-year business plan drawn up in 2024 and updated in 2025 sets the tone. The Group aims for sales of more than €3 billion by 2030, with adjusted EBITDA of over €460 million. The target does not concern only the historic construction division. The plan is built on a multidimensional expansion into energy, PPPs, real estate and facility management.
Management now has a fully integrated structure that extracts value from every business unit. Energy is emerging as a key pillar, while LNG adds a new, high-growth segment with international links and long-term contracts that provide revenue visibility.
Following the creation of ATLANTIC – SEE LNG TRADE and the agreements with Ukraine, Romania and American companies, the plan is expected to be revised even higher. Revenue flows from LNG are already projected as of 2026, while the recent contracts can significantly boost the Group’s figures.
Construction: The core remains strong and is expanding
Construction continues to be the backbone of revenue, with AKTOR controlling roughly 30% of the project backlog in the Greek market. In the second half of 2025 the Group undertook new projects worth €117 million, while the acquisition of ENTELEXEIA significantly strengthens its position in electromechanical works and in power and fiber-optic networks.
The networks market is expected to absorb more than €1 billion in the coming years. Strengthening this segment opens a new line of activity, more technical and more stable in pace than traditional infrastructure projects.
The target for 2030 sets construction revenue at €2.585 billion. AKTOR is investing in human capital, know-how and new directions in the sector, with an emphasis on green infrastructure, energy upgrades and smart city applications.
RES: A €1.4 billion investment program that changes the Group’s profile
In the energy space, AKTOR Group is making the biggest leap in its history. The €1.4 billion investment plan for RES projects totaling 1,300 MW by 2028 makes the Group one of the frontrunners in the energy transition.
Today it holds a portfolio of permits exceeding 2.4 GW, of which 1.35 GW are RES projects and about 1 GW energy storage projects. Storage, which is the key to the new energy system, is entering the business model dynamically. Construction is already under way on three storage stations with total capacity of 100 MW and an investment over €60 million.
For the period 2025 to 2030, the plan foresees RES sales of €167 million and EBITDA of around €135 million. These figures can be revised upward if the new acquisitions currently in progress are completed.
LNG: A major entry into a high value-added international market
Entering the LNG sector is a strategic choice with global prospects. ATLANTIC – SEE LNG TRADE, 60% owned by the Group and 40% by DEPA Commercial, has already secured the first long-term contract for the purchase and sale of US LNG with Venture Global.
At the same time, large agreements have been signed with Naftogaz, Nova Power and Transgaz for LNG supply over 20 years, from 2030 onwards. The company has also undertaken the role of implementing the DEPA – Ukraine agreement, which will generate revenues as early as December 2025.
Expansion into LNG gives the Group access to high-value energy markets, stable contracts and international capital flows. This new segment can become one of the main growth pillars of the next decade.
PPPs and Concessions: A sector in transformation
The PPP and concessions segment was significantly strengthened with the acquisition of AKTOR Concessions. Today the Group holds stakes in 16 projects and is bidding for all major projects of the coming years.
The portfolio includes infrastructure works, building projects, transport corridors, hydraulic works and logistics investments such as the former Gonos military camp. Management is targeting EBITDA of €79 million from this segment by 2030.
PPPs provide long-term cash flows, stability and low risk. With AKTOR entering key projects and the government aggressively promoting PPP models, the Group enjoys a strong strategic advantage.
Facility Management: A stable, international portfolio
The Group has built a significant presence in facility management, with a portfolio ranging from smart cities and marinas to the Middle East, where it manages metro networks, telecoms infrastructure and large complexes.
Expansion through Oceanic Group and contracts in Qatar and the United Arab Emirates show that the Group can compete with international players in demanding markets. The target for 2030 calls for sales of €175 million and EBITDA of €22 million.
Real Estate: High-quality choices with a focus on sustainability
In real estate, the Group is moving with targeted investments in tourism projects, green buildings and urban regeneration. At the same time, it develops high-quality properties such as the Milos hotel, office buildings with green certifications and staff residences in tourist destinations.
Its activity in social housing and energy-efficient solutions shows that the Group is looking ahead to market needs, which now focus on quality, sustainability and energy savings.
International presence: More than 30% of revenue from abroad
More than one third of the Group’s revenue comes from abroad, with Romania as the key market. Growth there is expected to accelerate thanks to the Recovery and Resilience Facility and major infrastructure programs.
AKTOR has built a presence with depth, consistency and technical reliability. International operations serve both as a safety net and as a field for generating new know-how.
Financial picture 2025: Rising figures and expectations for even better results
For 2025 AKTOR expects revenue of €1.286 billion and EBITDA of €158 million. Net profit is estimated at €22 million, although the market anticipates better results as AKTOR Concessions and ENTELEXEIA are fully consolidated.
The trend is steadily upward. The Group is moving at a pace that suggests 2026 will be an even stronger year. With so many simultaneous announcements in progress, it is expected that in the coming weeks there will be news that could once again change the landscape.
The share at new highs and in the sights of major institutional investors
The Group’s share continues its impressive run, posting new all-time highs and confirming the market’s strong interest. The price stands at €9.50, up €0.07 on the day, corresponding to a daily gain of 0.74%. Returns across all time frames show a stock moving with steady strength and attracting more and more institutional attention. The weekly return comes to 2.48%, the monthly to 12.03%, while over three months the share has risen by 21.79%. Over six months it has soared by 70.86%, and over a 52-week horizon it records an impressive gain of 100.73%. Since the start of the year, total return stands at 96.82%, confirming that the stock is firmly in the sights of major institutional investors who recognize the Group’s pivotal role in construction, energy and concessions. With such a profile, the share now serves as a key barometer for those who want exposure to the new era of Greek infrastructure and the energy transition.  Long
Long
Extra tax on Cypriot bank profits As the year draws to a close, Cyprus is once again entering turbulent political territory. AKEL has revived its proposal for an extraordinary tax on bank profits, insisting that credit institutions must contribute more to the fiscal burden created by soaring inflation and rising interest rates over the past three years. The new bill covers the tax years 2025 and 2026 and introduces a solidarity levy on the portion of net interest income that has increased by more than 40% compared with 2022, taxed at a rate of 20%.
This measure—much like last year—targets Bank of Cyprus first and foremost, as the country’s largest lender and the main focus of political pressure over bank profitability. However, the implications now extend beyond a single institution. Should the proposal pass, Eurobank and Alpha Bank would also be directly affected due to their recent expansion in Cyprus through the acquisitions of Hellenic Bank and Astrobank. Although not the core targets of political scrutiny, any additional tax burden would feed into their consolidated financial results, reshaping their strategic plans in the local market.
What elevates the stakes this time is not just the substance of the tax but the political arithmetic. The same proposal was rejected last year by the narrowest of margins — 25 votes in favour, 25 against, and four abstentions. Even a minor shift in today’s balance could swing the outcome.
The environment is also significantly different for Eurobank and Alpha Bank. Their increased exposure to the Cypriot market means Cypriot taxation is no longer a peripheral consideration but a material component of group-level performance. With both banks still in the process of integrating and restructuring their new subsidiaries, an unexpected tax shock limits their investment capacity, hampers digital transformation plans, and injects uncertainty into long-term capital allocation.
AKEL argues that banks’ recent profit surge stems not from organic growth but from the windfall effects of ECB rate hikes. The party points to a European Commission report showing that similar windfall taxes in Baltic countries did not harm financial stability. Banks, however, counter that they already pay a 0.15% levy on deposits—over €500 million contributed in the last decade—and warn that further taxation could disrupt credit supply and destabilize the operating framework of a small, open economy.
As the bill heads back to Parliament, the outcome is anything but certain. A single vote could again decide whether Cyprus imposes an extraordinary levy on its banking system. If approved, Bank of Cyprus will bear the immediate burden—yet the ripple effects on Eurobank and Alpha Bank may prove equally consequential. If rejected, few doubt the debate will return, fueled by persistent social pressure and ongoing scrutiny of bank profitability.  Short
Short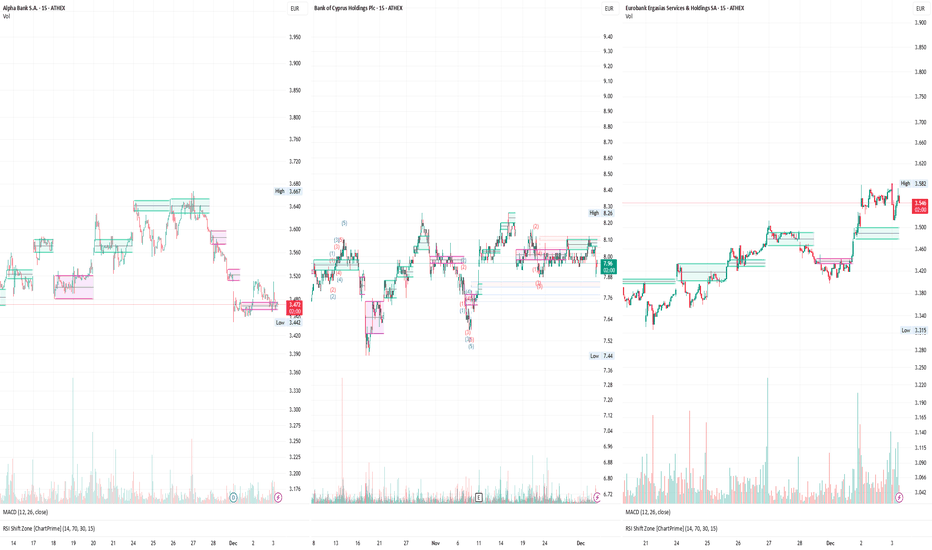
GEK TERNA Group: Powerful H1 2025 PerformancGEK TERNA Group: Powerful H1 2025 Performance Driven by Concessions and Construction
Athens, September 10, 2025 – GEK TERNA Group posted a commanding first-half performance in 2025, powered by record-breaking earnings, robust activity across all segments, and a major boost in profitability. The numbers confirm the company’s strategic focus on infrastructure, concessions, and energy is delivering strong, sustainable results.
Revenue surged 44% year-over-year to €1.96 billion, while adjusted EBITDA jumped 84% to €317 million, reflecting a better mix of high-margin projects. Adjusted net profits rose 24% to €68 million, or €0.68 per share, from €55 million and €0.56 per share a year ago.
The Group’s pre-tax earnings reached €87 million, up 50% from the same period in 2024, driven by increased profitability in both its core concessions and construction activities. EBITDA margin rose to 16%, compared to 12% in H1 2024.
Concessions Take the Lead
The concession segment was the engine of growth, accounting for 53% of the Group’s total EBITDA. Revenues from concessions more than doubled, while adjusted EBITDA in the segment jumped 114%, reaching €167 million. This growth was driven by higher vehicle traffic across all toll roads and the inclusion of the Attiki Odos concession, which alone contributed €89 million in EBITDA during the period.
Traffic volume increased 4.6% on Attiki Odos, 7.5% on Nea and Central Odos (thanks to new segments being opened), and 3.5% on Olympia Odos. These assets now form the foundation of GEK TERNA’s recurring revenue streams, offering long-term cash flow visibility.
Additional projects, including the Egnatia Odos, the Kasteli Airport, and several water and waste management concessions, are expected to further enhance earnings starting in the coming periods.
Construction Segment Scales Up
Construction revenues increased 41% to €813 million, while segment EBITDA rose 49% to €89 million. The uptick reflects an acceleration in project execution and the launch of several new developments.
As of June 30, 2025, the Group’s signed construction backlog hit a record €6.3 billion, up from €4.1 billion at year-end 2024. Notably, around half of this backlog comes from GEK TERNA’s own investment projects, which the company characterizes as lower-risk and higher-quality assets. The pipeline is expected to grow even further as the Group awaits final contract signatures on several awarded tenders.
Energy: Steady Profitability Amid Market Volatility
In energy and natural gas, GEK TERNA maintained positive momentum despite ongoing market pressures. Demand for electricity in Greece rose just 0.6% during the first half, but wholesale prices climbed 37% year-over-year, largely due to higher natural gas prices earlier in the year.
In the power supply segment, HERON Energy preserved market share, despite a slight dip in volumes driven by reduced industrial sales. On the production side, the HERON plant generated 0.7 TWh, a marginal decrease due to planned maintenance.
Meanwhile, the new combined cycle gas plant in Komotini entered trial operation, while the HERON I plant in Crete—developed for Public Power Corporation (PPC)—came online. The completion of the Crete project contributed positively to segment earnings.
Strategic Deal with Motor Oil Reshapes Energy Division
A key development in the Group’s energy strategy is the newly announced joint venture with Motor Oil, under which both companies will merge their respective energy businesses into a new 50/50 enterprise. This move creates a vertically integrated energy platform with strong production assets and a sizable customer base.
The transaction, pending regulatory and shareholder approvals, is expected to close in early 2026. GEK TERNA will receive €128 million in cash upon completion of the deal. The combined entity is positioned to accelerate growth and lead Greece’s energy transition with a highly competitive footprint.
Strengthened Financial Position
GEK TERNA continues to improve its financial resilience. Adjusted net debt at the parent company level fell to €117 million, down from €153 million at the end of 2024. Group-level adjusted net debt also declined, from €3.26 billion to €3.12 billion.
The Group closed the half-year with €1.46 billion in total cash, including €748 million at the parent company level. The reduction in cash reserves reflects the full repayment of a €120 million bond (KOD 2018) earlier in the year, reinforcing the Group’s commitment to disciplined capital management.
Looking Ahead
GEK TERNA’s performance in the first half of 2025 paints a picture of a diversified, cash-generating group firing on all cylinders. With its concession portfolio now driving the majority of earnings, a deep and expanding construction pipeline, and a strong position in the energy transition through its Motor Oil joint venture, the Group is well-positioned for continued growth.
The second half of the year is expected to bring further progress across all fronts—especially as more concession projects become operational and energy sector synergies begin to materialize. The numbers tell the story: GEK TERNA is not just growing—it’s building a platform for long-term, sustainable value.  Long
Long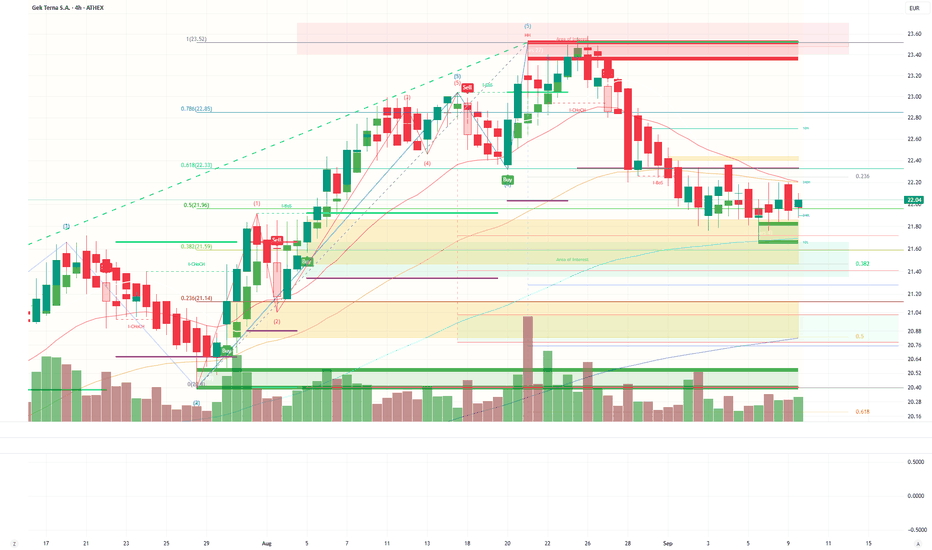
Lamda Development’s Landmark €450 Million Deal with ION GROUP: AThe announcement of a €450 million strategic agreement with global financial software powerhouse ION GROUP for the development of the International Research & Innovation Center at Hellinikon marks a true milestone. It is a transaction that redefines the landscape, creates hundreds of millions in value, and could immediately translate into a €1.50–€2.00 upside per share for Lamda Development (LAMD.AT).
Let’s break down why.
Lamda is selling ION approximately 250,000 sqm of developed land on Vouliagmenis Avenue for €450 million – translating into an implied valuation of about €1,800 per sqm.
Here’s why this is a brilliant deal: this specific area was originally designated for a future Business Park scheduled to start in 2032 and be completed by 2035. In other words, Lamda would have had to wait a decade before seeing any cash flows.
Even more importantly, this land is recorded in Lamda’s books at a much lower valuation – around €650–€700 per sqm, significantly below the transaction price. This implies an accounting gain of €280–€300 million, pure value creation that will ultimately flow through the company’s results and substantially boost profitability.
In essence, this deal delivers both liquidity and a powerful injection of fair value gains. It strengthens the balance sheet, increases equity, and establishes a higher valuation base for the stock.
With a current market cap of just €1.25 billion and a share price of €7.12, Lamda has been severely undervalued. This single transaction alone supports a rerating toward €8.50–€8.80 per share, implying an immediate 20%–25% upside – and that’s only the beginning.
Beyond ION’s €450 million payment, the deal creates a new ecosystem within Hellinikon:
50,000 sqm of office space, set to attract multinationals and start-ups, ensuring recurring rental income.
A 1,000-seat amphitheater, designed as a hub for global conferences and events, boosting Hellinikon’s international visibility.
200,000 sqm of residential units, housing 2,000 professionals from 40+ countries, driving demand across retail, leisure, dining, and services.
This translates into new income streams, higher foot traffic, and rising valuations across the broader Hellinikon development, while also positioning the project to attract additional global corporations seeking prime office space.
Additionally, ION GROUP has acquired a 2% equity stake in Lamda Development, a strong vote of confidence that could be scaled up in the future. A global software and technology player of this caliber does not invest lightly. It signals to international markets that Hellinikon is not a local project but a global hub.
ION’s total investment in the Research & Innovation Center is projected to exceed €1.5 billion by 2030, placing Hellinikon on the map as a European focal point for artificial intelligence and digital transformation. This will attract further foreign capital, lift land values, and enhance Lamda’s brand equity on a global scale.
Let’s not forget that Lamda already holds a robust balance sheet with €652 million in cash reserves, ensuring strong liquidity for future developments. Furthermore, Q2 2025 results are expected to show an additional €30 million in accounting gains from new property sales, proving that Lamda is already generating multiple sources of profitability.
From a technical perspective, our long-term chart analysis had already pointed to a major breakout following the upward resolution of an 18-year triangular “T” formation. The stock is now positioned for a strong upside move, potentially targeting €9.50 per share. The lower wicks on the last two 80-day candlesticks signaled that buyers were preparing to launch their next wave of attack – and the ION deal may well be the catalyst.
Bottom line: Lamda Development’s deal with ION GROUP is more than a property sale – it’s a transformational event that reshapes the Hellinikon project, re-rates the company’s valuation, and positions the stock for significant upside in the months ahead.  Long
Long
TITAN Cement: Low Leverage, High PotentialTITAN Cement: Low Carbon, Low Debt, Low Price — But for How Long?
The Greek cement giant TITAN (TITC) is quietly building momentum. Despite a flat top line (+0.4% revenue YoY in H1 2025), TITAN grew EBITDA by 2% to €286.9M, boosted by cost control and a strategic shift to alternative fuels. In Greece, EBITDA soared 20% on the back of construction activity and expense discipline.
The group’s net debt plummeted from €622M to €137M in just six months, with a Net Debt/EBITDA ratio of 0.2x—unlocking major optionality for M\&A, dividends, or buybacks.
But what really stands out?
- ESG Competitive Moat: TITAN leads in low-carbon cement (CEM IV), positioning itself ahead of regulatory curves across the EU. Alternative fuels now account for 40%+ in some regions.
- Valuation Disconnect: The stock trades at just 4.7x EV/EBITDA, while ESG peers sit at 6–7.5x. A rerating could imply up to 60% upside.
- Strong Catalysts Ahead:
1. U.S. housing rebound in 2025–26 (Titan America exposure)
2. Buybacks/dividend hike due to surplus cash flow
3. Entry into EU/EIB-funded green projects
4. Second IPO or spin-off of Titan America or ESG vertical
5. Technical Setup:
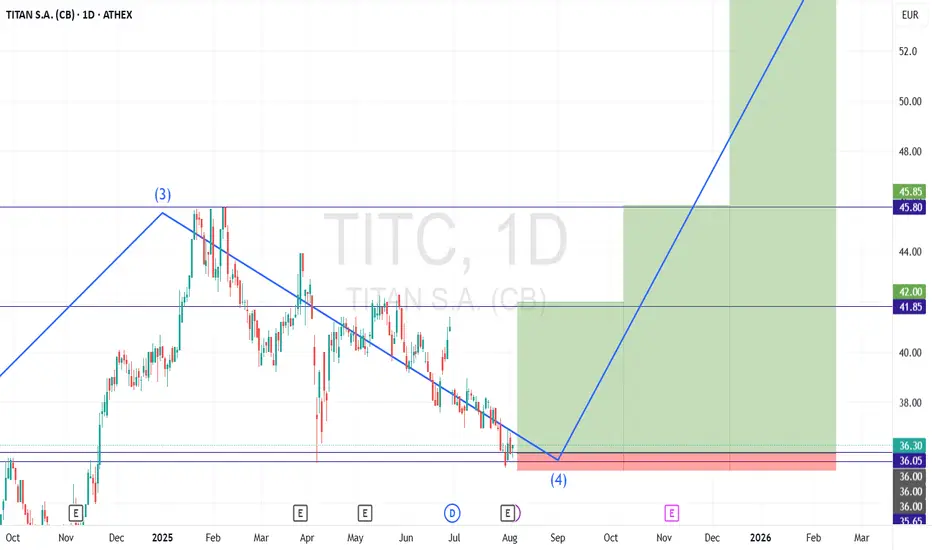
i) Price is testing long-term ascending channel support (€34.30–€35.50), with a potential upside target of €55.30 (+52%).
ii) Currently in Wave 4 of the Elliott Wave cycle on the monthly timeframe, suggesting a potential Wave 5 rally ahead.
iii) Entering a key value-buying zone — the same price region where the April 2025 bullish rally was initiated.
Conclusion: TITAN is underpriced, under-leveraged, and ESG-ready. The next 6–18 months could unlock major revaluation.
Ticker: TITC
Watch Zones:
- Entry Area: €34.30–€35.50 (support)
- SL Area: €35-€35.30 (below latest swing low)
-TP1 Area: €42 (target 1 - Previous consolidation levels) - R:R 8.57
-TP2 Area: €45.85 (target 2 - Previous Highs) - R:R 14.07
-TP3 Area: €55 (target 3 - According to EV/EBITDA Multiples) - R:R 27.07
-Return: From 16.67% to 52.64%
Happy Profits to everyone!!
At your disposal for any questions!!
THE GREEK TRADER
 Long
Long
OTE: Stock Breathes Again After Romania Exit OTE: Stock Breathes Again After Romania Exit – Strong Support from AXIA – Bullish Rebound from Key Support Zone (TECHNICAL ANALYSIS)
KONSTANTINOS GKOUGKAKIS – July 30, 2025, 07:31
Romania is over, shareholder returns are next. OTE’s strategic exit from the loss-making Romanian mobile market (Telekom Romania Mobile) gives the Group renewed momentum. AXIA Ventures sees clear positive impact on liquidity and OTE’s investment profile.
A Move the Market Was Waiting For
The green light from Romanian authorities for the sale of Telekom Romania Mobile (TKRM) didn’t come as a surprise—but the market reaction revealed how eagerly it was anticipated. For years, OTE was trapped in a challenging investment in Romania. Now, the Group breathes easier, freeing itself from a burden that dragged down cash flows, operations, and stock dynamics.
What AXIA Says – Capital Relief, Liquidity and Shareholder Rewards
AXIA Ventures is clear and direct: the deal will have a positive effect on free cash flow and capital returns to shareholders. AXIA estimates an immediate cash flow benefit of €10 million for 2025, with €20–30 million annually thereafter. At the same time, they foresee a €40–50 million increase in shareholder capital returns, translating to at least a 10% boost in total yield to shareholders for 2025.
Cash Flows Without TKRM – OTE Gets Breathing Room
TKRM was expected to have a negative €70 million cash flow impact in 2025—a figure already baked into OTE’s guidance of €460 million free cash flow, of which €451 million (or 98%) is planned for distribution:
€298 million in dividends
€153 million in share buybacks
With the Romania exit, OTE gains a fresh window for special capital returns beyond what’s already planned. Management has confirmed that any additional net cash benefit from the transaction will be returned to shareholders, reinforcing market confidence.
A Costly Chapter Closes – The Numbers Speak
TKRM came at a high price. In 2024 alone, the subsidiary posted €143 million in losses, adding to a decade-long total exceeding €440 million. Equity was wiped out, and the operation was sustained only by Group funding. While the sale doesn’t command a high price tag, it helps avoid hundreds of millions in future losses and unlocks a tax credit of over €100 million, according to AXIA.
The total estimated benefit stands at €560 million—or €1.39 per share.
Stability and Strategic Clarity
OTE stock needed a catalyst like this. Despite solid fundamentals and international momentum, the uncertainty around TKRM was a drag. Now, the picture is clear:
Strategic cleanup is complete
Focus shifts fully to profitability and Greece
The investment story becomes positive, predictable, and scalable
No surprise that AXIA maintains a “buy” rating with a €19.5 price target. Similarly, NBG Securities sees a 29% upside (targeting €19.8), calling OTE an “ideal pick for defensive portfolios.”
A Two-Step Deal – Vodafone and Digi Split the Assets
The Romanian deal involves two separate transactions:
Digi Communications will acquire TKRM’s prepaid mobile customers, spectrum licenses, and part of the base station infrastructure.
Vodafone Romania will acquire the rest of TKRM’s equity, excluding 7 shares owned by Radiocomunicații.
Final closing is pending approval from ANCOM (Romanian telecom regulator) and is expected within Q3 2025.
The Bigger Picture: OTE on a New Trajectory
The Romania exit is part of a wider strategic transformation. OTE is betting on technological leadership, leveraging the global Telekom brand, and targeted capital returns.
COSMOTE leads with 70% 5G SA coverage and 99% total population reach.
Investments in FTTH, FWA, AI-RAN, and MagentaONE build an integrated digital services ecosystem.
Srini Gopalan’s “un-carrier mindset” strategy signals OTE is no longer playing defense—it's attacking with tech and international scale.
Why Now? Why This Way?
Simple answer: it had to happen. The Romanian mobile venture had failed. Exiting now—while tough at first—paves the way for better capital allocation, higher returns, and strategic clarity.
The market got the message. AXIA confirmed it. And the stock finally took the breather it needed to restart its climb.
OTE Technical Analysis – July 30, 2025
Short-Term Picture: Bullish Reaction from Strong Support Zone
OTE stock shows clear signs of recovery after a period of pressure. Accumulation around €15.00–15.20 created a solid support base, confirmed by Buy signals and strong green volume spikes.
The current price sits at €15.83, posting a +0.44% daily gain, and approaches the critical 0.5 Fibonacci retracement level at €16.12—a key intermediate resistance between the low of €15.02 and the high of €17.89.
Fibonacci Retracement Levels
0.382 at €15.79: already breached (bullish sign)
0.5 at €16.12: immediate resistance
0.618 at €16.45: strong resistance level; a break here could lead to retesting €17.00–17.80
A clean breakout above €16.12 would be a bullish confirmation, targeting €16.80–17.20.
MACD – Momentum Strengthening
The MACD is turning bullish:
MACD Line: -0.0188, rising toward
Signal Line: -0.0884
Histogram: +0.0696, indicating momentum buildup
A bullish crossover is expected soon, reinforcing the positive bias.
RSI – No Overbought Signals, Room to Rise
The RSI is at 59.91, not yet in overbought territory, suggesting room for further gains before any pullback. The RSI-based moving average sits at 45.53, confirming upward momentum.
Exponential Moving Averages (EMA)
EMA 20: €15.50
EMA 50: €15.72
EMA 100: €15.97
EMA 200: €15.93
Price is currently above all major EMAs, reinforcing the bullish scenario. A possible Golden Cross could materialize on the 4-hour chart. Staying above EMA 100 (€15.97) will be key.
Volume – Breakout Confirmed by Strong Demand
Volume surged significantly during the breakout above €15.60, validating buyer interest. Green bars dominate the latest sessions, showing a shift in sentiment and confirming demand.
Momentum with Structure, But Watch Key Zones
OTE’s stock has entered a positive momentum phase, with several technical indicators (MACD, RSI, Fibonacci) pointing to potential continuation. Recent news about the TKRM sale adds fuel.
Still, the €16.12–16.45 zone is critical. A clean breakout on strong volume could lead to a full recovery of June’s losses and pave the way for new 2025 highs.  Long
Long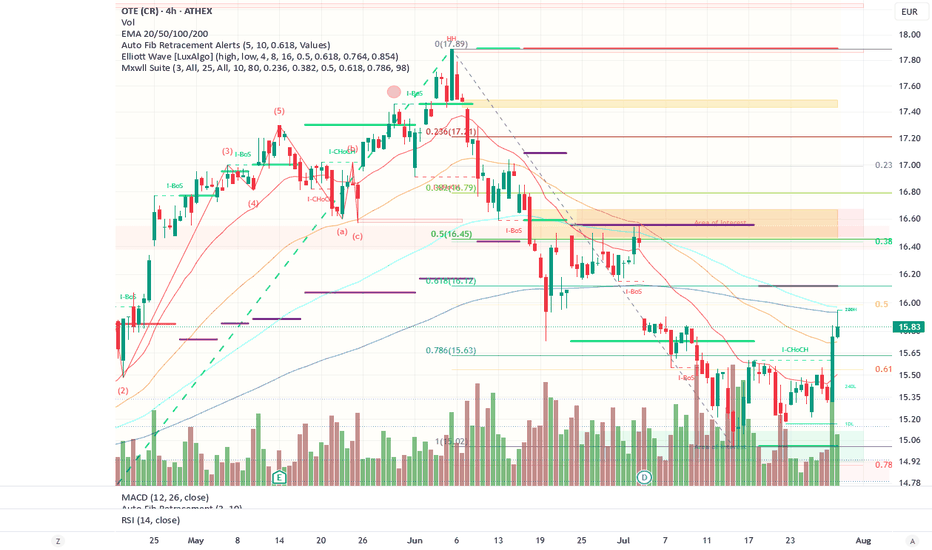
UniCredit: One Step Away from 30% in Alpha Bankhe relationship between UniCredit and Alpha Bank is reaching a turning point, as all indications suggest the Italian banking giant is accelerating its push to acquire more than 30% of the Greek systemic lender. If confirmed, the move would not only make UniCredit the dominant shareholder but also allow it to fully consolidate Alpha’s earnings under IFRS standards.
After acquiring the stake held by Dutch investor Rob Holterman, UniCredit brought its holding close to 20%. Following stalled merger talks with Germany’s Commerzbank and Italy’s Banco BPM, attention has now firmly shifted to Greece. Athens is becoming a strategic hub, and Alpha Bank the key growth vehicle.
The timing aligns with UniCredit’s record Q2 2025 profits (+25%), supported by strong liquidity and capital. Behind-the-scenes efforts are reportedly underway, potentially involving secondary market purchases or private deals with current shareholders.
Technical Analysis
Alpha Bank’s stock (ATHEX: ALPHA) trades at €3.186, currently in a corrective phase after completing a strong five-wave bullish cycle peaking at €3.384. A clear A-B-C retracement has followed, with support emerging near €3.17, confirmed by high-volume buying. The stock faces key resistances at €3.245 and €3.28 (Fibonacci 0.382 & 0.5 levels), which it must reclaim to reverse the short-term downtrend. Failing that, a break below €3.17 could trigger further downside. Market structure shifts (CHoCH, BoS) suggest high sensitivity to any new buying pressure. Investor sentiment around UniCredit’s strategic intentions may be the catalyst for the next major move. Long 
Aegean: The cheapest airline in Europe?Aegean is flying high, but the stock remains grounded at -71.5% – The market values it at just 28.5% of its real worth: The cheapest airline in Europe?
Aegean: Time for the Market to Wake Up
We’ve said a lot about Aegean. About its stock going nowhere, about how it's been ignored by the market, about how it just refuses to move. Sure, some of that skepticism is understandable—geopolitical risk, a volatile global landscape, travel disruptions. But at some point, we need to look at the numbers.
Because this isn’t just another airline stock. Aegean is sitting on assets worth over €4 billion. And its current market cap? Just €1.14 billion.
Do the math: that's a 71.5% discount — the stock is trading at only 28.5% of what the company is worth on paper.
If that’s not undervalued, what is?
60 Aircraft, €4 Billion in Investment
This isn’t hype — it's hard investment. Aegean has committed to 60 Airbus A320/321neo aircraft by 2031, with a total fleet investment reaching $4 billion. The two newest additions, the A321neo XLRs, have a flight range of over 10 hours. That opens the door to long-haul destinations far beyond Europe — like India, the Maldives, Nairobi, and more.
In fact, direct flights to India are already scheduled to start in March 2026, ahead of the original plan. This isn’t about just growing the fleet — it’s a shift in scale, reach, and ambition.
Meanwhile, Aegean has already received 36 of the 60 aircraft. The buildout is real. And it’s happening now.
An Airline Investing in Itself
Aegean isn't just growing in the air — it’s building on the ground. It has launched maintenance and training facilities, is servicing third-party aircraft, and is investing heavily in talent and education.
From 1,878 employees in 2013 to nearly 4,000 today. Dozens of scholarships. A full ecosystem of aviation infrastructure is taking shape — one that positions Aegean not just as an airline, but as a regional aviation hub.
How is all of that still being missed on the board?
The Market Is Rallying – Aegean Is Not
While the Athens Stock Exchange hits 15-year highs, and large caps are breaking records, Aegean’s stock is standing still.
It’s one of the few big names that hasn’t made a move — and that makes it a prime candidate for a snap revaluation.
All it needs is a spark — a catalyst. A major deal. A re-rating. A surprise quarter. Something to jolt the market awake. And when that happens, it won’t be slow or gradual. It’ll be violent and vertical.
Geopolitics? Sure. But Everyone’s Facing It
Yes, global tensions are high. Wars, inflation, airspace closures, unpredictability. But every airline is in the same storm. What matters is how you build resilience. And Aegean has done that.
It emerged from the COVID crisis leaner, stronger, more focused. While others pulled back, Aegean doubled down. That’s not weakness — that’s conviction.
Why the Discount Still Exists
The short answer: the market hasn't connected the dots.
The new fleet hasn’t been fully priced in.
The strategic expansion hasn’t registered.
The infrastructure buildout hasn’t translated into market value.
Investors are still judging it on short-term P&Ls — not on what it’s quietly turning into.
Time for That to Change
It’s time for the market to take another look. To see the €4 billion in assets not as a future maybe — but as a real foundation for growth. To recognize the international pivot. To price in the hidden strength.
Aegean has the fundamentals. It has the vision. It has the operational edge.
What it doesn’t have — yet — is the recognition on the board.
But that’s coming. And when it comes, the move won’t be subtle.
Aegean is undervalued. Not just theoretically, but blatantly — with a 71.5% discount staring everyone in the face. The business is solid. The growth is real. The investments are in motion.
The market will catch up. The only question is: will you be in before it does?
Long 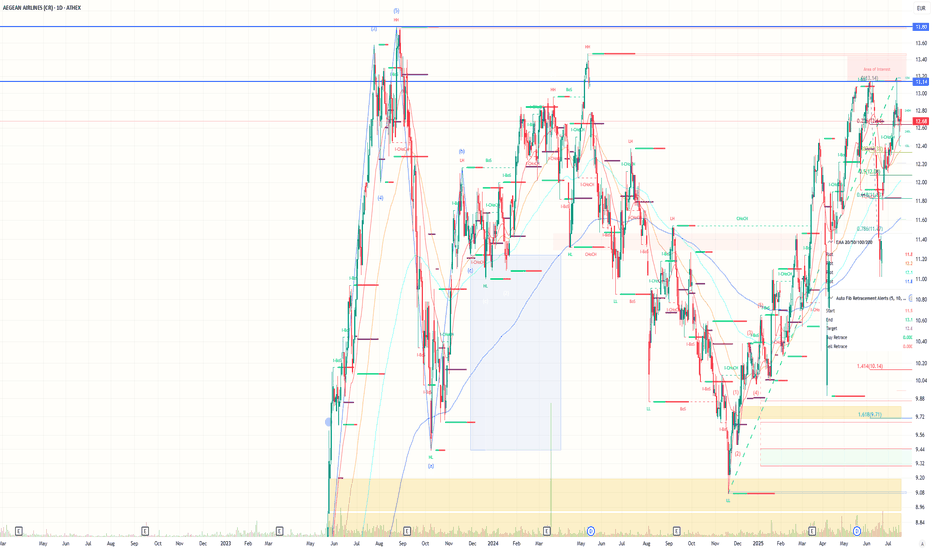
AKTOR HOLDING – Bullish Breakout with Strong MomentumPrice Action Overview
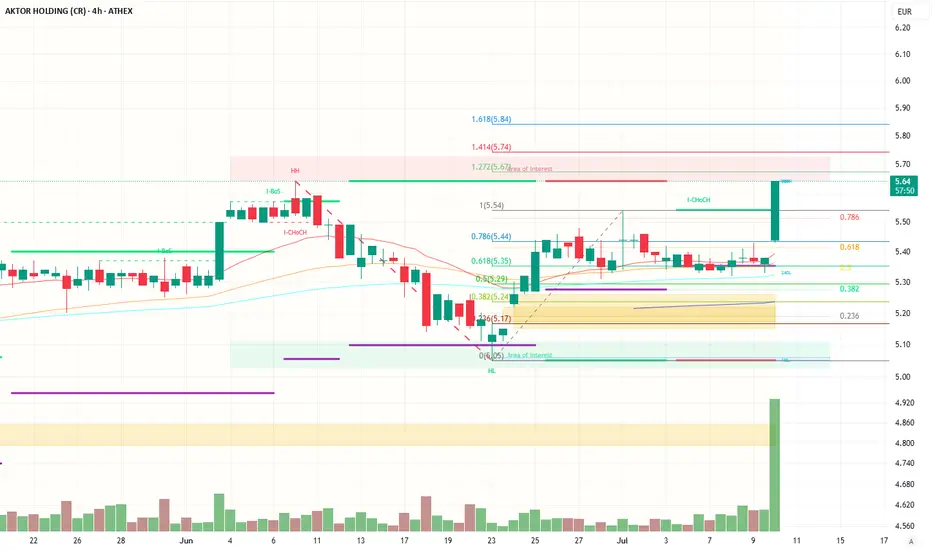
The stock is currently trading at €5.63, up +4.65%, with a strong bullish candle and a significant increase in volume, suggesting strong buying interest.
A clear bullish breakout has occurred from a consolidation zone near the €5.30–€5.40 range.
Key Fibonacci Levels
From the Fibonacci retracement drawn:
The stock retraced to the 0.0 level (€5.05) and formed a higher low (HL)—this is a bullish signal.
After reclaiming the 0.618 retracement level (€5.35) and 0.786 (€5.44), the stock has broken above the previous high (€5.54), confirming bullish momentum.
Extension Levels:
1.272: €5.67 – recently surpassed.
1.414: €5.74 – short-term resistance.
1.618: €5.84 – potential mid-term target if the trend continues.
Market Structure
I-CHoCH (Internal Change of Character) marked after a pullback.
Followed by CHoCH (Change of Character) confirms the transition from bearish to bullish trend.
Strong higher low (HL) and new higher high (HH) structure visible.
Support & Resistance
Immediate resistance: €5.67 (1.272 Fib extension), then €5.74 and €5.84.
Support: €5.44 (0.786 Fib), then €5.35 (0.618 Fib), and major support at €5.05 (previous swing low and area of interest).
Volume Analysis
Sharp volume spike on the breakout candle is very bullish. This indicates institutional or strong retail participation.
The volume confirms the validity of the breakout.
Trend Indicators
Moving averages (likely EMA20, EMA50, EMA100 based on color) are sloping upward.
Price has decisively broken above all key MAs, indicating a strong uptrend.
Bias: Bullish.
Near-term target: €5.74 (1.414 extension), possibly €5.84.
A pullback to €5.44–€5.54 could offer a buy-the-dip opportunity.
A break and close above €5.74 would open the way for continuation to €5.84 and beyond. Long 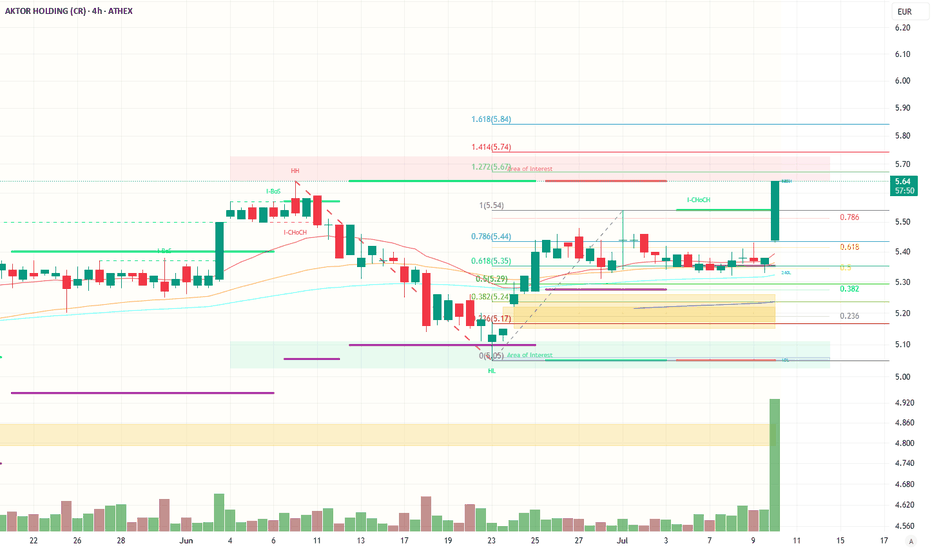
Quest Holdings: A Strategic Pivot and the Prospect of ShareholdQuest Holdings: A Strategic Pivot and the Prospect of Shareholder Returns
**ATHENS, GREECE** – Quest Holdings (ATH:QUEST) has been a standout performer on the Athens Stock Exchange, with its share price demonstrating a significant upward trend over the past year. This rally is underpinned by the company's solid financial performance across its diverse segments and, more recently, by a strategic move that has unlocked substantial value: the sale of a stake in its successful courier subsidiary, ACS. Now, investors are keenly anticipating what the company will do with its bolstered cash position, with many eyeing a potential, significant capital return.
Strong Performance and Strategic Growth*
Quest Holdings has consistently delivered robust results, showcasing growth across its primary business pillars: IT services (Uni Systems), commercial activities (Info Quest Technologies, iSquare), and green energy. The group's ability to expand its IT services internationally and capitalize on the strong demand for digital transformation projects has been a key driver of its profitability. For 2025, the company projects continued revenue growth and an even higher growth rate for its operating profitability (EBITDA), which is expected to surpass €100 million.
This solid operational performance has provided a strong foundation for the stock's appreciation, which has seen its price rise by over 40% in the last 12 months, hitting new 52-week highs in early July 2025.
The Game-Changing ACS Deal
The most significant catalyst for Quest's recent momentum was the strategic agreement announced in late 2024 for its courier services arm, ACS. Quest Holdings agreed to sell a 20% stake in ACS to General Logistics Systems (GLS), a major European parcel and express service provider and a long-term partner of ACS.
Key details of the transaction:
* **Sale Price:** The 20% stake was sold for a consideration of approximately €74-€77 million.
* **Call Option:** Crucially, the deal includes a call option for GLS to acquire the remaining 80% of ACS shares. This option can be exercised on either October 31, 2025, or October 30, 2026.
* **Valuation:** The agreement implies a minimum valuation of €370 million for 100% of ACS, a figure that crystallizes the significant value Quest has built in the courier business over 25 years.
This deal was a strategic masterstroke. It not only brought a substantial cash injection into Quest Holdings but also secured a powerful strategic partner for ACS, ensuring its continued dominance and growth in the Greek market with planned investments in sorting centers, electric vehicles, and digital transformation.
Anticipation of a Capital Return
The successful sale of the ACS stake has significantly strengthened Quest's already healthy balance sheet. At the end of 2024, the group boasted a net cash position of €82 million, fortified by the proceeds from the deal. This has given the management ample firepower for new investments, such as the recent acquisition of a majority stake in the home appliance company Benrubi.
However, the key question on every investor's mind is shareholder remuneration. With such a strong cash position and the prospect of an even larger windfall if GLS exercises its option to buy the remaining 80% of ACS, the market widely anticipates a generous capital return.
Analysts covering the stock have already begun to factor this into their models. Some reports suggest the possibility of a **special dividend** distributed from the proceeds of the initial 20% sale, on top of the company's regular dividend payout. Quest has a track record of rewarding its shareholders, and the current financial strength provides a solid basis for such a move.
Outlook: A Value Proposition
Even after its recent rally, many analysts believe Quest Holdings remains attractively valued. When stripping out the implied €370 million valuation of ACS from the group's total enterprise value, the remaining core businesses—particularly the high-growth IT services and the margin-accretive commercial activities—appear to be trading at a compelling discount compared to their peers.
The combination of:
* Consistent growth in core operations.
* A strategic, value-unlocking deal with ACS.
* A robust balance sheet with a strong net cash position.
* The high probability of a significant capital return to shareholders.
...presents a powerful investment case. As the October 2025 deadline for the first GLS call option approaches, all eyes will be on Quest Holdings, not just for its operational performance, but for its next move in rewarding the shareholders who have supported its successful journey.  Long
Long
 Long
Long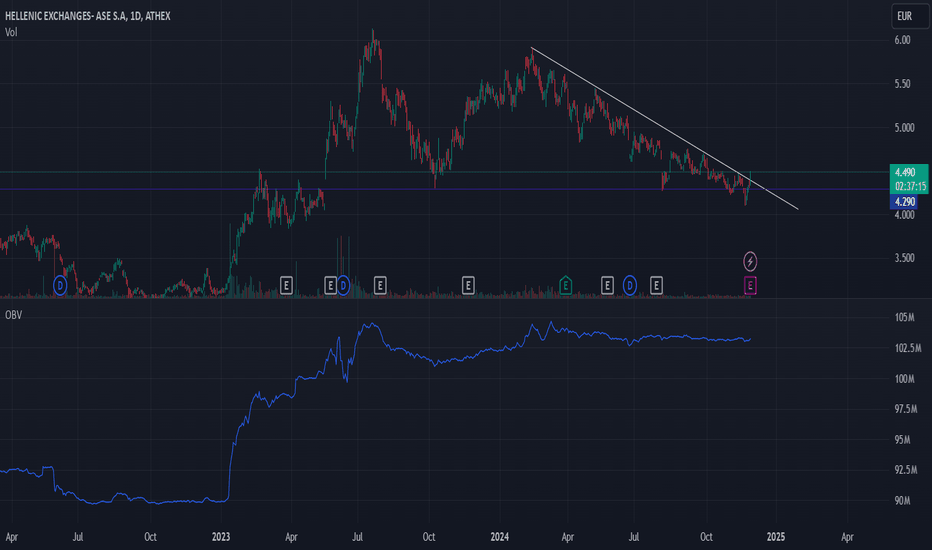
GEK TERNA: The Investment Gem Yet to Shine TP: 27,4€Despite explosive growth in operating profitability, strategic participation in infrastructure projects, and consistently improving financials, GEK TERNA’s stock remains undervalued—failing to reflect either the group’s current position or, more importantly, its future prospects. With a target price of €27.4 and a current price around €19, the stock offers over 43% upside, according to Axia Research. Yet, the market still hasn't priced in one of the most steadily growing names on the Athens Stock Exchange.
Strong Start to 2025
GEK TERNA posted a robust Q1 2025 performance, beating expectations. Revenue rose 49% to €989.4 million, and adjusted EBITDA surged 55.1% to €135.5 million. Despite increased depreciation and higher financial expenses, net profit came in at €26 million, almost on par with Q1 2024’s €27.1 million.
This strong performance was mainly driven by concessions and construction. The full consolidation of Attiki Odos played a key role, while construction activity benefited from a massive backlog of €6.7 billion. Notably, about 52% of this backlog involves projects where GEK TERNA is also an investor, securing dual revenue streams and increased efficiency.
Attiki Odos and the 9% Yield
One of GEK TERNA’s most strategic moves was acquiring Attiki Odos. This asset is not just capital-intensive but operationally critical, offering stable, predictable cash flows with high yield. According to the company, €60 million in cash distributions are expected in 2025. Given GEK TERNA’s equity investment of €670 million, this implies a 9% cash yield.
Moreover, under the agreement with Latsco to sell a 10% stake in Attiki Odos, the deal value is €80 million—highlighting the asset's attractive return profile, low risk, and strong liquidity.
Construction Margins at 13.5%: A Rare Feat
Construction remains a cornerstone for GEK TERNA, not just in terms of project volume but also margins. The EBITDA margin in Q1 reached 13.5%, up 230 basis points year-over-year. This performance significantly exceeds industry averages, largely due to projects with GEK TERNA’s own equity participation, boosting overall profitability.
Axia describes construction performance as “strong and sustainable,” forecasting continued earnings momentum in the coming quarters.
Energy Segment Withstands Pressure
Despite pricing pressures and stiff competition in the electricity market, GEK TERNA increased operating profitability in energy by 10%. Once the group's core growth driver, this segment now offers stability amid market volatility.
Special focus is being placed on the CCGT unit in Komotini (887MW), expected to be fully operational soon. In parallel, strategic talks with Motor Oil are underway for potential synergies in conventional energy—moves that could further strengthen the group’s operational foundation.
Rich Project Pipeline Ahead
Growth catalysts remain strong. Axia highlights several key developments:
Egnatia Odos Concession: A mega-project expected to become operational by end-2025 or early 2026, generating new concession revenue streams.
Komotini CCGT Station: Its commercial operation will bolster energy operations.
Amfilochia Hydro Project (730MW): Masdar’s potential exercise of a put option to sell its 50% stake could bring capital inflow and added flexibility.
Strategic Energy Partnerships: Expected to unlock added value through synergies and economies of scale.
Target Price: €27.4 – The Disconnect Between Valuation and Reality
Axia Research reaffirmed its €27.4 price target, maintaining a “buy” rating, suggesting a 43.5% upside from June 2’s close at €19.09. The report emphasizes that the current valuation doesn’t reflect GEK TERNA’s cash flow strength, profit margins, or significantly reduced operational risk, now mitigated by diversification and recurring concession revenue.
In a market often driven by hype and speculation, GEK TERNA stands out as a case study of intrinsic value yet to be realized by the board. Backed by analysis, steady cash flow, a diversified business model, and a proven track record in executing large projects, the stock’s upside remains substantial—and largely untapped.
GEK TERNA: 5.08% Stake Changes Hands at €19 (06.04.25)
Three block trades totaling 2.37% of GEK TERNA changed hands on the Athens Exchange, involving 900,000, 1,207,000, and 350,000 shares respectively—all at €19/share, despite the stock trading above €19.30.
The combined transaction value reached €46.87 million. Later in the session, five additional blocks traded at the same price, totaling 2.7 million shares worth €52.3 million.
Sources indicate that the placement involved institutional investors, with no shares sold by key shareholder Giorgos Peristeris.
Following GEK TERNA’s strong Q1 results, investor interest is intensifying, with many portfolios seeking exposure. As per the company’s announcement, revenue rose 49% to €989.4 million and EBITDA increased 55.1% to €135.5 million in the first quarter of 2025, with all business segments showing growth. Long