Unlock the Secrets of Doji, Hammer and Dragonfly DojiHello,
Candlesticks have been there longer than most of us can imagine. They are a unique way of looking at things because they normally have four price points. Candlestick patterns are formed by the combination of one or more candlesticks, which are graphical representations of the price action of a financial asset during a particular time period.
Doji, hammer, and dragonfly doji are three common candlestick patterns that traders use to identify potential trend reversals or continuation.
A d
Structure drawingHello,
Structure drawing is a crucial skill for wave traders as it helps them to identify potential price movements and trade opportunities. Technical analysis relies heavily on charting patterns, and understanding the different structures is vital to making informed trading decisions. Ascending and descending channels are two commonly used structures in technical analysis.
Ascending channels depict an upward trend with higher highs and higher lows, while descending channels indicate a downwa
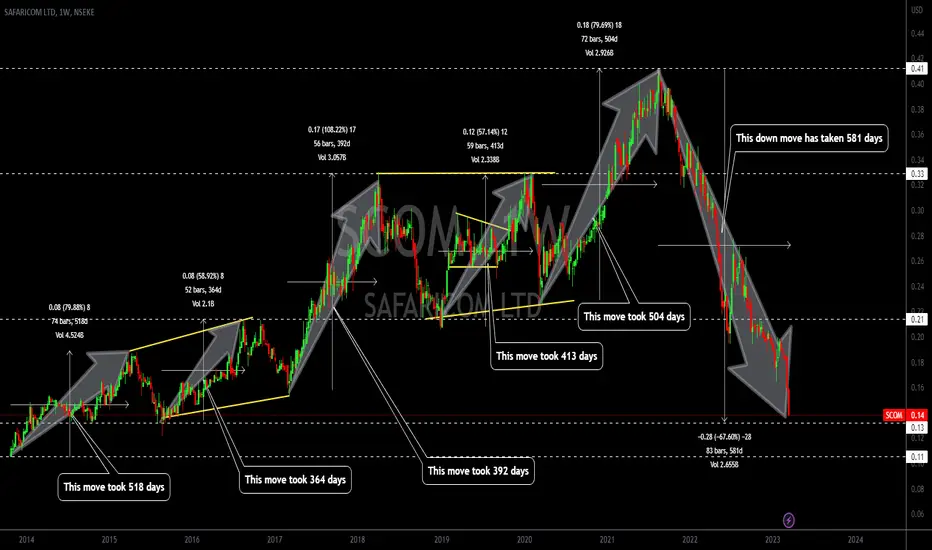
Safaricom shares prices dropping close to a demand levelSafaricom share price is at a significant level?
Currently Safcom share see real time value www.safaricom.co.ke
Is this valuation ideal and thus a good average for Safaricom
or
Do you think the current valuation for safaricom is premium price (overpriced).
The third option, current safaricom price is at discount levels (Under valued?)..
Bear this in mind when deciding.
Safaricom is extending it's services to the Democratic Republic of Congo (DRC). A country considered the world's ri
Using different tools to make your analysis easierHello,
Tradingview gives you tools you will never find in any platform. The tools are very key in making you a better trader. Below are my favourite tools
1:arrow: This tool is very key because t helps me set and indicate my targets clearly
2:Trendline: This is the yellow line on my chart that helps me identify the charts and make them clear for everyone
3: date & price range tool: This tool is very key to my analysis because it shows me the increase/decrease in percentage terms while it also