Berkshire Hathaway Acting as a Stability Anchor for the MarketCurrent Price: 0.00
Direction: LONG
Confidence level: 85%(Trader consensus remains unified across group metrics.)
Targets
Target 1: 433.50
Target 2: 437.00
Stop Levels
Stop 1: 426.50
Stop 2: 423.00
Wisdom of Professional Traders:
Here's the big picture for TODAY only. When I combine YouTube trader commentary with real‑time X sentiment, the dominant narrative is still the AI‑led mega‑cap momentum trade pushing indices higher intraday.
Several professional traders I tracked emphasize that leadership from the “Mag 7” is still intact. NVDA, AAPL, GOOG/GOOGL, and AMZN continue to drive index performance, and the S&P 500 and Nasdaq are repeatedly printing record highs. On X, traders are highlighting strong institutional accumulation flows, especially dark‑pool buying in AMZN, AAPL, GOOG, and NVDA. That kind of off‑exchange activity typically signals large funds positioning ahead of continued upside moves during the same trading session.
What's interesting is that even with hotter inflation prints and rising energy prices, traders largely dismissed macro headwinds for TODAY’s session. The narrative dominating social sentiment is liquidity + AI spending momentum. Several posts also reference geopolitical optimism tied to US‑China tech dialogue, which is acting as a short‑term risk‑on catalyst.
There are warnings about narrow market breadth and overbought RSI readings, but those are generally viewed by traders as risks for later pullbacks rather than catalysts for a same‑day reversal. For TODAY only, the consensus across YouTube commentary, options flow chatter, and X sentiment still favors continuation to the upside in mega‑cap tech and the S&P complex.
So the unified thesis is straightforward:
AI‑driven megacap strength + institutional accumulation = continued intraday upside bias today.
Confidence is moderate‑high because sentiment and institutional flows are aligned.
Key Insights:
Berkshire often behaves differently from the AI‑driven tech names, but it still benefits from broader market strength.
For TODAY only, BRK.B typically follows the overall direction of the S&P 500 with lower volatility.
Recent Performance:
The stock has shown steady gains alongside the broader bull market.
Expert Analysis:
Professional traders often view Berkshire as a defensive component during tech‑heavy rallies.
News Impact:
Strong insurance cash flows and diversified holdings support investor confidence.
Trading Recommendation:
Intraday bullish bias aligned with the broader market.
 Long
Long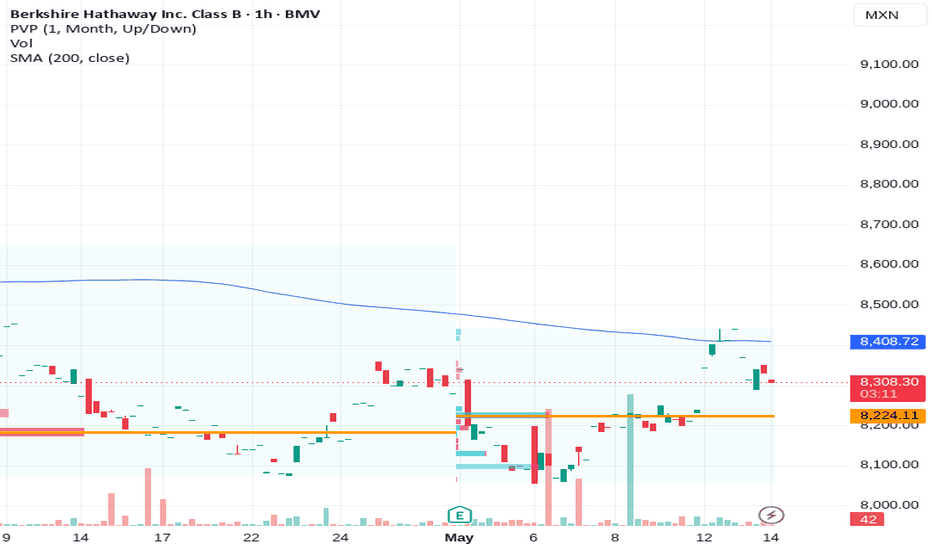
INTEL CORP POSSIBLE CORRECTION ON WEEKLY TFINTEL STOCKS CONTINUES TO RISE ON TERAFEB PROJECT WITH TESLA BUT CORRECTION IS EMINENT ON WEEKLY TF
the bullish catalyst remains tesla collaboration and a pull back will be a buy continuation .
Tesla has become Intel's first major customer for its advanced 14A (1.4nm-class) chip process, collaborating on production at Tesla's Terafab AI chip facility in Austin, Texas.
Collaboration Details
Elon Musk announced during Tesla's April 2026 earnings call that Terafab will leverage Intel 14A for AI processors targeting autonomous driving and robotics. The 14A node features RibbonFET 2 (gate-all-around transistors), PowerDirect backside power delivery, and Turbo Cells for better performance-per-watt—promising 15-20% speed gains, 30% density increase, and 25-35% power reduction over Intel's prior 18A.
ASML EUV Market Challenge
Intel's aggressive adoption of ASML's High-NA EUV tools for 14A gives it a first-mover edge over TSMC's A14, potentially reclaiming process leadership lost years ago. However, High-NA's higher costs could pressure scalability and pricing versus ASML's Low-NA EUV used by competitors, challenging ASML's market if Intel succeeds in high-volume foundry wins but risking slower adoption if economics falter.
Intel's 14A process targets a 15-20% performance boost or 25-35% power reduction over its prior 18A node, while TSMC's A14 aims for 10-15% speed gains or 25-30% power savings versus N2 (2nm).
Tesla's Terafab factory aims to achieve 1 terawatt of annual AI compute capacity through a fully vertically integrated chip production model.
Core Targets
Terafab, a $25 billion joint Tesla/SpaceX/xAI/Intel facility in Austin, Texas, seeks to rival TSMC's global output from one site, scaling from 100,000 to 1 million wafer starts monthly. It consolidates all stages for AI5/AI6 edge chips (FSD/robotics) and radiation-hardened D3 space processors.
the tesla /intel Terafab Goal is to have Chip Design,In-house recursive loop design, mask iteration, test enabling rapid AI chip evolution unmatched globally.
Fabrication/Lithography Intel 14A (1.4nm) process with High-NA EUV; initial pilot at 3,000 wafers/month, targeting 2nm-class logic/memory.
Memory Manufacturing On-site HBM/DRAM production for AI stacks, bypassing supply chains.
Packaging Advanced multi-chip modules (CoWoS-style) under one roof for 1TW compute/year.
This "fast recursive loop" positions Terafab for unmatched iteration speed, though skeptics question feasibility given Tesla's fab inexperience ,but intel years of experience and trained feb engineers will give the project a seamless flow.
#intel #tesla #stocks  Long
Long
 Long
Long
 Long
Long
 Long
Long
 Education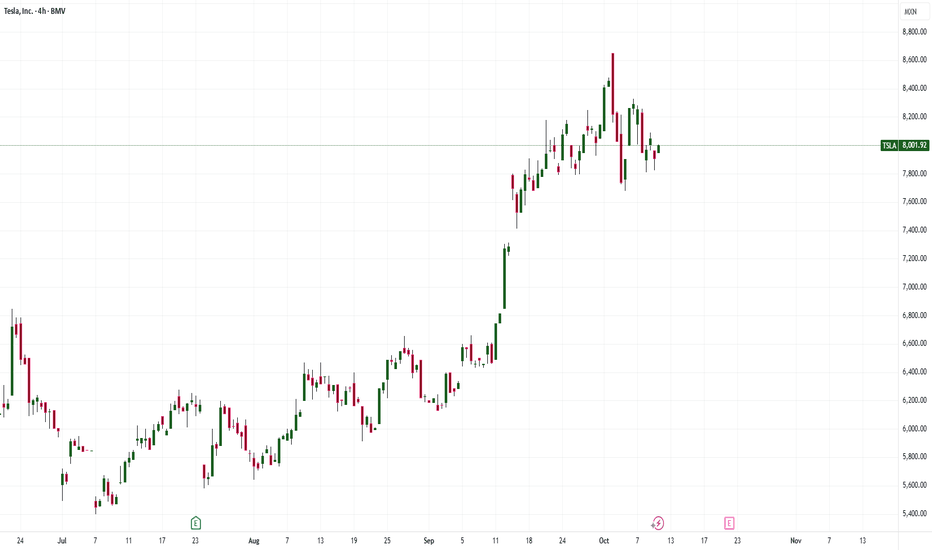
 Long
Long
 Long
Long
BRK.B Share Price Reaches All-Time HighBRK.B Share Price Reaches All-Time High
As shown on the chart, the Class B shares of Berkshire Hathaway (BRK.B) have surpassed $520 for the first time in history. Notably, US stock indices remain below their record highs, further highlighting Warren Buffett’s investment acumen.
In late December, we noted that:
→ Berkshire Hathaway (BRK.B) had significantly reduced its position in Apple (AAPL) and refrained from making new purchases.
→ This suggested that Warren Buffett believed US stocks were overvalued and that a market correction was likely.
Once again, Buffett has been proven right. The Telegraph reports that the legendary investor correctly anticipated that Donald Trump would send Wall Street tumbling.
Additionally, Berkshire Hathaway’s latest earnings report, released yesterday, revealed that the company has been investing in the Japanese stock market—likely contributing to the optimism surrounding BRK.B shares.
Technical Analysis of BRK.B Shares
Key points for constructing the upward price channel are marked in blue, with:
→ The median line shifting from resistance to support (as indicated by arrows).
→ The price approaching the upper boundary of the channel, which could act as resistance.
→ The price action following the breakout above the psychological $500 level displaying strong bullish confidence.
Given these factors, if BRK.B shares enter a correction phase after the sharp rally (potentially reversing from the upper channel boundary), the $500 level is likely to act as support.
Another key support level is $483, which served as resistance in 2024 but has yet to be tested following the bullish breakout.
This article represents the opinion of the Companies operating under the FXOpen brand only. It is not to be construed as an offer, solicitation, or recommendation with respect to products and services provided by the Companies operating under the FXOpen brand, nor is it to be considered financial advice.  Long
Long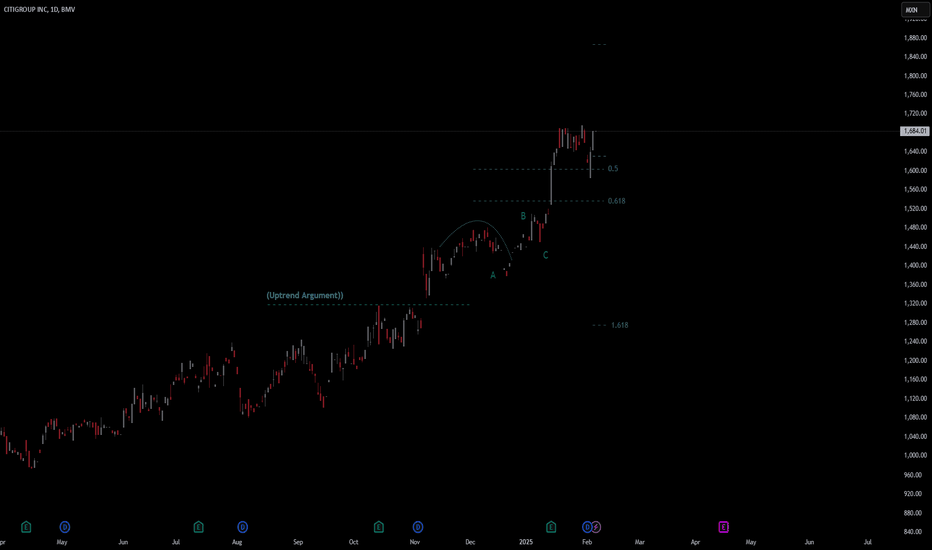
 Short
Short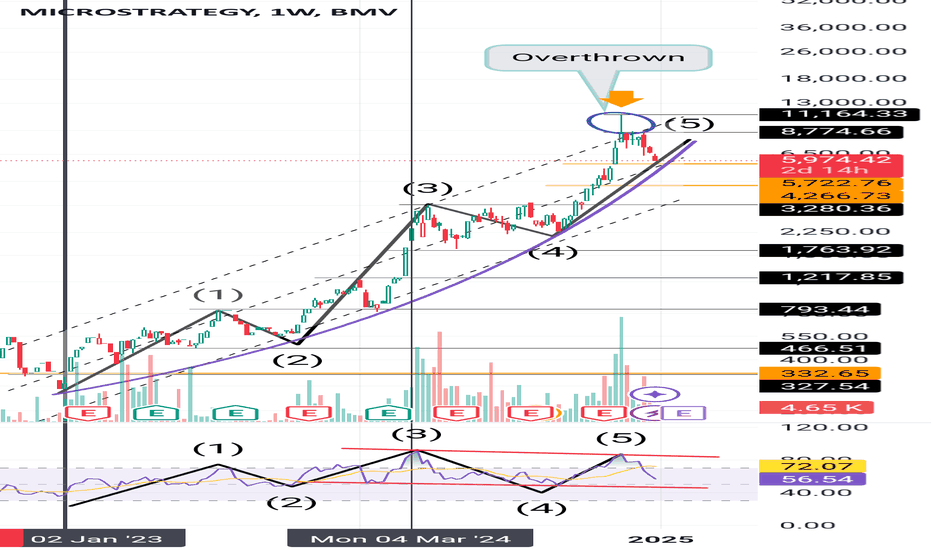
 Long
Long
Long 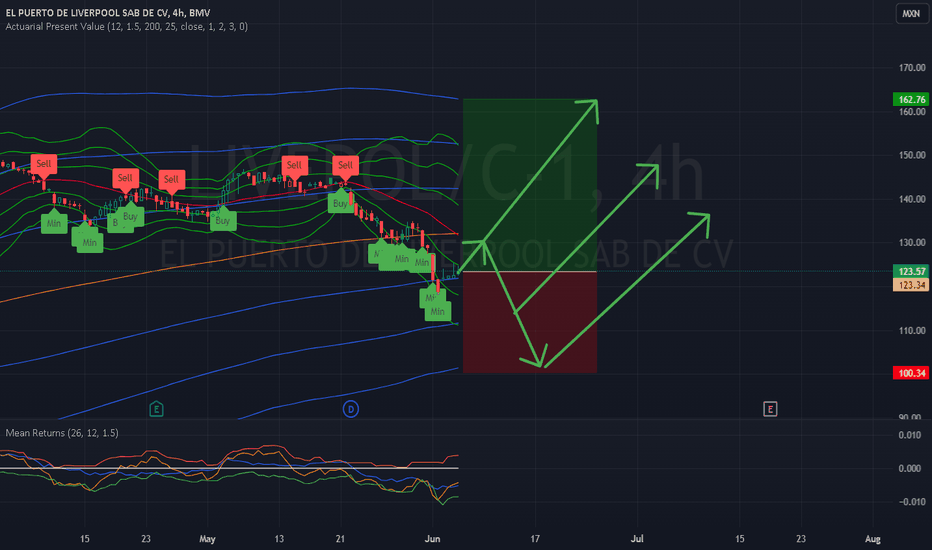
 Long
Long
Long 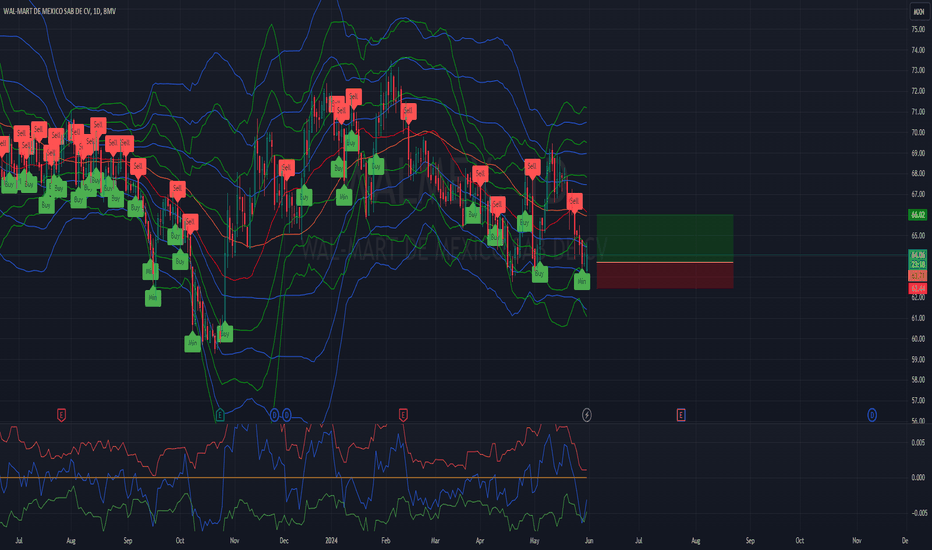
 Long
Long
Long 
Long 
 Long
Long
Short 
 Long
Long