Long
Long
 Long
Long
 Long
Long
 Long
Long
 Long
Long
B

Elliott Waves Analysis for CEMEX/CPO (Up date)Hello traders,
Since January 30 of this year I have not published anything about this Stock, so I think it is very worth talking about it. Not only what has changed is the passage of time, also from January to date there is a change in my academic status and in the accumulated hours of doing analysis.
Good;
1.- The first point I want to talk abaout is that from my first post about CEMEX / CPO the count has changed a bit. The proposal now is that we are in a wave "IV" to continue descending, forming wave "V" to finish wave (II) . What does this mean in simple words? The answer is that CEMEX / CPO seems to be looking for a double bottom at $ 2.57MXN, perhaps it will not but at least we hope to see the price of this issuer at a price lower than $ 3.98MXN and greater than or equal to $ 2.57MXN.
2.- The second important point to mention is that the price is already approaching the next target of $ 9.48 MXN. Can you stop there to start wave V and follow the main trend ? The answer is yes ... If the price does not stop at $ 9.48 can it continue to rise? The answer is yes. In case the price continues to rise, the next objective is to reach $ 11.19 MXN. We must not forget that we are in a socio-economic situation where there is a lot of volatility, so the price of the issuer may NOT reach its objectives and quickly fall in value. Let's also not forget that I am mentioning exact prices, but I am actually referring to price zones.
3.- Finally; If you see the volume bars, you will be able to realize that, as the stock takes on a higher value, they begin to be less and less long, that is, there are fewer and fewer people buying / selling shares of this issuer. How can we interpret a decrease in the volume of operations? ... as a sign that fear or caution on the part of investors is increasing.
Well, I remind all of you that the reviews I post are primarily for my personal and academic purposes. What I post or comment here does NOT represent an investment suggestion for the audience.
There is nothing more to say, until next time!
---------------------------------------------------------
Hola traders,
Desde el 30 de Enero del presente año que no publico nada sobre esta emisora, por lo que creo que vale mucho la pena hablar de ella. No solo lo que ha cambiado es el paso del tiempo, también de Enero a la fecha hay un cambio en mi estatus académico y en las horas acumuladas de hacer análisis.
Bien;
1.- El primer punto que quiero tocar es que de mi primera publicación sobre CEMEX/CPO el conteo ha cambiado un poco. La propuesta ahora es que nos encontramos en una onda "IV" para seguir bajando formando la onda "V" para terminar la onda (II) . ¿Qué significa esto en palabras sencillas? La respuesta es que CEMEX/CPO parece que va a buscar un doble piso en los $2.57MXN, quizás no lo haga pero al menos esperamos ver el precio de esta emisora a un precio menor de $3.98MXN y mayor o igual a $2.57MXN.
2.- El segundo punto importante a mencionar es que el precio ya se está acercando al siguiente objetivo $9.48 MXN. ¿Se puede detener ahí para comenzar la onda V y seguir con la tendencia principal ? La respuesta es sí... ¿El precio si no se detiene en los $9.48 puede seguir subiendo? La respuesta es sí. En caso de que el precio siga subiendo, el siguiente objetivo es llegar a los $11.19 MXN. No debemos olvidar que estamos en una situación socio-económica donde hay mucha volatilidad, por lo que el precio de la emisora puede NO llegar a sus objetivos y caer rápidamente en su valor. Tampoco olvidemos que estoy mencionando precios exactos pero, en realidad me refiero a zonas de precio.
3.- Por último; si ven las barras de volumen se podrán dar cuenta que, conforme la acción se va agarrando un mayor valor, estas comienzan a ser cada vez menos largas, es decir, que cada vez hay menos personas comprando/vendiendo acciones de esta emisora. ¿Cómo podemos interpretar una disminución del volumen de operaciones?... como una señal de que el temor o cautela por parte de los inversionistas va en aumento.
Bien, les recuerdo a todos ustedes que los análisis que publico son principalmente para mi uso personal y fines académicos. Lo que yo aquí publique o comente NO representa una sugerencia de inversión para la audiencia.
No hay mas que decir, ¡hasta la próxima!  Long
Long
 Long
Long
 Long
Long
Long 
At the end of the dark tunnel? (Elliott Waves Analysis)Hello traders!
I believe that this analysis deserves an update since I find relevant information in it.
The first thing I want to mention is that I am working with 2 counts for the BBAJIO/O cycle correction. The one in green and Roman numerals represents idea 1. The one in yellow with Roman numerals represents idea 2.
In terms of idea 1; I have reason to think that the correction is over, am I sure? Not quite since in the internal structure of the last wave the V, we could be seeing an upward correction to continue falling. It seems unlikely to me but I believe that operating the station from a "pessimistic" perspective is also the best way to take care of the portfolio. In case it is a bullish correction within wave V ... What could we be seeing? A wave 2; I insist within wave V. (Perhaps it is confusing to understand this) ... and ... if the end of the cycle correction has already occurred, how can we be more sure? ... well the 1st price to BE ABLE is the $ 24.37. After passing this price, only one last bearish idea/iteration remains alive ... idea 2, which we explain below ...
In terms of idea 2 (for me, less likely); what we can be seeing is the end of wave III marked in yellow. This means that a bullish buying period is coming in this station to form wave IV (in yellow color) and later continue with a spill of the price to lower lows than those we have already known.- What do you have to do the price to invalidate this idea 2? ... well ... first you have to break the $ 30.85 and then the $ 34.12 with volume. WHEN THIS HAPPENS, WE ARE ALREADY 90% OUT OF THE TUNNEL OF DARKNESS.
Well, how these 2 ideas can help us to operate? ... when both 2 coincide in the direction it gives us greater clarity if it is convenient for us to BUY or SELL.
For my part is everything. I consider that at this moment there is nothing more to say.
Greetings
___________________________________
Hola traders!
Considero que este gráfico ya amerita una actualización ya que, encuentro en él información relevante.
Lo primero que quiero mencionar es que estoy trabajando con 2 conteos para la corrección de ciclo de BBAJIO/O. El que está en color verde y números romanos representa la idea 1. El que está en color amarillo con números romanos representa la idea 2.
En términos de la idea 1; tengo razones para pensar que la corrección ya ha terminado, ¿Estoy seguro? No del todo ya que en la estructura interna de la última onda la V, pudiéramos estar viendo una corrección de subida para seguir cayendo. Me parece poco probable pero creo que operar la emisora desde una perspectiva "pesimista" también es la mejor forma para cuidar el portafolio. En caso de que sea una corrección alcista dentro de la onda V... ¿Qué es lo que podríamos estar viendo? Una onda 2; insisto dentro de la onda V. (Quizás es confuso entender esto)... y... si el final de la corrección de ciclo ya se dio ¿Cómo podemos estar más seguros?... bien el 1er precio que hay que SUPERAR es el de $24.37. Pasando este precio ya solo quedan viva una última idea/iteración bajista... la idea 2, que explicamos a continuación...
En términos de la idea 2 (para mi, menos probable); lo que podemos estar viendo es el final de la onda III marcado en color amarillo. Esto significa que se viene una época alcista de compra en esta emisora para formar la onda IV (en color amarillo) y posteriormente continuar con una derrama del precio a mínimos menores a los que ya hemos conocido.- ¿Qué es lo que tiene que hacer el precio para dejar sin validez esta idea 2?... bien... primero tiene que romper los $30.85 y luego los $34.12 con volumen. CUANDO ESTO SUCEDA ESTAMOS YA UN 90% FUERA DEL TUNEL DE LA OBSCURIDAD.
Bien, ¿Cómo estas 2 ideas nos pueden servir para operar?... cuando ambas 2 coinciden en la dirección nos da mayor claridad si nos conviene COMPRAR o VENDER.
Por mi parte es todo. Considero que en este momento no hay más que decir.
Saludos  Long
Long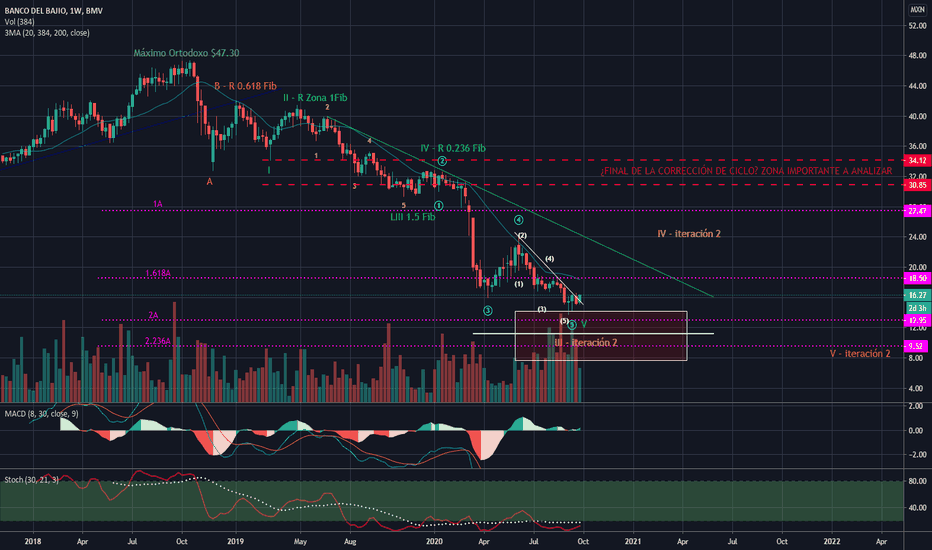

 Short
Short
Elliot Waves Analysis for ALFA/AHello Traders!
Well ... according to Elliot's wave theory I really like the count that I present in this analysis and which reveals the following information;
1.- We are close to starting with the last downward wave; wave 5 of C, the last wave to finish the cycle correction.
2.- Given that wave 1 and wave 3 (purple in color) are practically equal in length, we can expect wave 5 to be of two forms; short or extended. What is likely to come is a SHORT wave, since the extended wave would take us to the $ 0.00 MXN zone in the value of the stock, something difficult to happen (but not impossible).
3.- The green box represents an important area where the price can make a trend change. In any case, as the price develops downward, the daily analysis will provide more information to determine if this box needs to be moved to another price zone. In other words, this green box does NOT necessarily represent a buy zone.
4.- In 1H candles, I get the impression that a last upward momentum might be missing to complete the 4 (purple) but already going to the purchase seems very risky because the price can be returned aggressively.
5.- Finally there is an orange box with a NOTE (you have to read it). It is important to understand that the analyst may have made an erroneous interpretation of the data presented in the graph, therefore, it is convenient to mark these areas that by axioms can NOT be broken without first complying with what has already been foreseen.
Well ... at the moment there is nothing more to say.
----------------------------------------------
Hola Traders!
Bien... de acuerdo a la teoría de las ondas de Elliot me gusta mucho el conteo que presento en este análisis y el cuál revela la siguiente información;
1.- Ya estamos cercas de iniciar con la última onda de bajada; onda 5 de la C, con la cuál ya finalizamos la corrección de super ciclo.
2.- Dado que la onda 1 y la onda 3 (de color morado) tienen prácticamente igualdad en su longitud, podemos esperar que la onda 5 sea de dos formas; corta o extendida. Lo vamos probable por venir es una onda CORTA, ya que la extendida nos llevaría a la zona de los $0.00 MXN en el valor de la emisora, algo difícil de suceder (mas no imposible).
3.- El recuadro verde representa una zona importante en donde el precio puede hacer un cambio de tendencia. De todas formas conforme el precio se vaya desarrollando a la baja el análisis diario irá dando mayor información para determinar si este recuadro requiere ser desplazado a otra zona de precios. En otras palabras, este recuadro verde NO necesariamente representa una zona de compra.
4.- En velas de 1H, me da la impresión de que pudiera faltar un último impulso alcista para completar la 4 (morada) pero ya ir a la compra me parece muy arriesgado porque el precio se puede devolver con agresividad.
5.- Por último hay un cuadro naranja con una NOTA (hay que leerla). Es importante entender que el analista puede haber realizado una interpretación errónea de los datos que presenta el gráfico, por lo tanto, es conveniente marcar estas zonas que por axiomas NO pueden ser quebrantadas sin antes cumplir con lo ya previsto.
Bien... de momento no hay más que decir.  Long
Long
Long 
A