Understanding Heikin Ashi charts
Heikin Ashi charts use average prices to smooth the price movements. They are designed to more easily identify market trends by reducing the noise created by sharp growths and declines.
CONTENTS:
- What are Heikin Ashi charts?
- Heikin Ashi construction principles
- Heikin Ashi vs standard candles
- How to enable Heikin Ashi
- Heikin Ashi settings
What are Heikin Ashi charts?
Heikin Ashi charts are a variation of Japanese candlesticks. They have the same shape with bodies and wicks, but the color of each candle depends on the current trend. Consecutive green candles indicate that the trend is bullish and a sequence of red candles indicates that the trend is bearish.
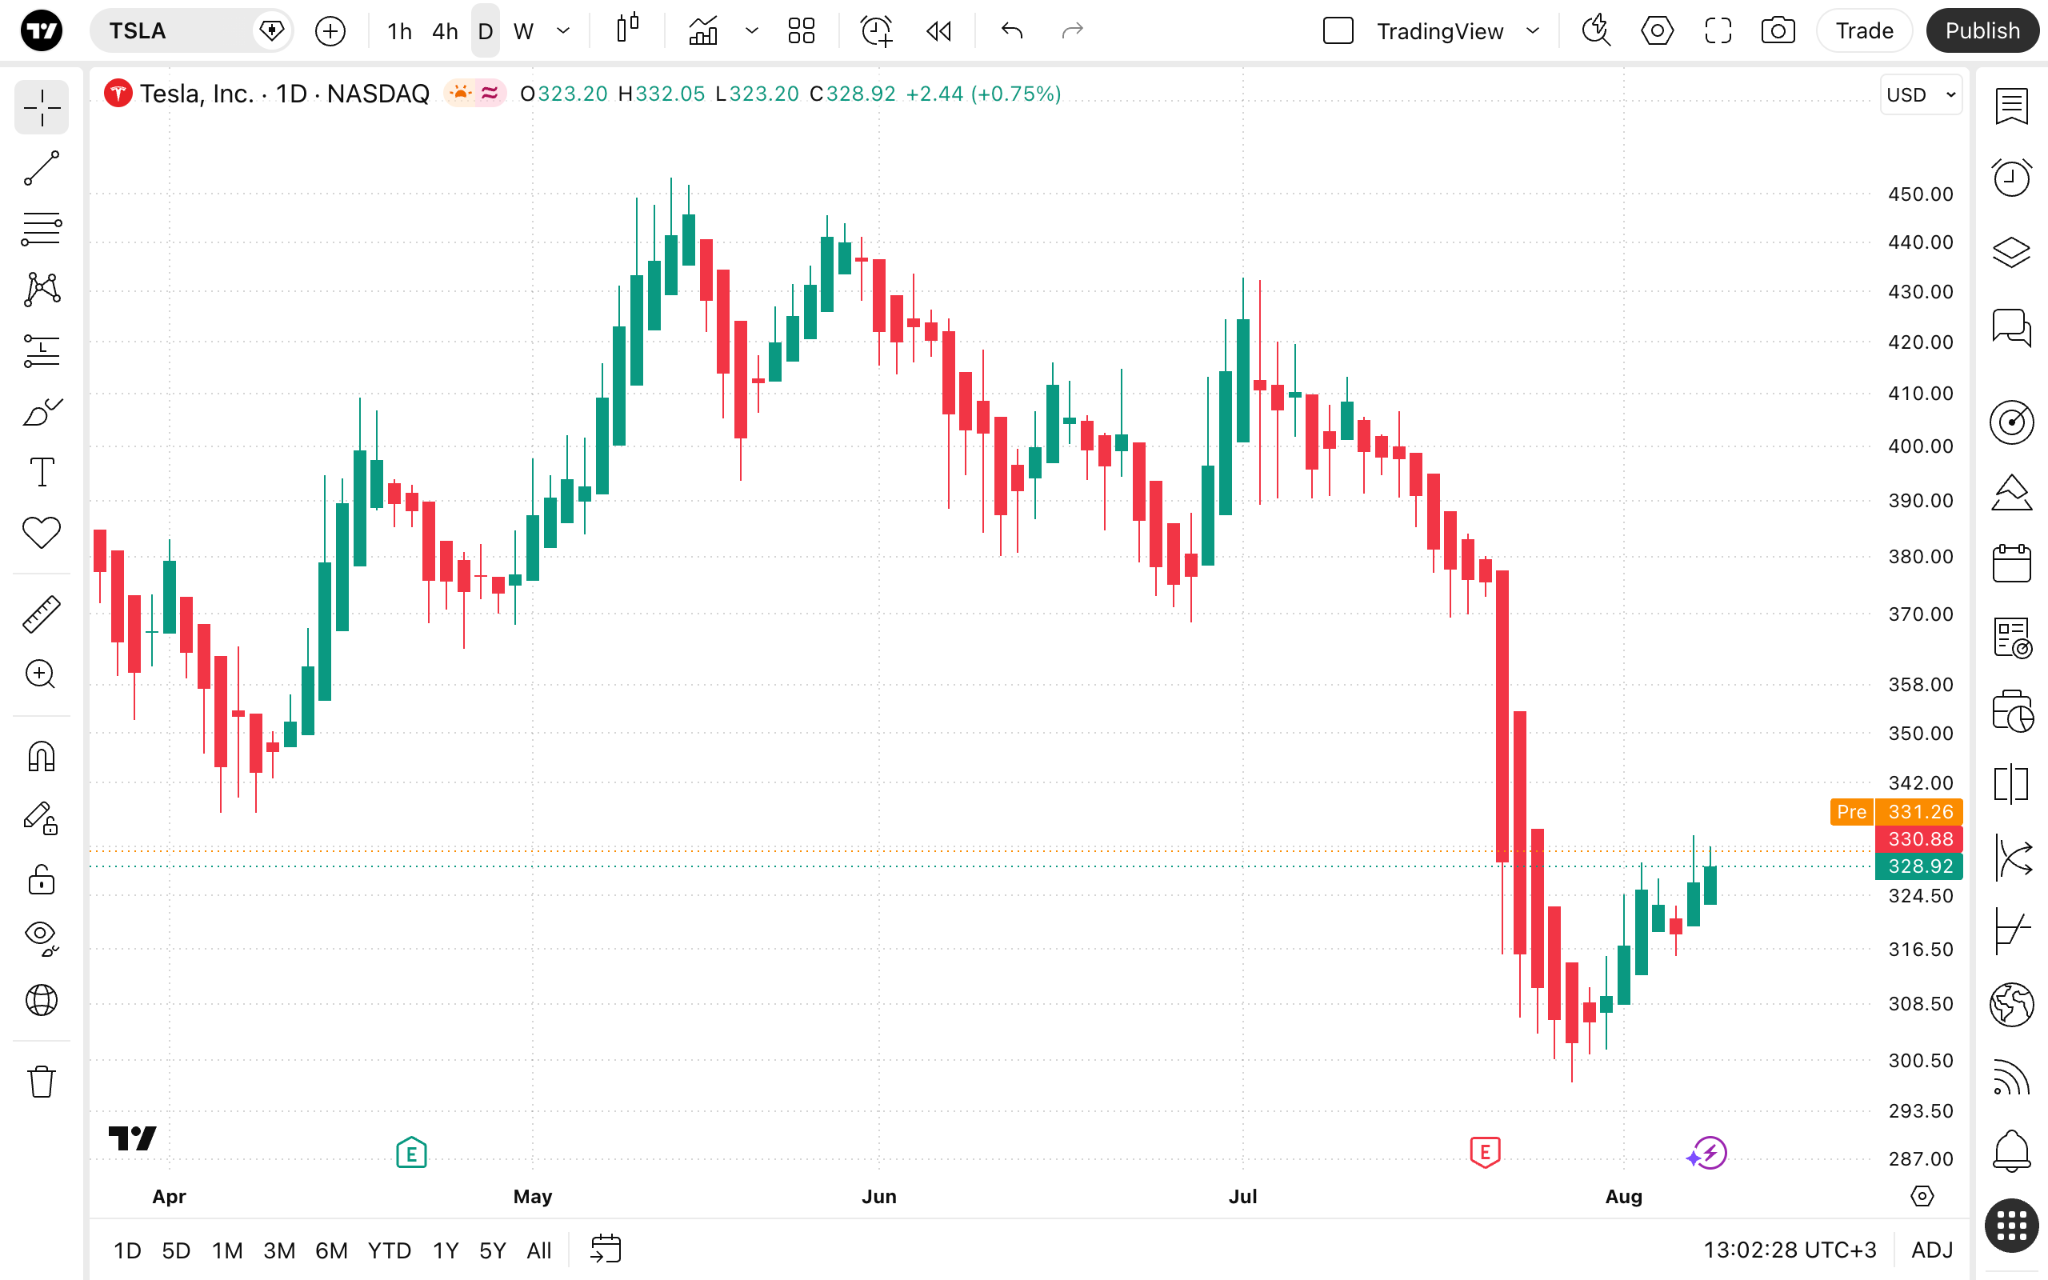
Heikin Ashi candles show the average prices, not the actual prices. They open at the middle level of the previous candle and display two values on the right scale — one is the actual price of the asset and the other is the Heikin Ashi price.
Heikin Ashi construction principles
Heikin Ashi uses a unique formula that affects the candles' shape, size, and direction:
- Open = (Previous [Open + Close]) / 2
- Close = (Current [Close + Open + High + Low]) / 4
- High = The highest value of a recent high, open, or close
- Low = The lowest value of the recent low, open, or close
Current candles are calculated with a delay, as their calculation is possible only after the previous candle is closed.
When trading volatile instruments on small timeframes, this chart type can help filter false breakouts of such critical levels like support and resistance or chart patterns' borders.
Heikin Ashi vs standard candles
Heikin Ashi
- Provide a clearer picture on trends
- Provide average data and clarification during market turbulence
- Less precise for pinpointing exact entry and exit levels
Standard candles
- More common, better studied, and more information about them is available
- Work with both chart patterns and candlestick patterns
- Well-suited for gap trading
How to enable Heikin Ashi
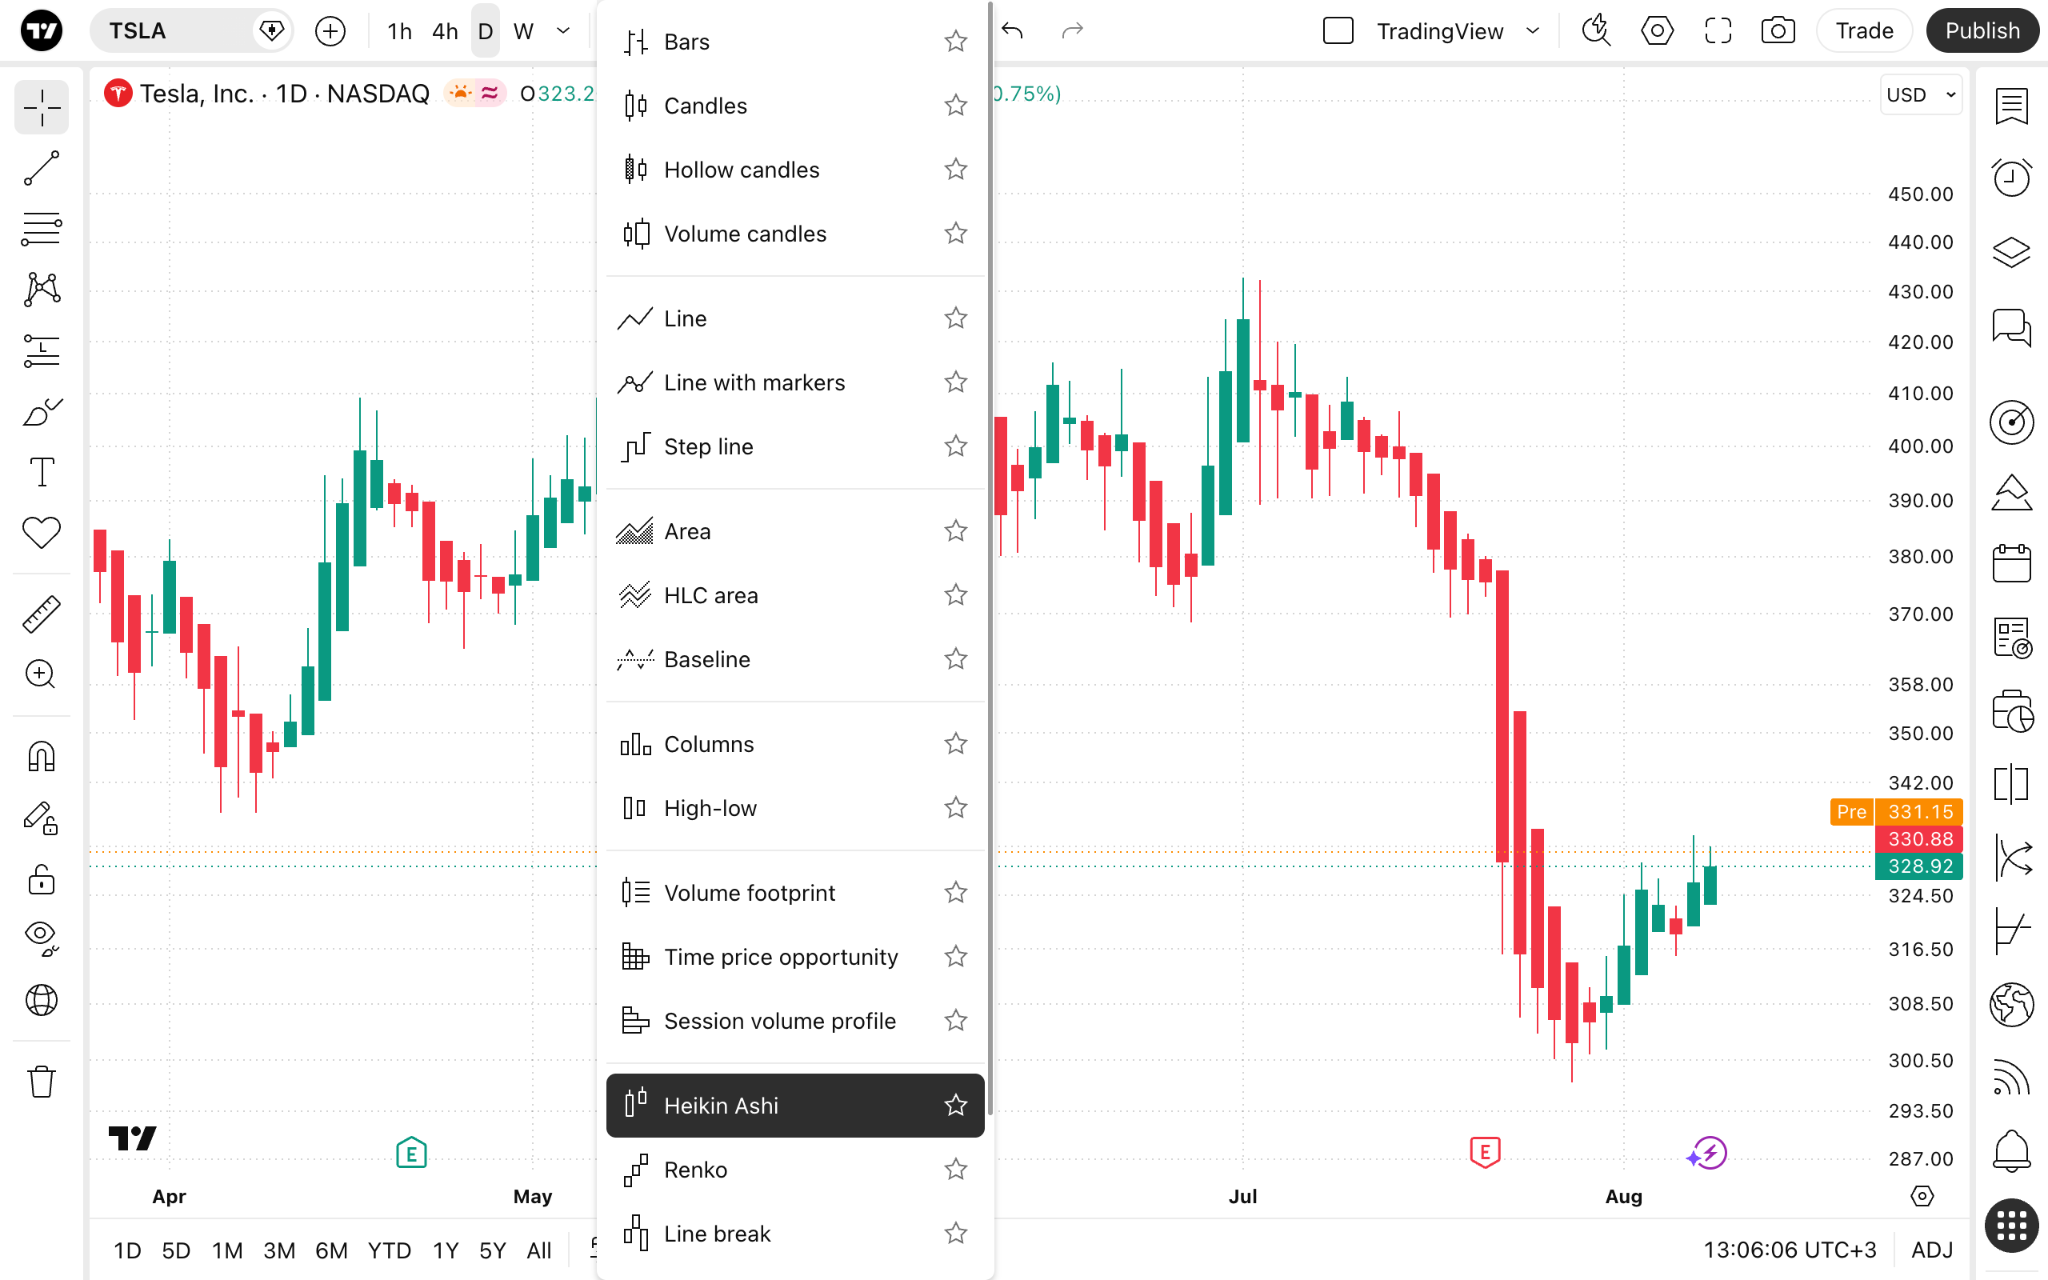
From Supercharts, open the chart type menu on the upper toolbar, and select "Heikin Ashi."
Heikin Ashi settings
To configure your chart, click the gear button on the upper toolbar, and open the "Symbol" tab.
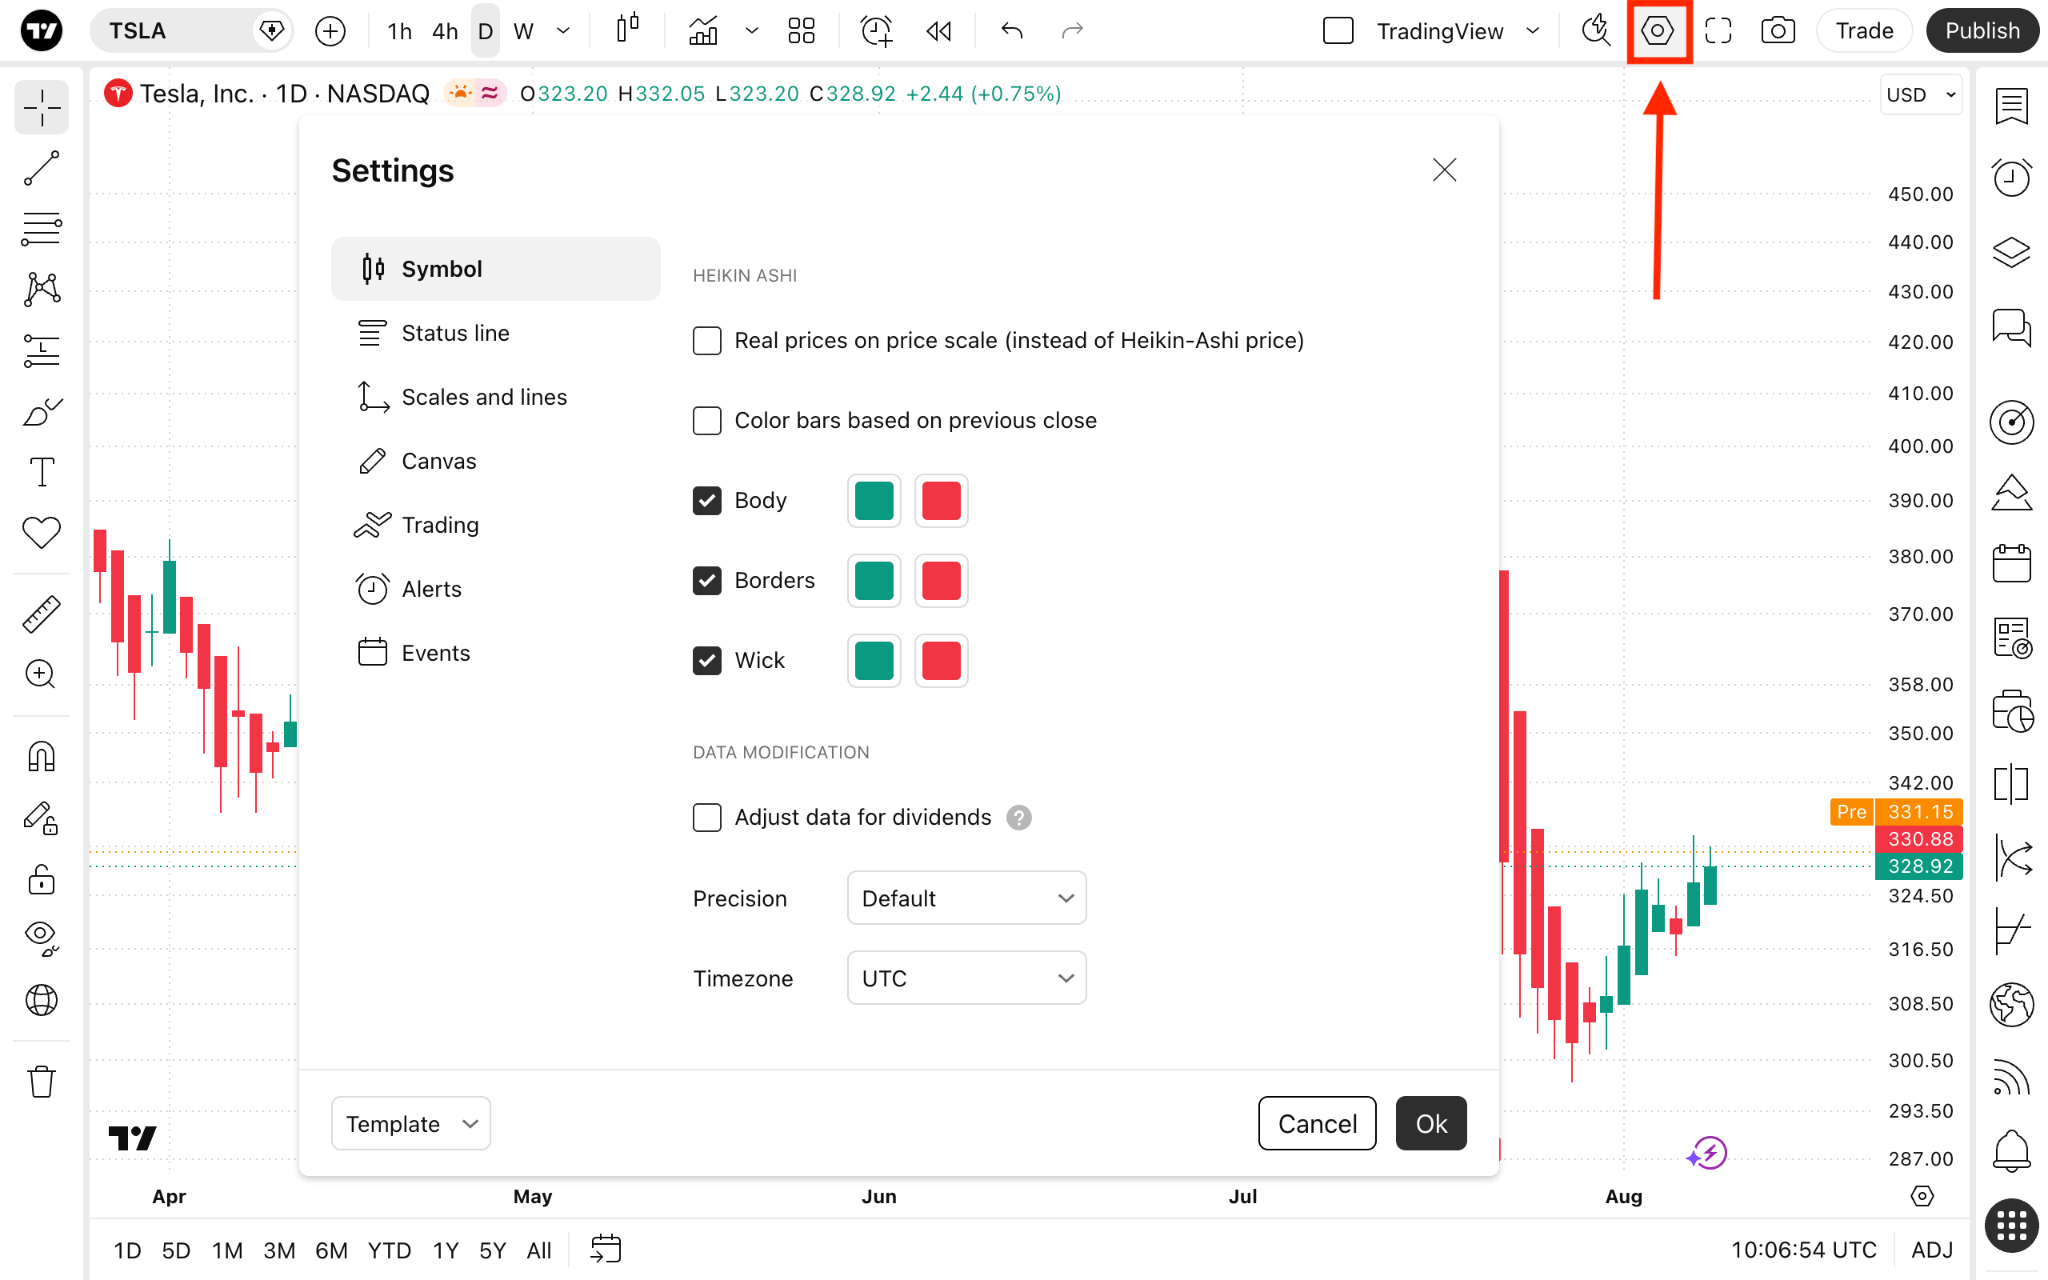
If you want to see the actual prices only, click the "Real prices on price scale."
You can then find settings similar to standard candles:
- Color bars based on previous close: With this setting on, the color of each bar will be determined by whether its close price is higher (green) or lower (red) than the close price of the previous bar, rather than by the bar's own open and close prices.
- Body: Change the color and fill of the candles' bodies.
- Borders: Change the color of the candles' edges.
- Wick: Change the color of the candles' wick.
Heikin Ashi in a nutshell
With Heikin Ashi, you can easily understand trends and average prices for swing trading. The more similarly-colored consecutive candles you see, the more likely the current trend is coming to an end.
Also read: