Understanding high-low charts
High-low charts use full-body bars to display trading ranges during a period of time. They are helpful if you're focusing on full price swings and need to identify extremes.
CONTENTS:
What is a high-low chart?
Unlike other chart types, high-low charts use only one color to shade bars. Due to this, they can help you analyze bars' ranges without trend bias. When you zoom into the chart, each bar would show you high and low prices at top and bottom. Scalpers and intraday traders may find it especially useful.
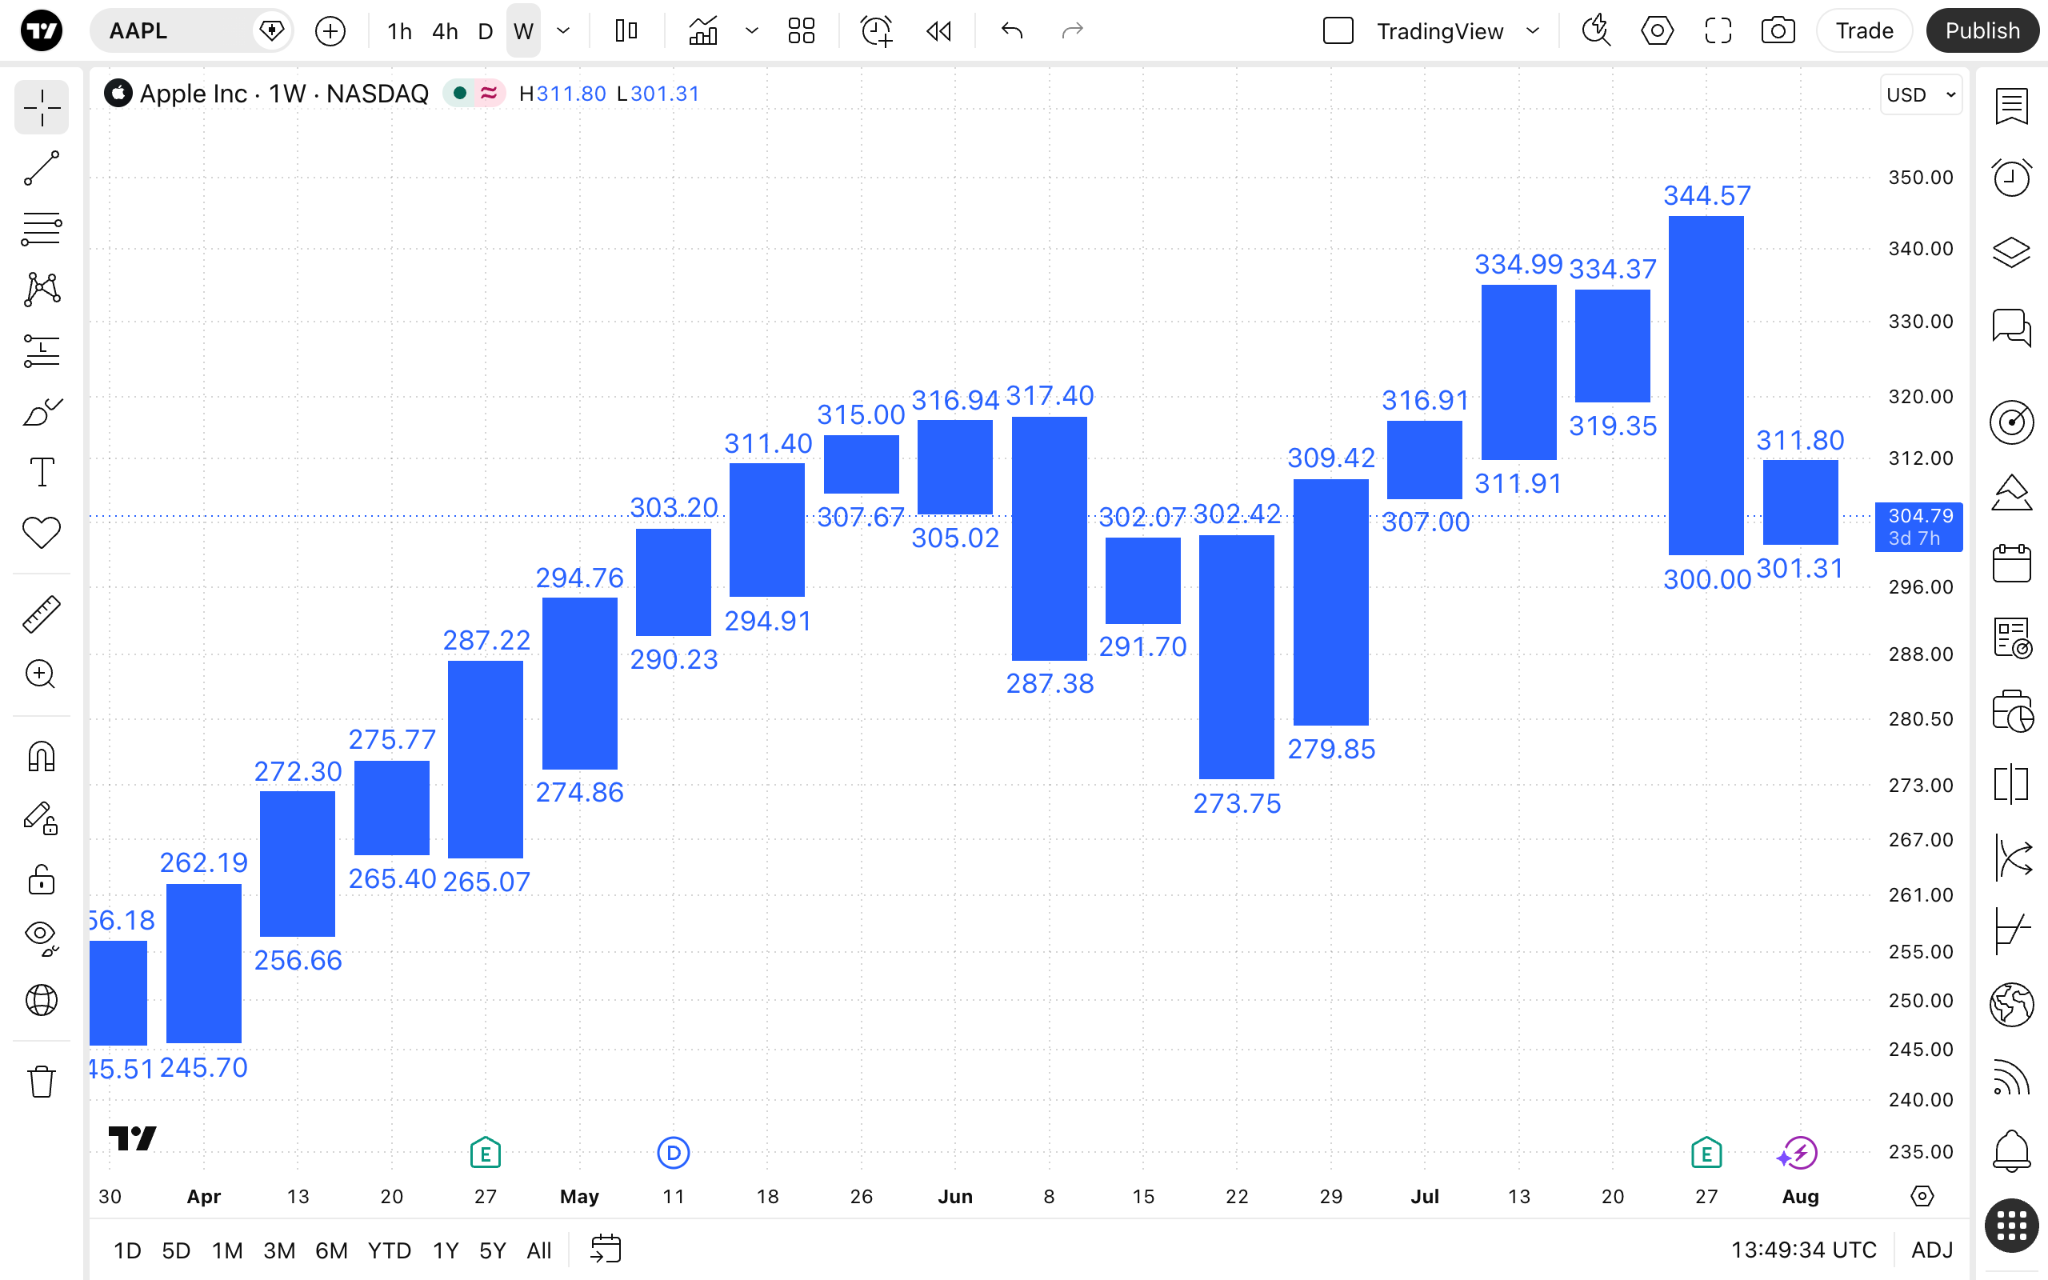
High-low vs standard bars
High-low
- Useful for a quick snapshot of price volatility.
- Clearer picture of price ranges.
Standard bars
- Provide a clear visualization of all the four price values.
- Better for gap trading.
How to enable high-low charts
On Supercharts, open the chart type menu on the upper toolbar, and select "High-low."
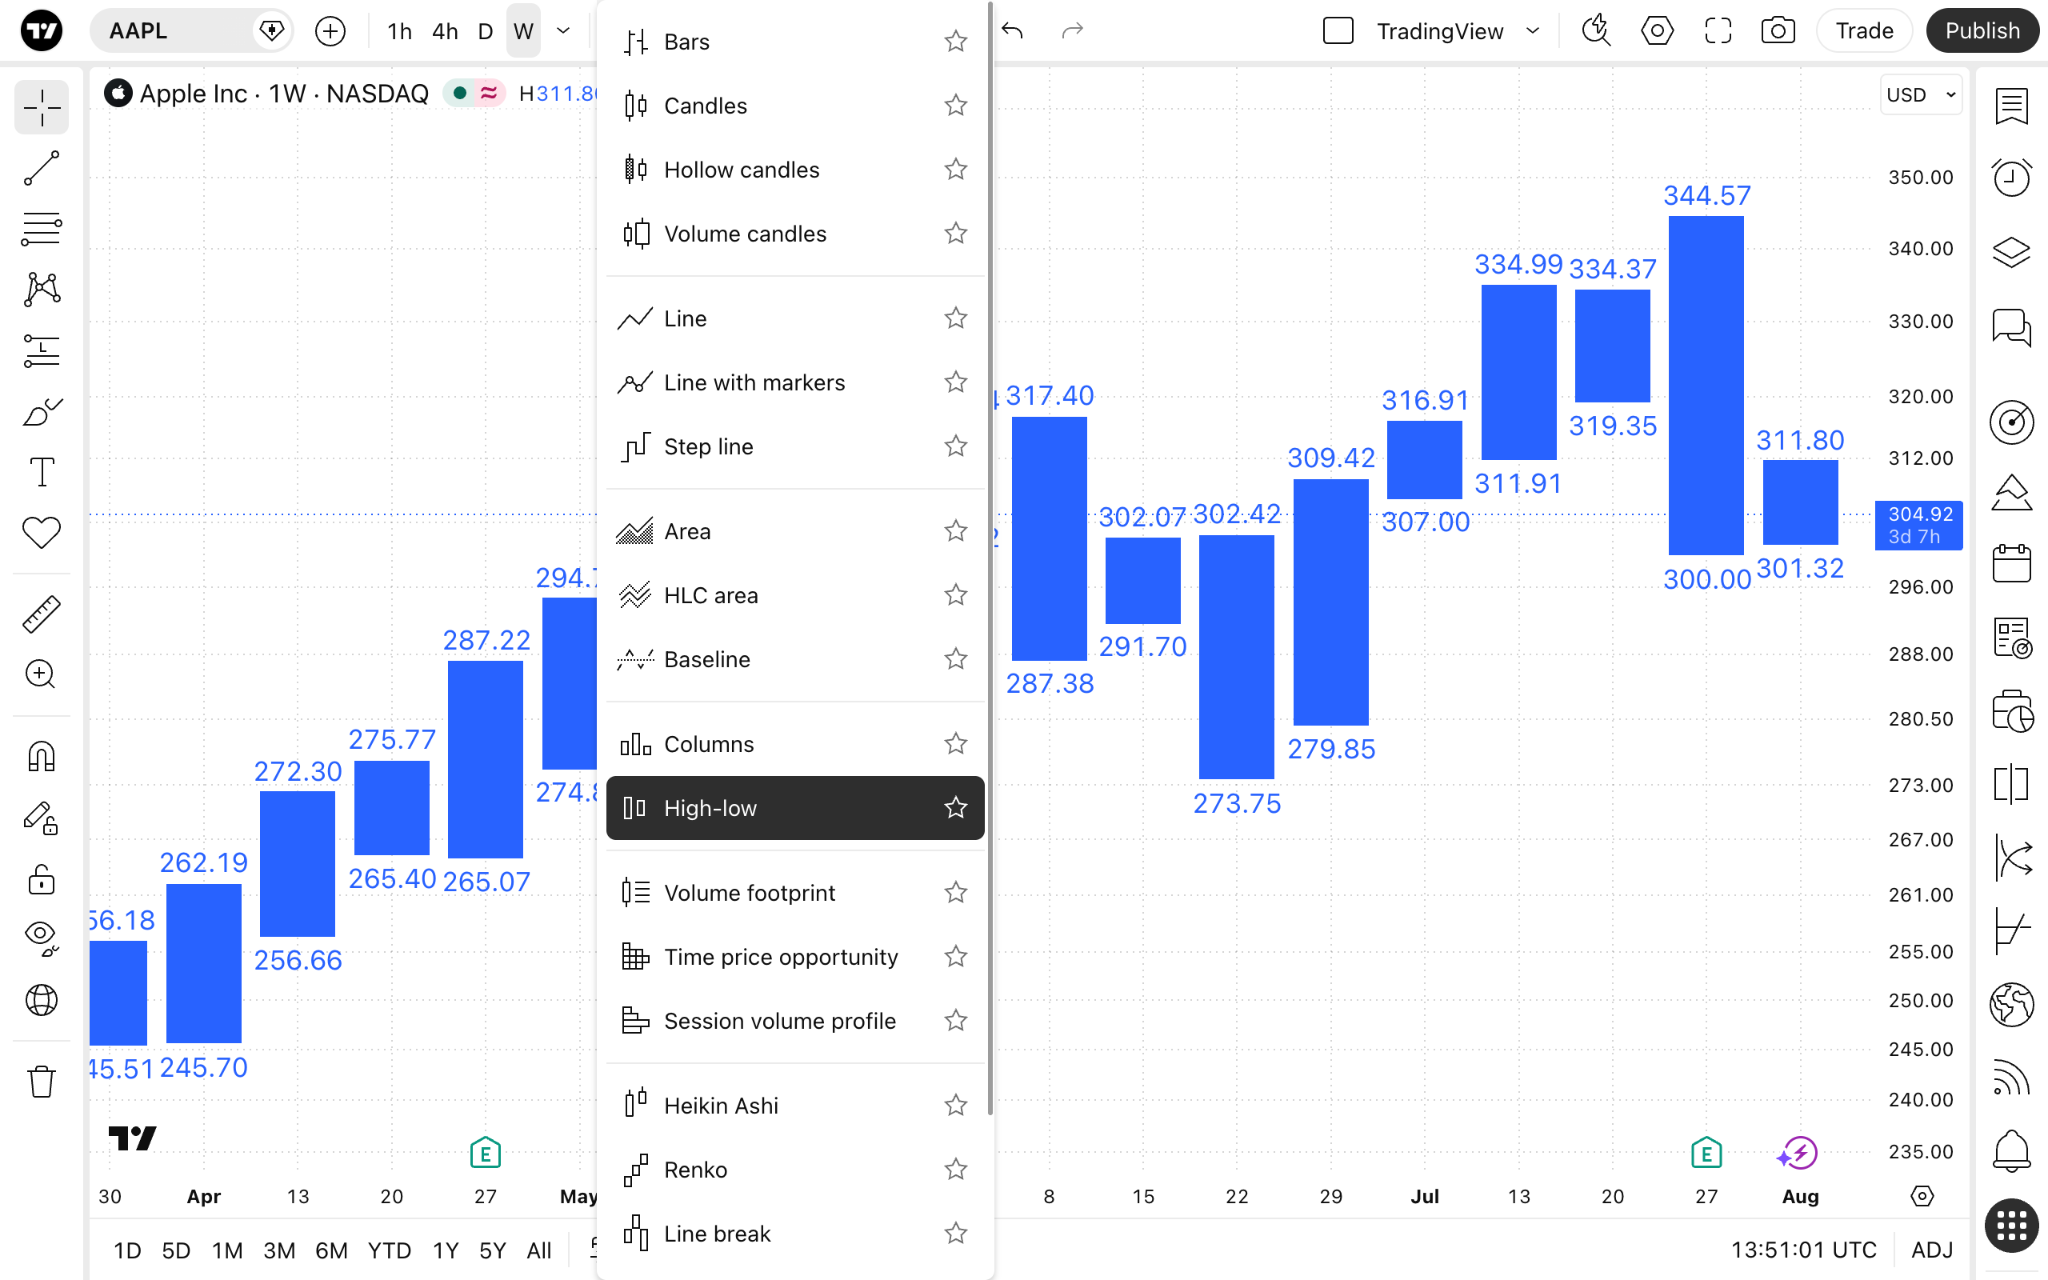
High-low settings
Due to the chart type itself, you can change only the bars' colors, and whether to display price labels. To do this, click the gear button on the upper toolbar, and open the "Symbol" tab.
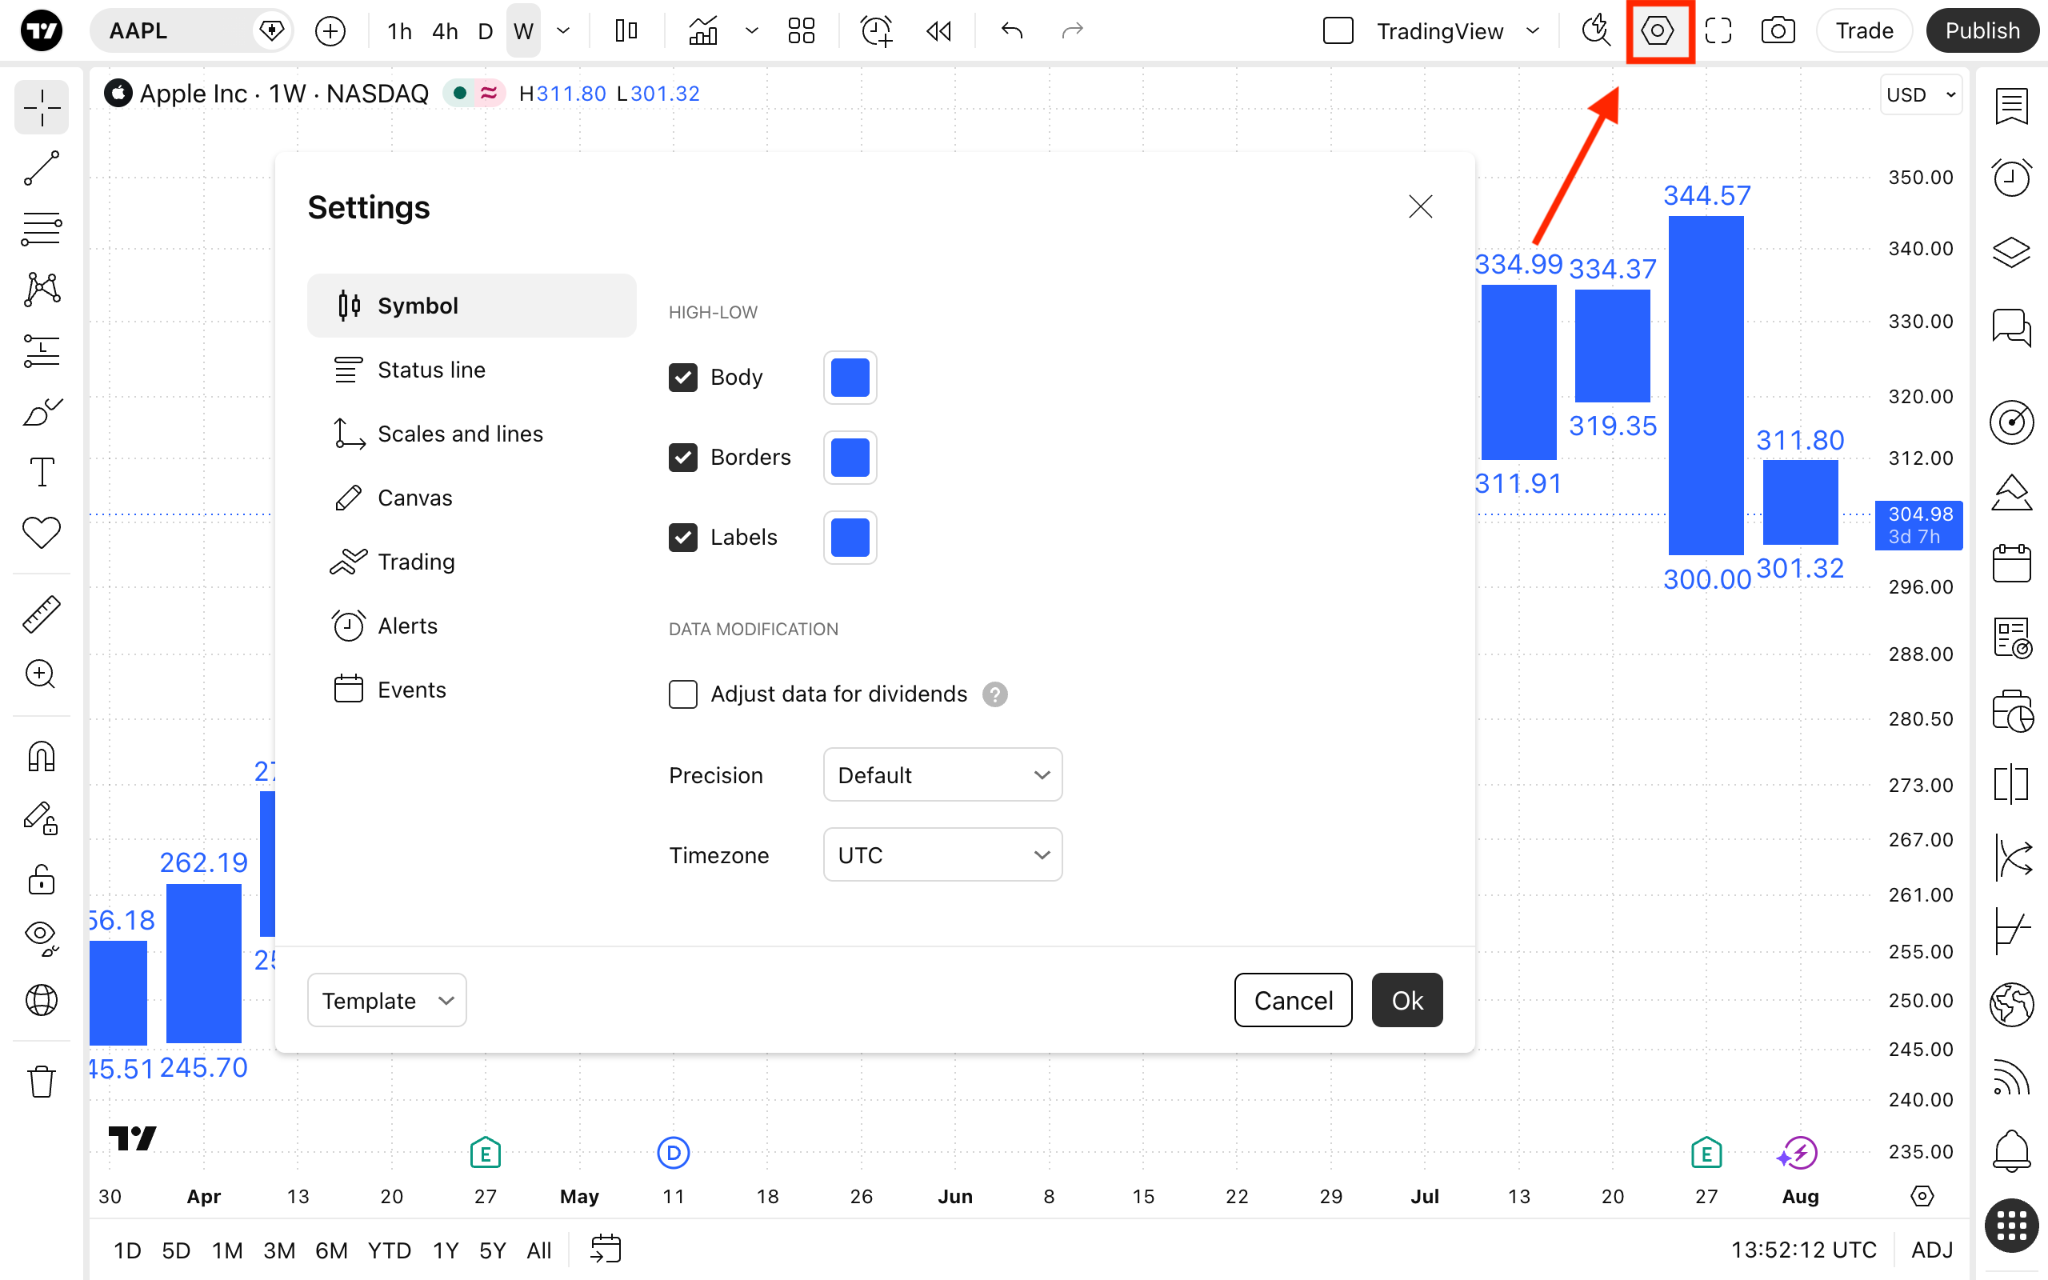
High-low charts in a nutshell
High-low charts provide a clear picture of highest and lowest prices. They are a good choice for highly volatile markets and can give you a better understanding of potential price ranges for sideways trading on lower timeframes.
Also read: