TradingView ETF Screener: your shortcut to top funds
The ETF Screener is a powerful tool designed to help you navigate thousands of funds investing in indices, stocks, cryptocurrencies, commodities, and other assets. With so many options available, choosing the right ETF can be a challenge. The ETF Screener allows you to explore these funds efficiently, helping you find those that best align with your investment strategy and risk tolerance.
CONTENTS:
What is the ETF Screener?
The ETF Screener is a comprehensive financial analysis tool that lets you apply diverse filters to multiple ETF attributes, such as net asset value (NAV), holding regions, management styles, and more. It seamlessly integrates fundamental data, technical information, and interactive charts into a single workspace.
ETFs (Exchange-traded funds) are excellent vehicles for diversifying your portfolio and minimizing risk. Because they can track entire indices or hold baskets of multiple stocks, a decline in one asset may be offset by gains in others. Furthermore, ETFs provide accessible exposure to complex assets like cryptocurrencies — allowing you to benefit from price movements without the burden of managing private keys, seed phrases, or cold storage.
How to access the ETF Screener
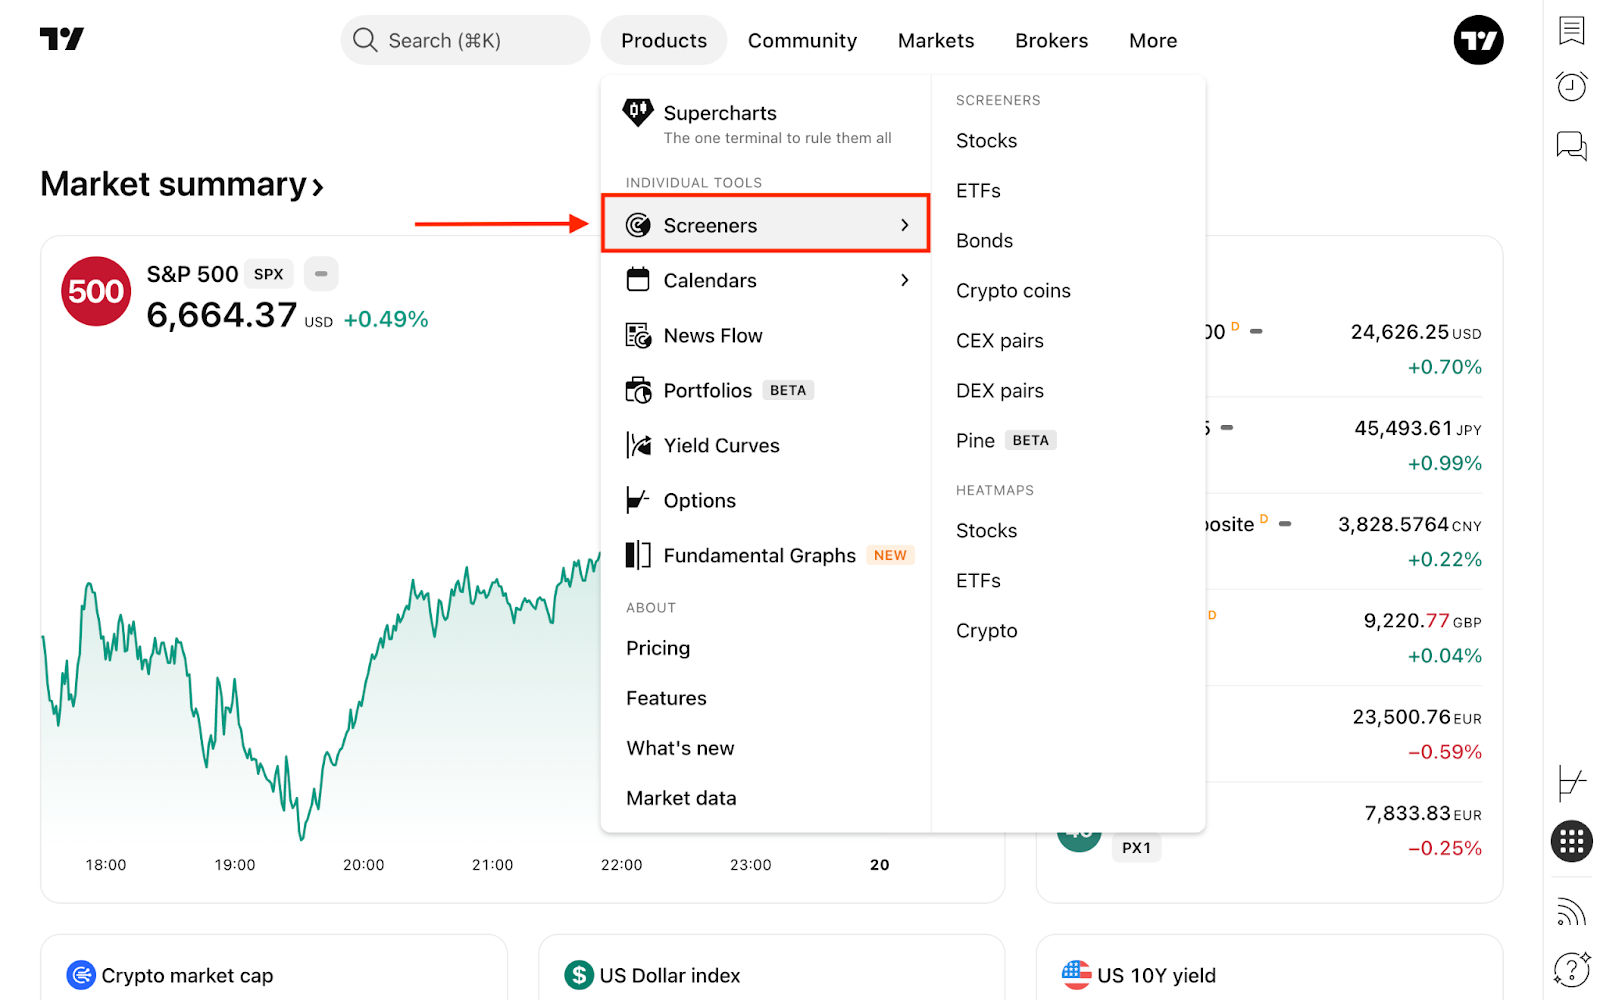
From the main page, click the Products dropdown in the top navigation menu, hover over Screeners, and select ETFs.
Alternatively, you can access it directly from Supercharts. On the right-hand toolbar, click Products → Screeners. If another screener is currently active (like the Stock Screener), simply click its name at the top and switch to the ETF Screener.
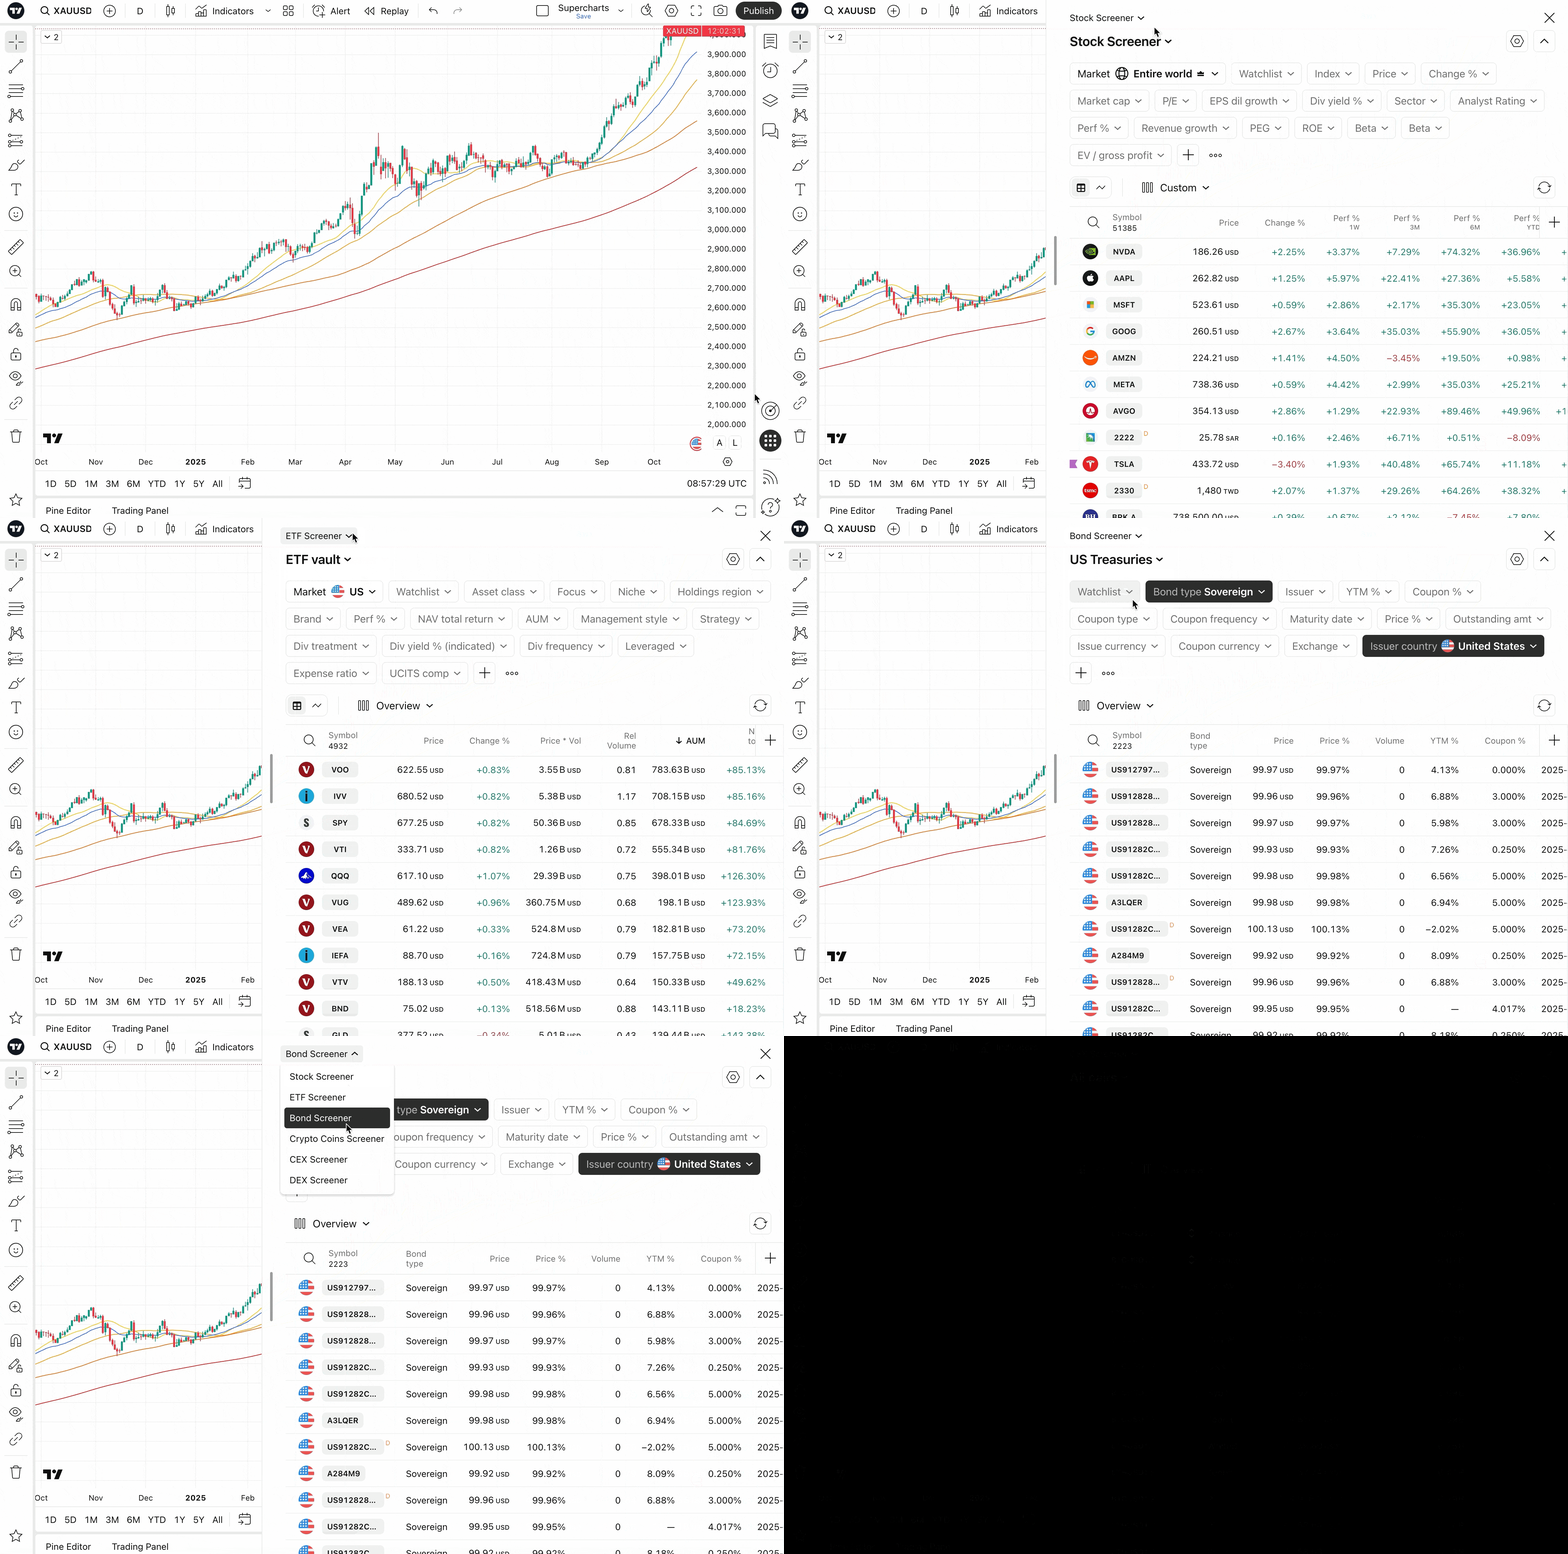
Regardless of how you access it, the tool offers the exact same functionality, so pick the workflow that best suits your setup.
How to use the ETF Screener
By default, the screener displays the US ETF market sorted by Assets Under Management (AUM) — a key metric showing exactly how much capital is invested in a fund.
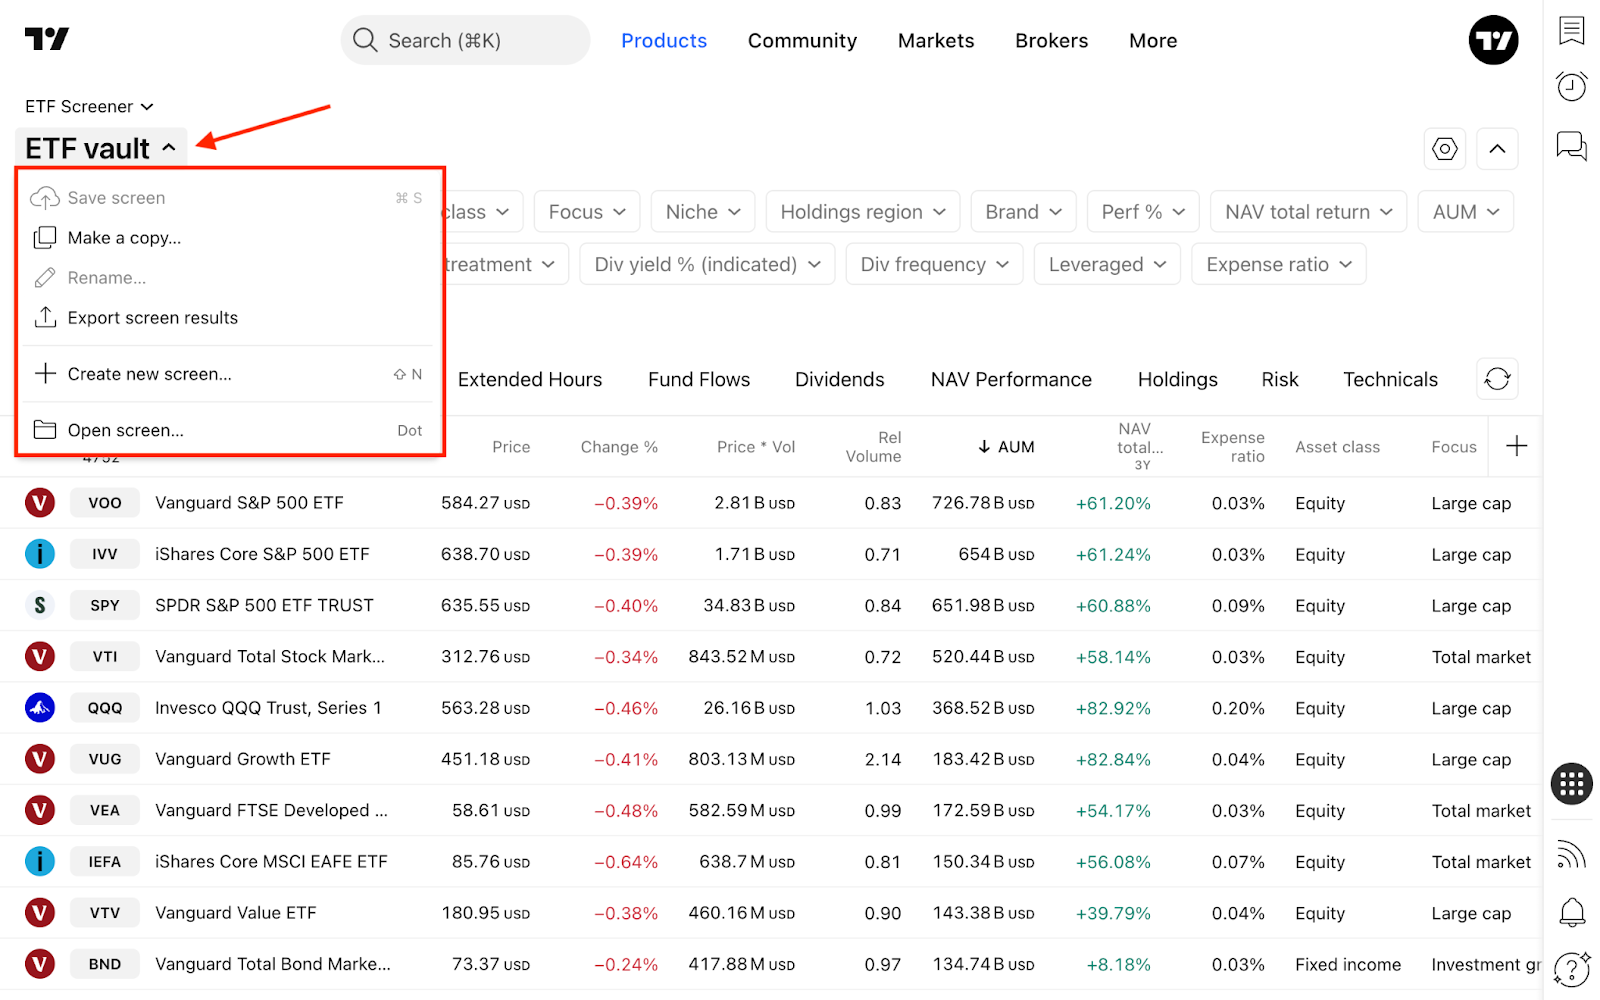
One of the core features of the ETF Screener is the ability to create, save, and manage multiple custom screens for future analysis. You can also leverage popular preset screens — carefully preconfigured filters designed to highlight interesting funds. To access these, click the current screen name (e.g., ETF vault) in the top-left corner and select Open screen…
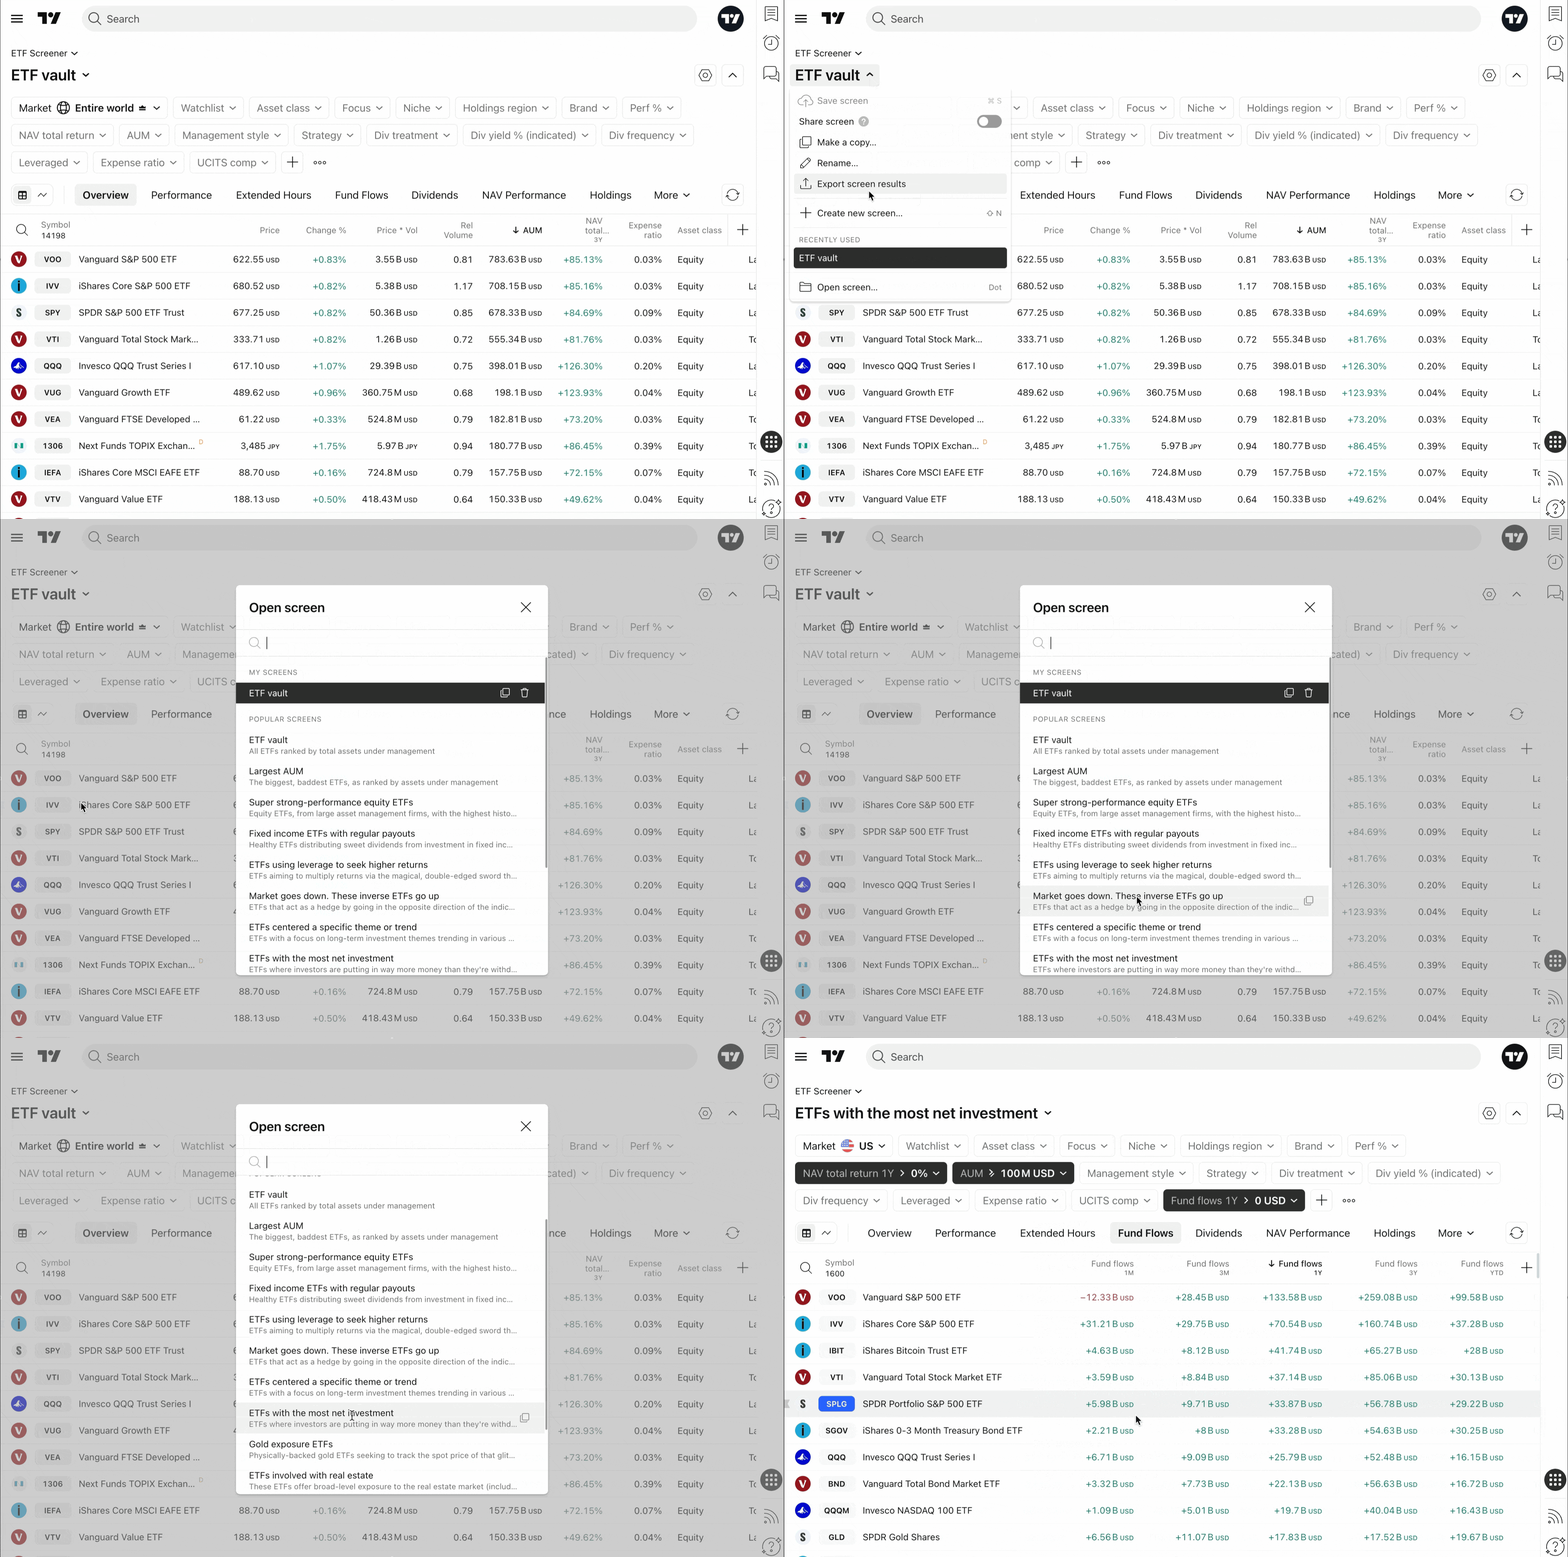
From this same dropdown, you can view recently used screens, export your results as a CSV file, or start a completely new screen.
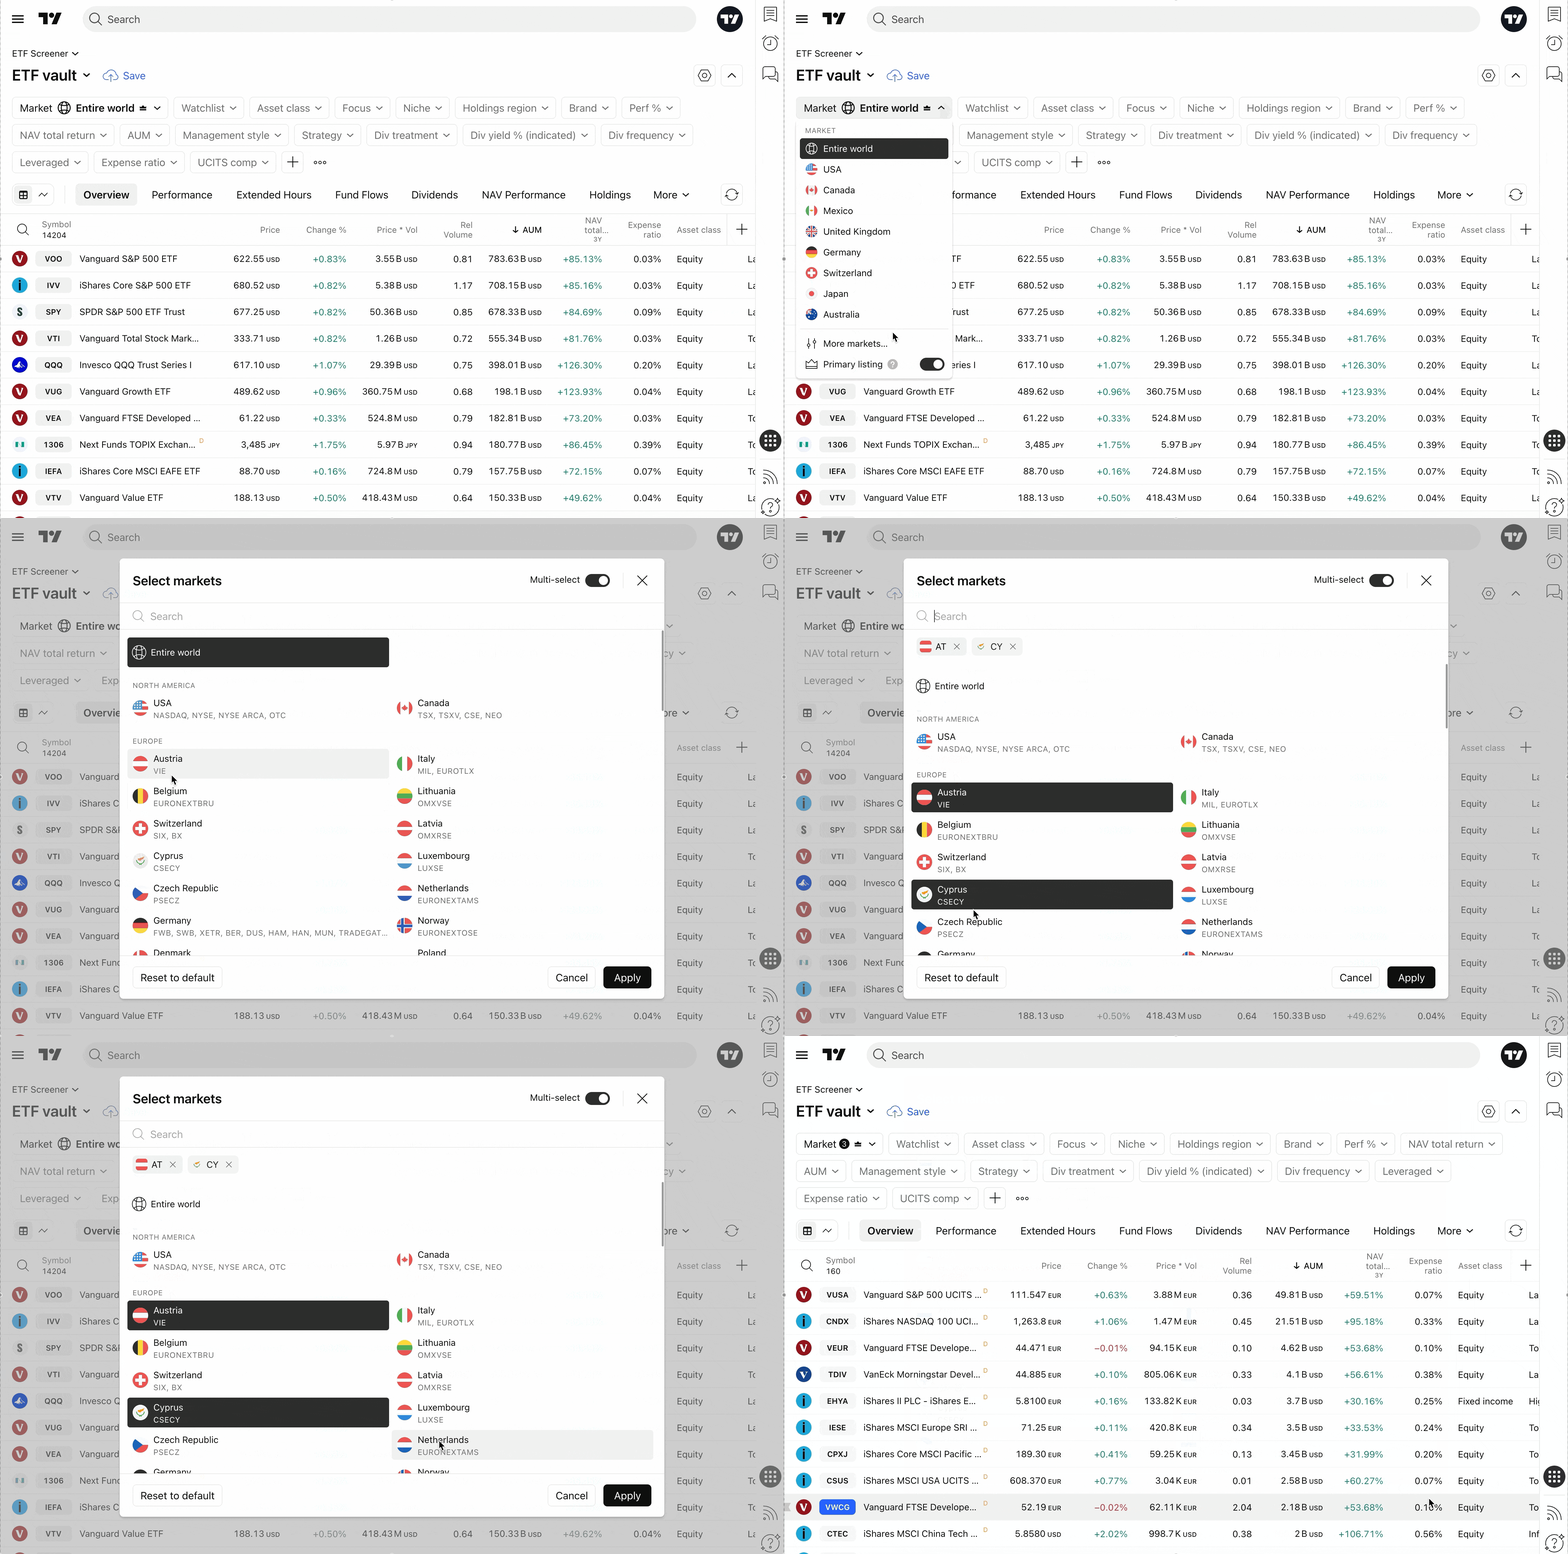
To change your target region, click the currently selected market and choose More markets… In the top-right corner of that menu, you can enable Multi-select to screen funds across two or more regions simultaneously.
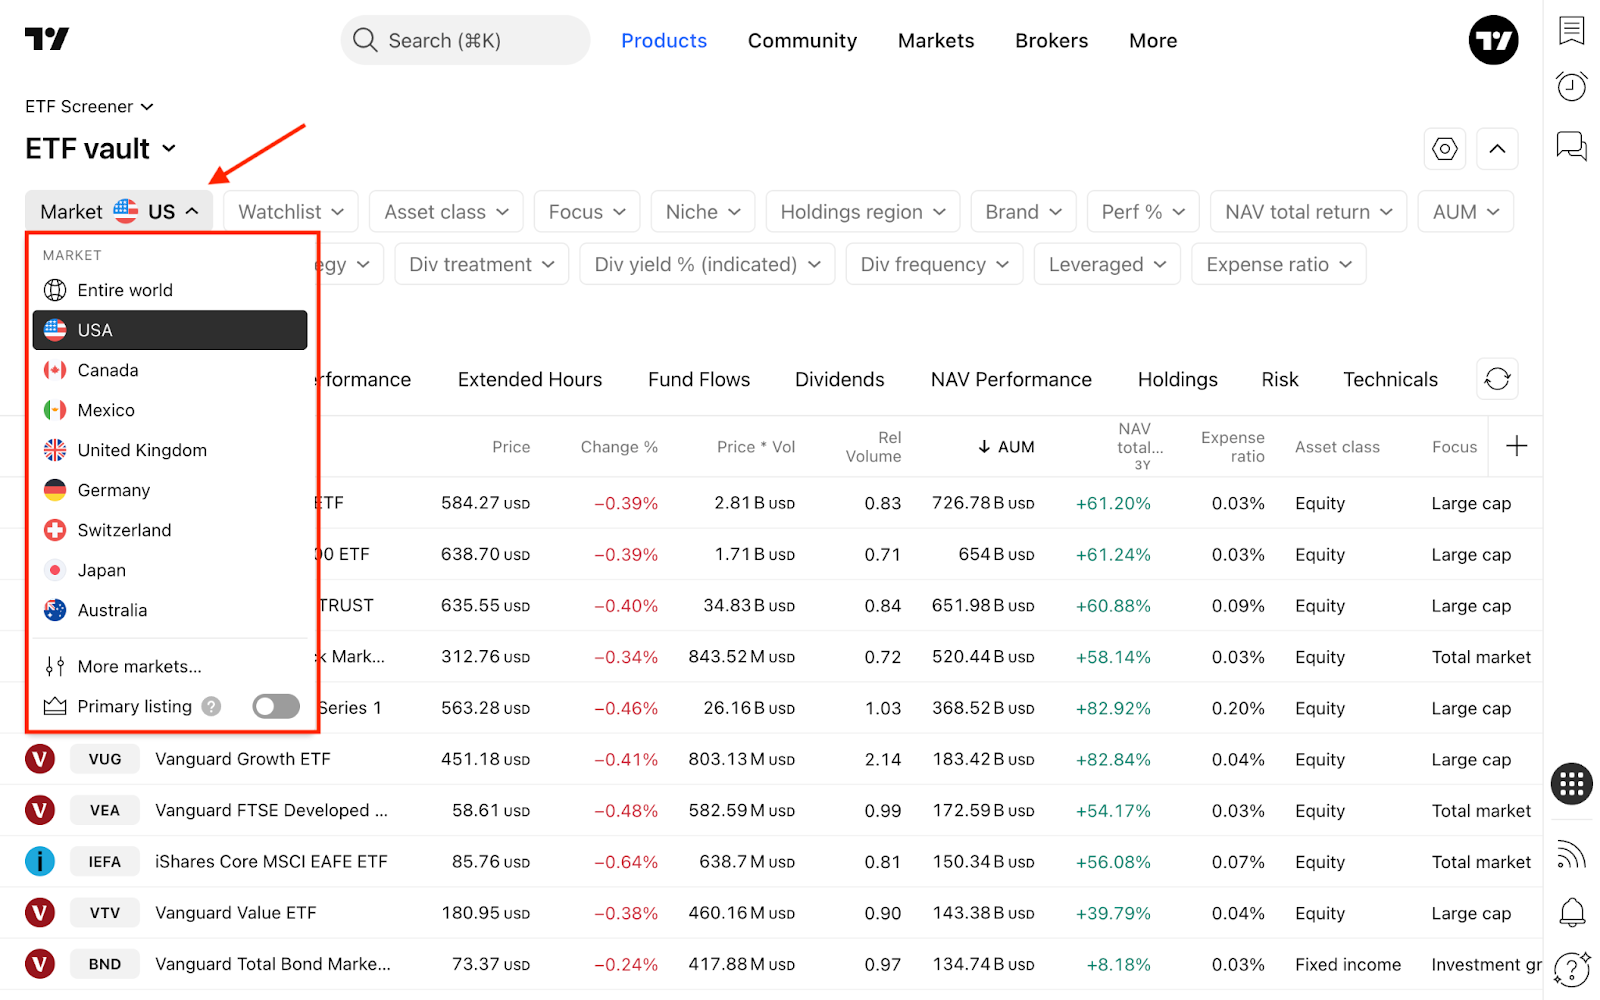
Consider toggling the Primary listing option. This ensures you only see ETFs from their main exchanges, keeping your workspace clean and free of duplicate cross-listings (though you can easily disable this if your analysis requires broader data).
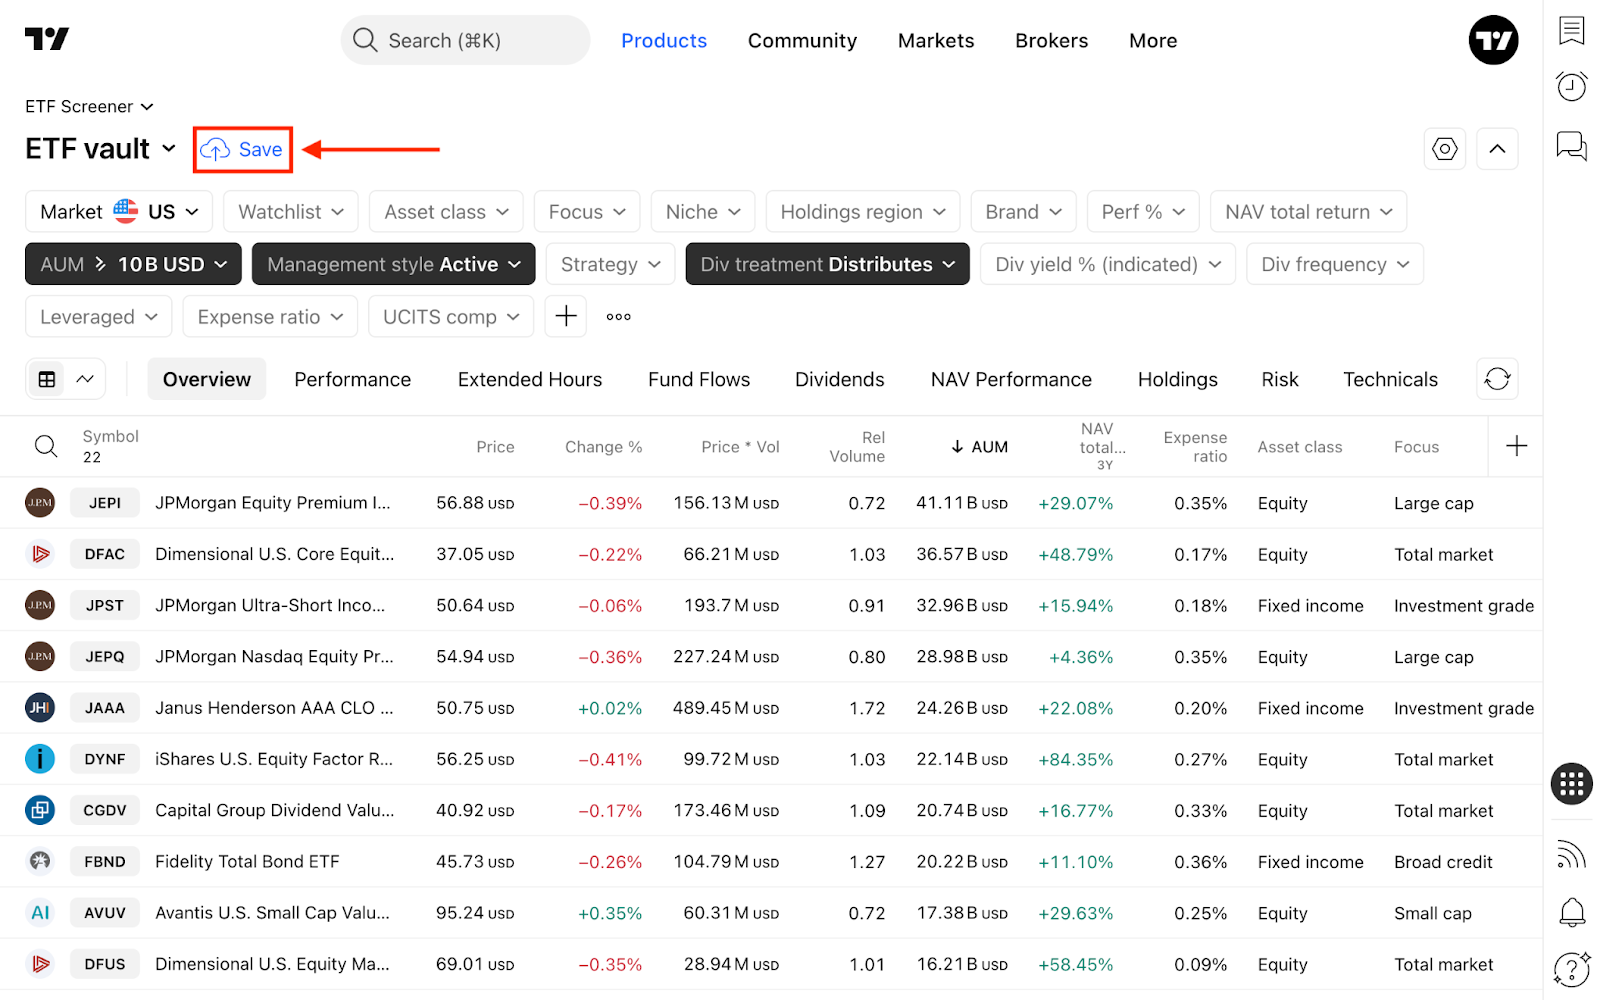
To create a personalized screen, simply select your desired filters, click the blue Save button that appears, and name your template.
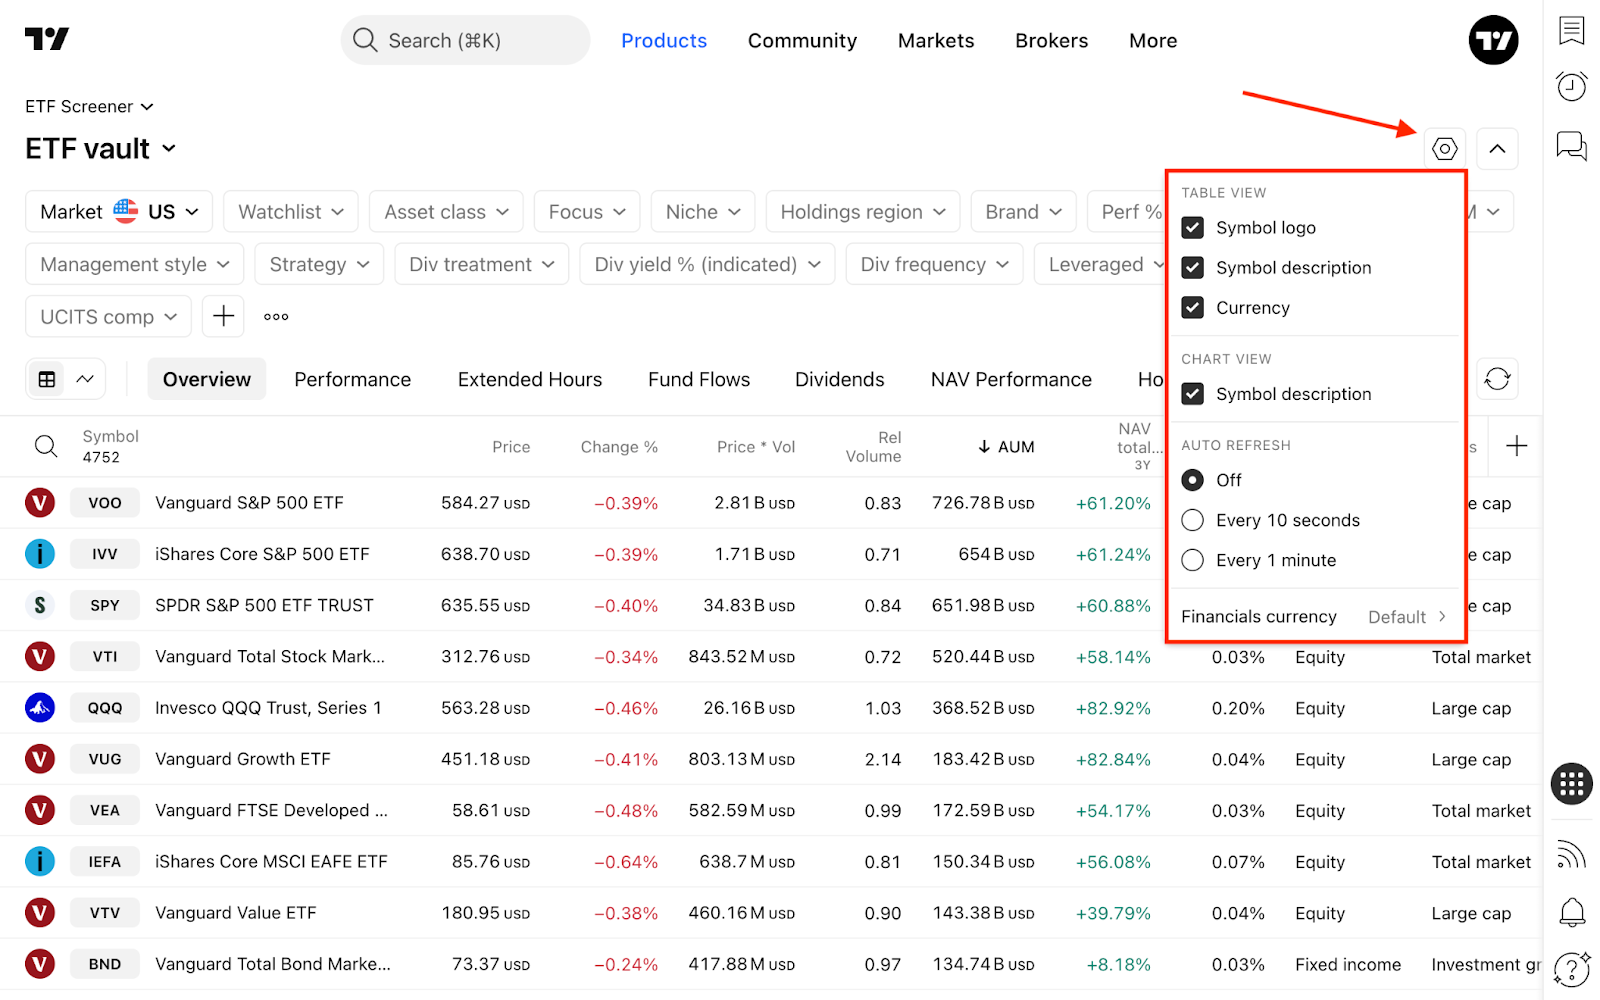
On the right side of the screen, you will find the Screener settings. Here you can customize visual preferences (symbol logos, descriptions, types, and currencies) and adjust the auto-refresh rate. You can also select your preferred base currency (USD, EUR, JPY, GBP, etc.) for translating financial metrics.
Once your screen is perfectly configured, click the Hide filters button to collapse the top panel, maximizing your workspace to analyze more funds at a glance.
Filters
The ETF Screener offers numerous metrics that can be applied as filters and added to your data columns. To do this, open the filter editing dialog and select your exact conditions.
To add new filter conditions, click the + button or press Shift + F.
- Security info: General fund details, such as exchange, issuer, tax form, and overarching strategy.
- Market data: Core trading metrics covering regular and extended-hours trading activity.
- Technicals: Technical indicators and studies that can be applied directly as filtering parameters.
- Analysis: Key fund features and fundamental fund metrics.
- Dividends: Income-focused filters including frequency, tax treatment, yield, and annual dividend amounts.
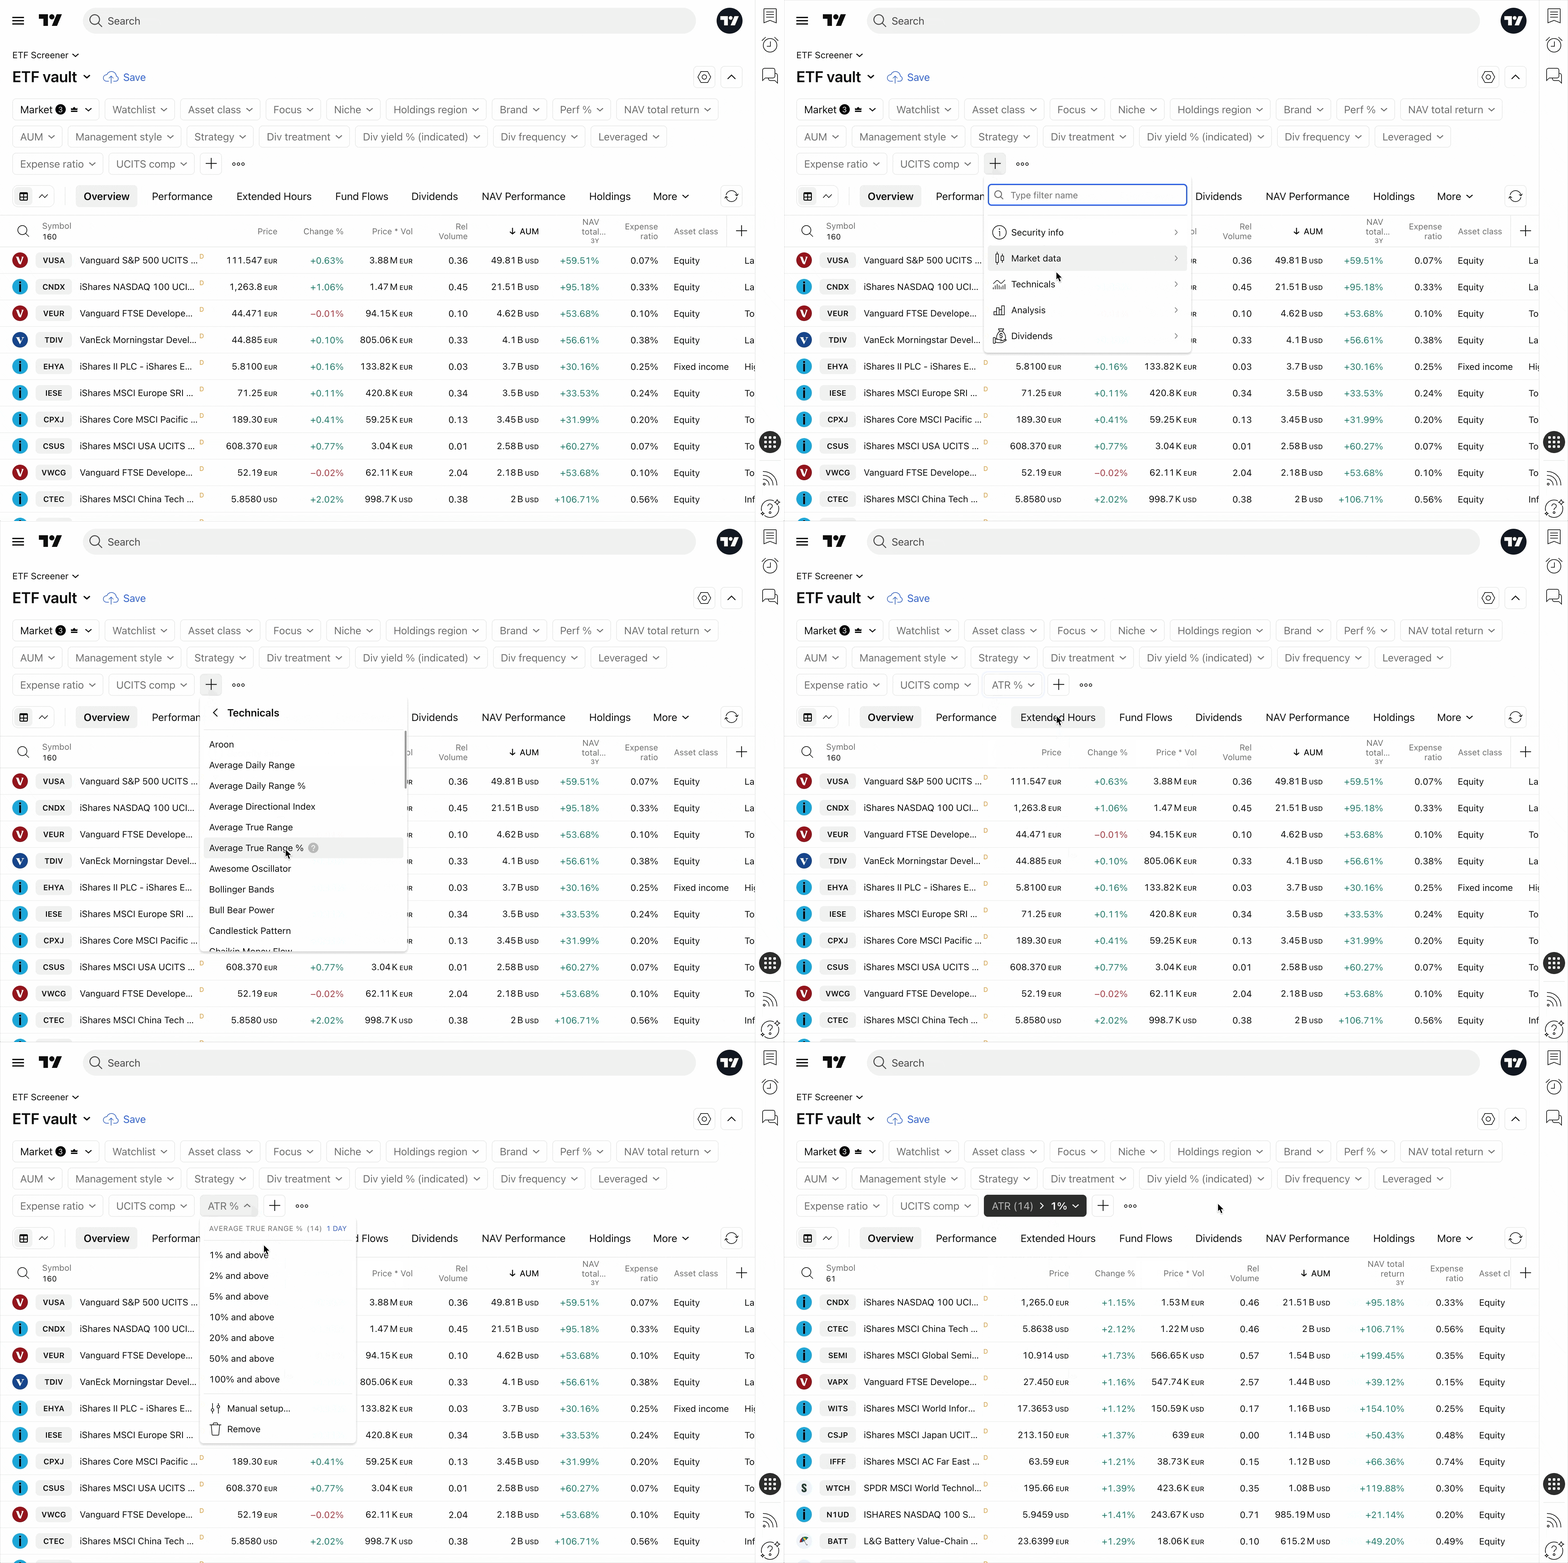
For many technical indicators — such as RSI, Stoch RSI, Momentum, EMA, SMA, and Keltner Channels — you can access an expanded set of customizable parameters to fine-tune your search.

Column sets
Below the filters, you will find column sets. Each set groups data tailored to a specific type of analysis. You can always add a custom column set using the + button on the right.
Here is a breakdown of the default column configurations:
- Overview: Key snapshot metrics, including price, price × volume, AUM, and asset class.
- Performance: A historical view of the fund's profitability and returns over various time horizons.
- Extended hours: Pre- and post-market price movements, percentage changes, gaps, and volume.
- Fund flows: Tracks the capital inflows and outflows (money the ETF attracted or lost) over time.
- Dividends: Income profiles showing dividend yield, payout frequency, and treatment.
- NAV performance: The percentage change in the fund's Net Asset Value.
- Holdings: Insights into the fund's geographic region, management style (active vs. passive), tracked index, and leverage factor.
- Risk: Beta and volatility metrics to help you gauge the fund's risk profile relative to the broader market.
- Technicals: A broad overview of key indicator signals, allowing you to scan technical setups across multiple funds without having to open individual charts.
Oh, and one more ETF…
On TradingView, your analysis doesn't have to stop at the screener. You can also visit the dedicated ETFs market page. There, you will find a comprehensive overview of recent community trade ideas, trending market themes, the latest ETF news, and other relevant information to perfectly complement your screener data.
Also read: