TradingView Pine Screener: key features and requirements
The Pine Screener is an advanced financial analysis tool on TradingView that allows you to scan your custom watchlists and indices using Pine Script® — TradingView's proprietary programming language. This means you can filter, compare, and discover trading opportunities using your own custom indicators, built-in technicals, or community scripts.
CONTENTS:
- What is the Pine Screener?
- Pine Screener main features
- How to use the Pine Screener
- Selecting a source
- Selecting an indicator
- Setting up filtration
- Table
- Scan
- Pine Screener requirements
What is the Pine Screener?
The Pine Screener is designed to give you a highly customized market overview by scanning specific sets of symbols against custom conditions.
To use it to its full potential, it is highly recommended that you first learn how to build and manage watchlists. Once you create a custom symbol watchlist (or select a broader index), you can scan those specific assets using the screener to find promising opportunities for your portfolio.
The Pine Screener is incredibly versatile — it can scan a full watchlist containing a mix of stocks, crypto symbols, bonds, and other assets simultaneously.
Pine Screener main features
The tool operates by combining a Source with an Indicator.
1. Available sources (what you scan):
- Your custom watchlists (including colored lists).
- Major market indices.
2. Available indicators (how you scan):
You can use any indicator saved in your favorites, including:
- Your personal, custom-coded Pine scripts.
- TradingView's built-in technical indicators.
- Community indicators from the public library.
Once you apply your filters, the screener outputs a table of symbols that meet your exact parameters. You can also analyze the plotted values of your chosen indicator for each symbol directly in the table and sort the results accordingly.
You can also analyze the values of the plots of your studies for each symbol in the table and sort the values by the selected plot.
How to use the Pine Screener
1. Access the tool
From the TradingView home page, go to Products → Screeners → Pine.
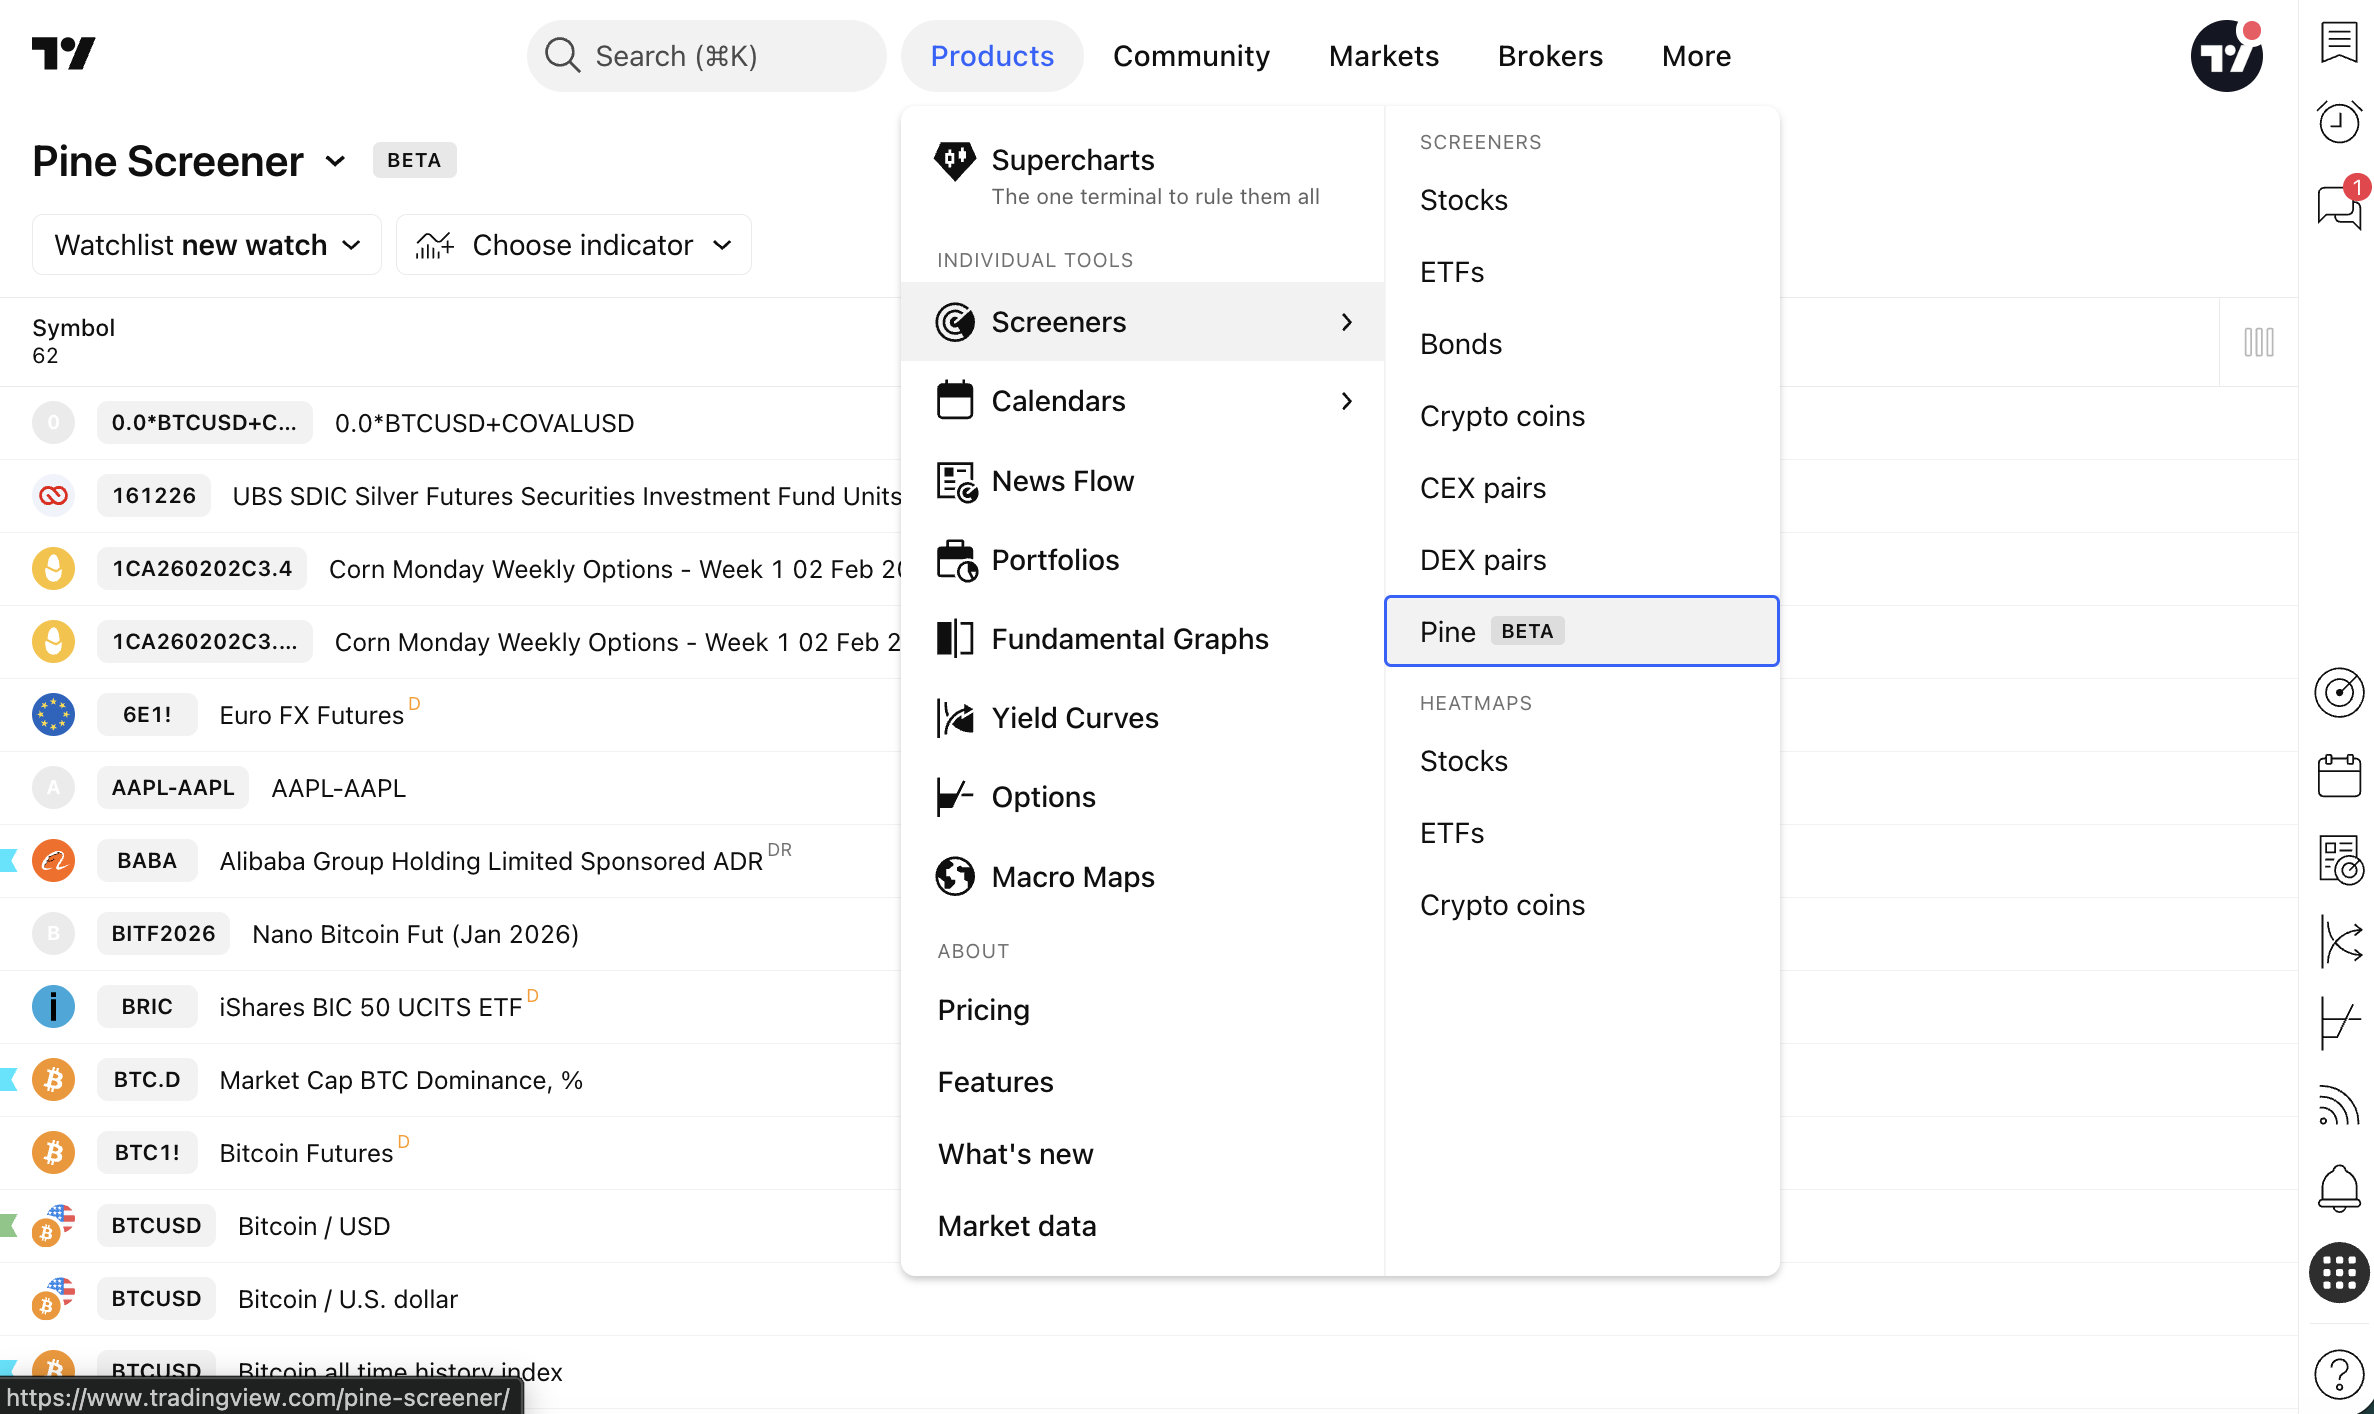
In short, working with the Pine Screener involves four steps:
- Select the source.
- Select an indicator.
- Set the filtering criteria for the selected indicator.
- Scan.
Selecting a source
The source is the set of symbols you want to scan. Click the source pill to open the selector, then choose a source in one of two tabs:
- Watchlists: Any of your custom or curated watchlists.
- Indices: An index, displayed with its icon, ticker, and full name.
When you select a source, its symbols are loaded into the table immediately. To calculate the indicator values for the selected source, start a new scan. Each tab features its own search function that matches both full and partial names, highlights matching terms, and clears automatically when you switch tabs. If no results match, the tab displays an empty state.
You can scan only one source at a time. The source selection cannot be emptied—selecting a new one will always replace the previous selection.
Your selected source is saved and pre-selected the next time you open the Pine Screener. If it becomes unavailable (for example, if a watchlist was deleted or you lost access to it), the screener automatically falls back to your default watchlist.
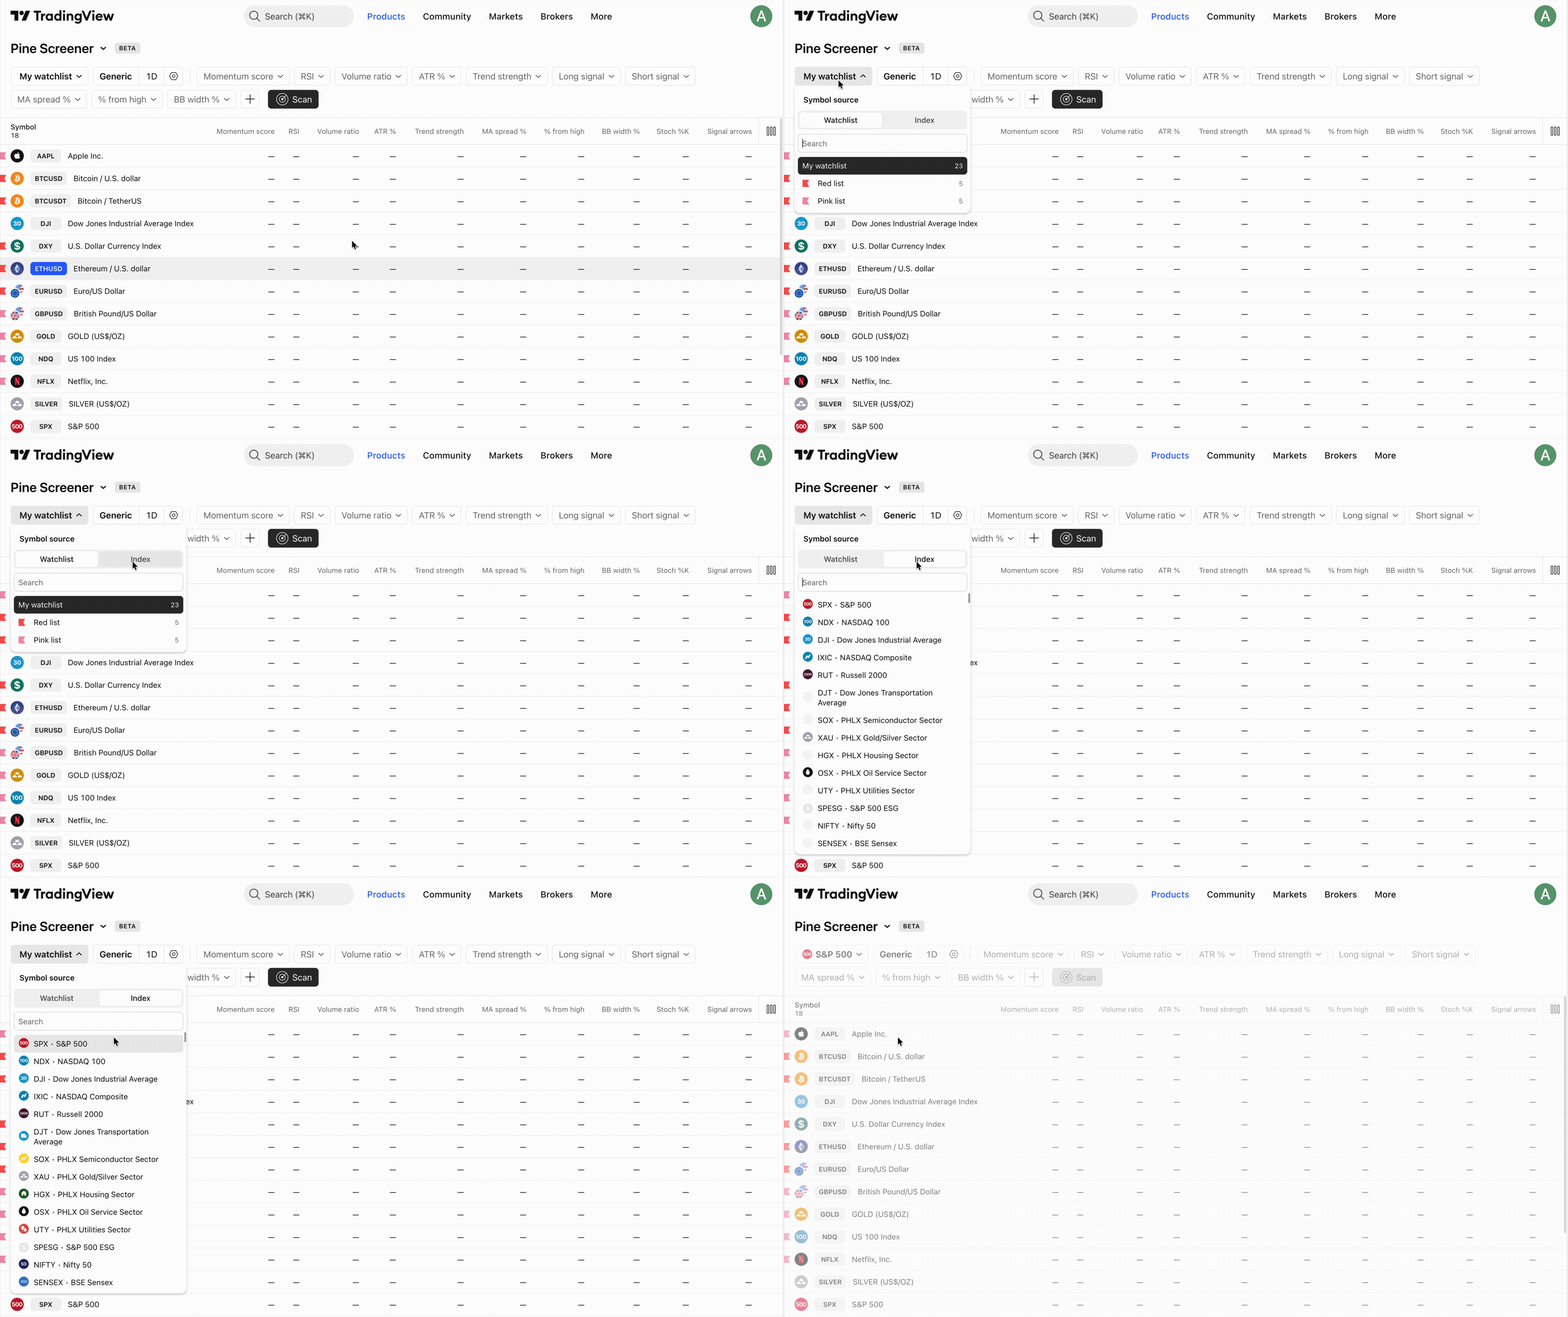
If the selected list contains symbols, the table containing all of them will load immediately.
Selecting an indicator
By default, no script is selected. You can choose a script for scanning by clicking the Add indicator button. Clicking this button opens a dialog showing all available scripts.
Note: The Pine Screener does not support the Financials category in the dialog. It also does not support profiles, strategies, or patterns.
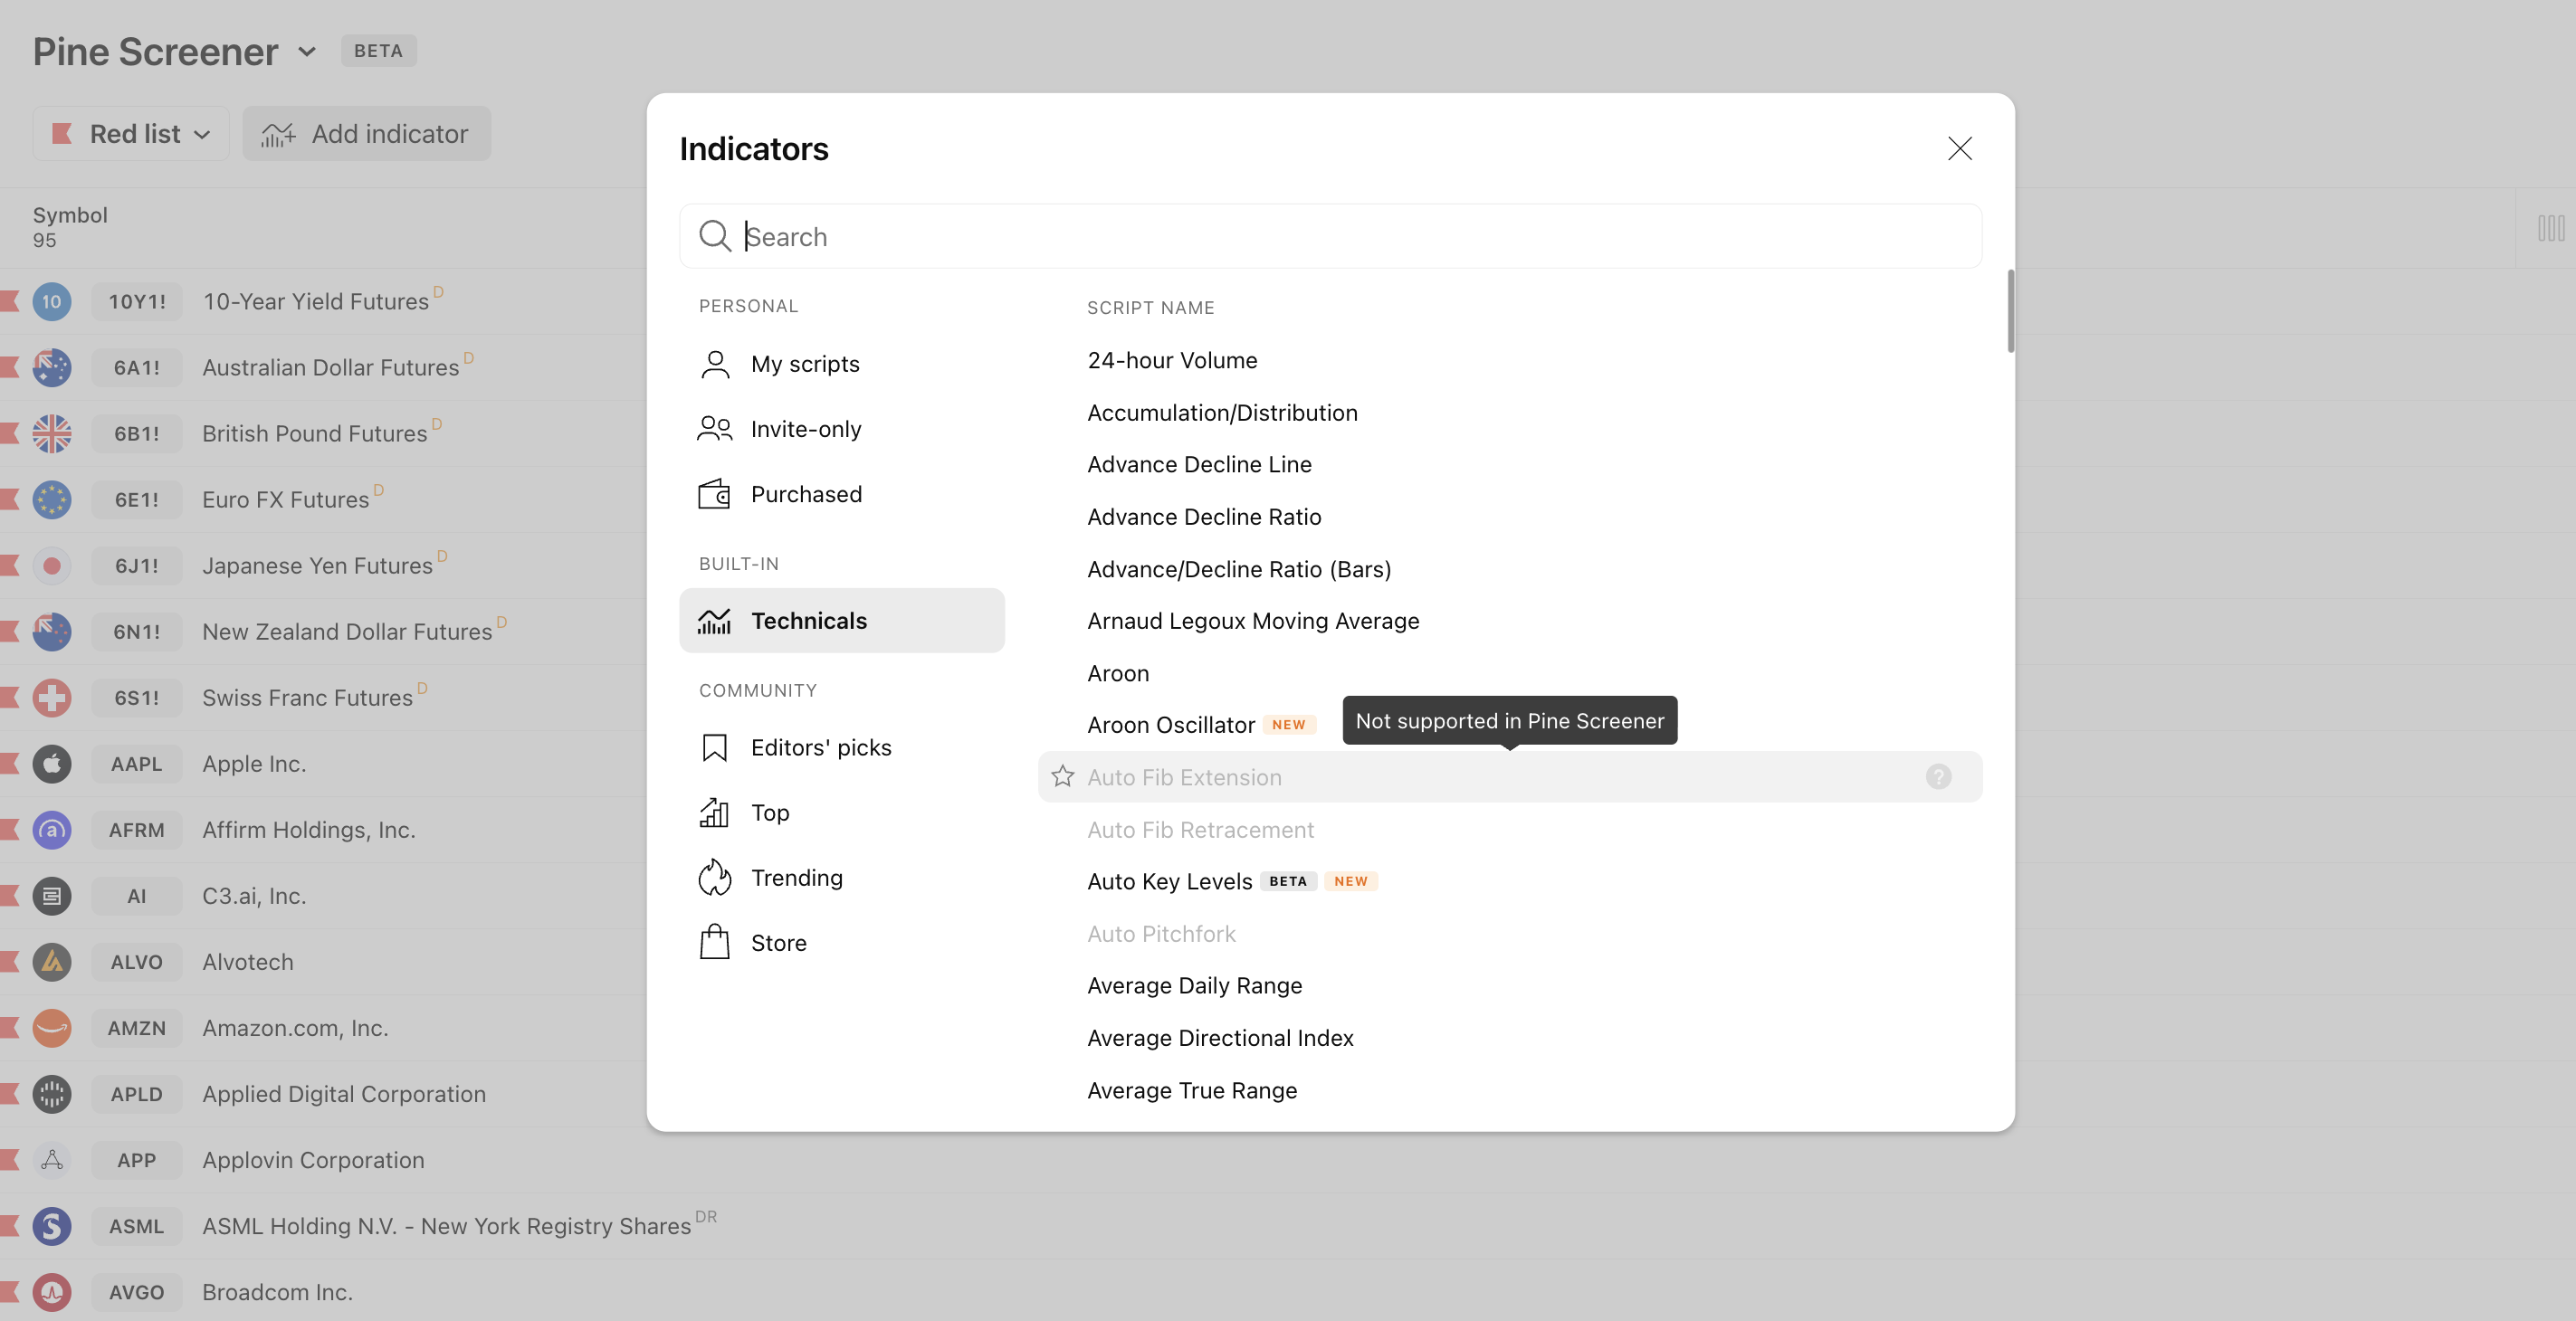
If an indicator appears inactive in the dialog, it is missing at least one of the following:
- An alertcondition()
- Supported plot types: plot(), plotbar(), plotcandle(), plotchar(), plotshape(), plotarrow(), hline().
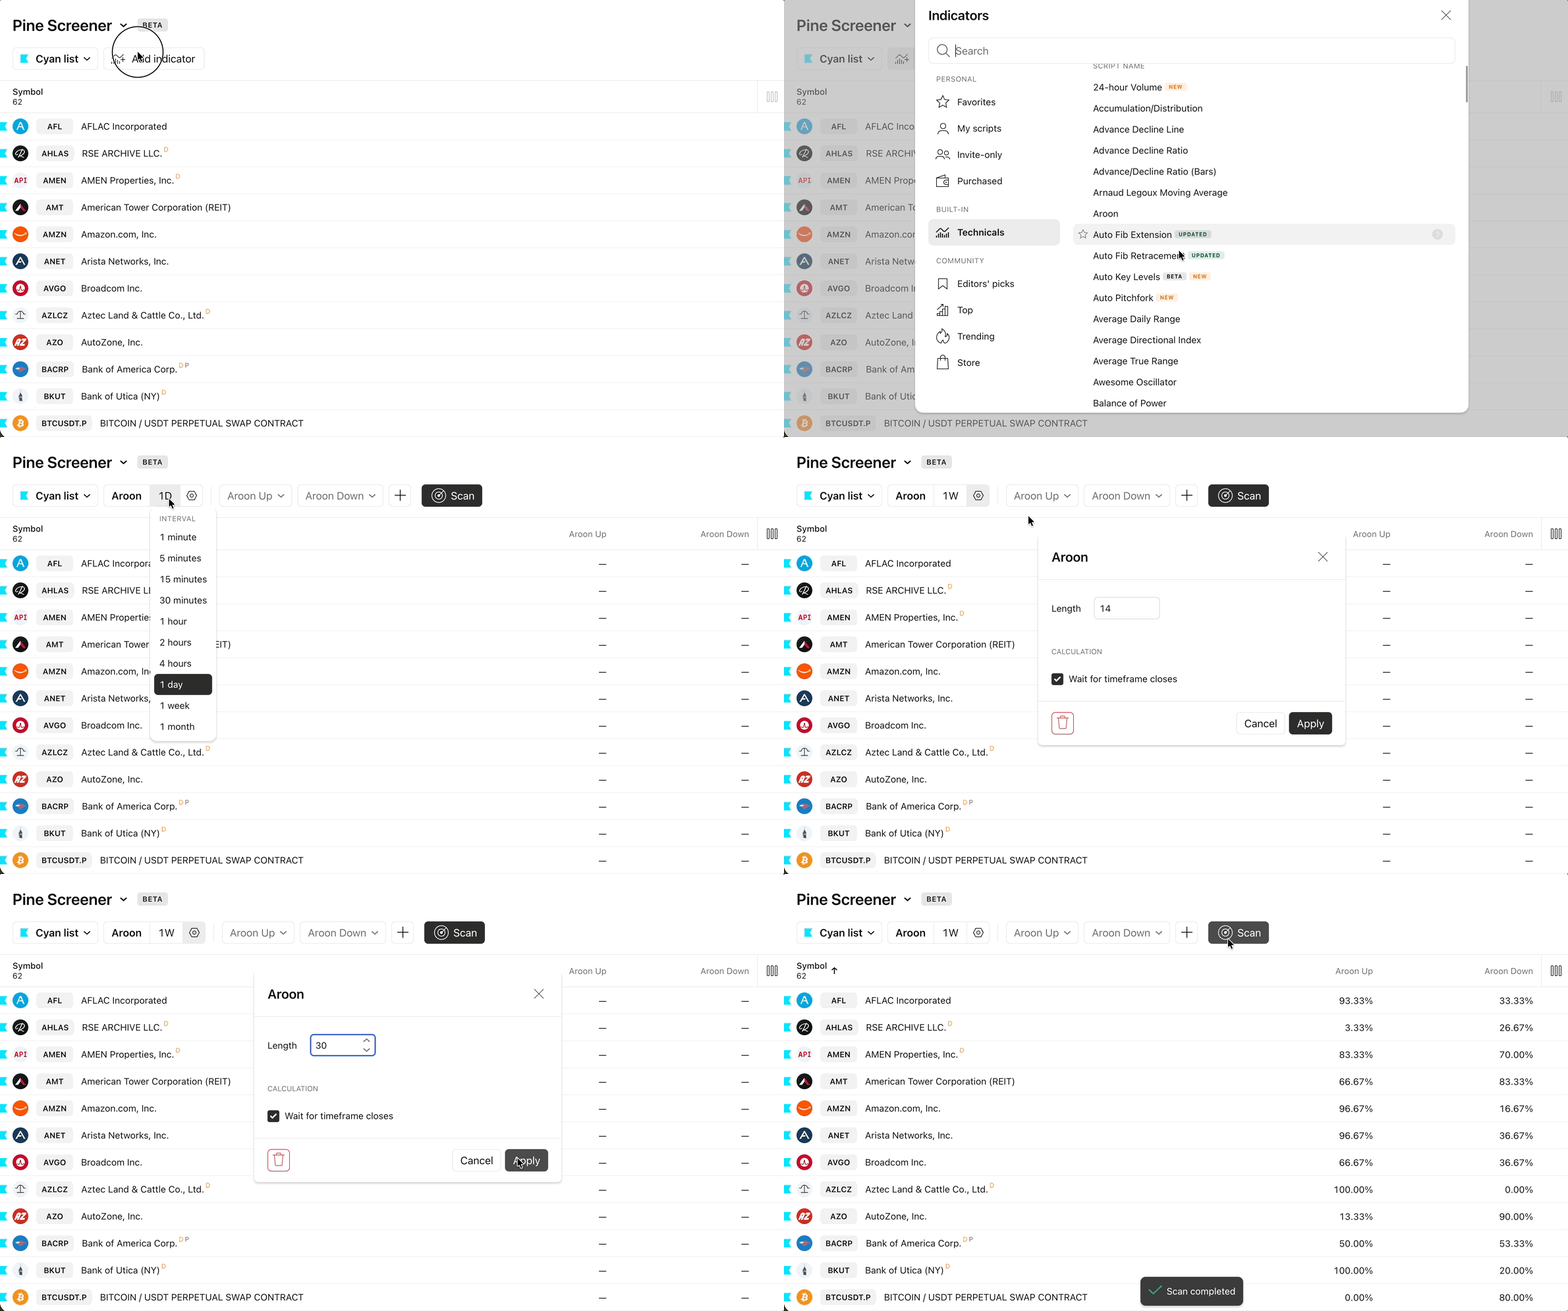
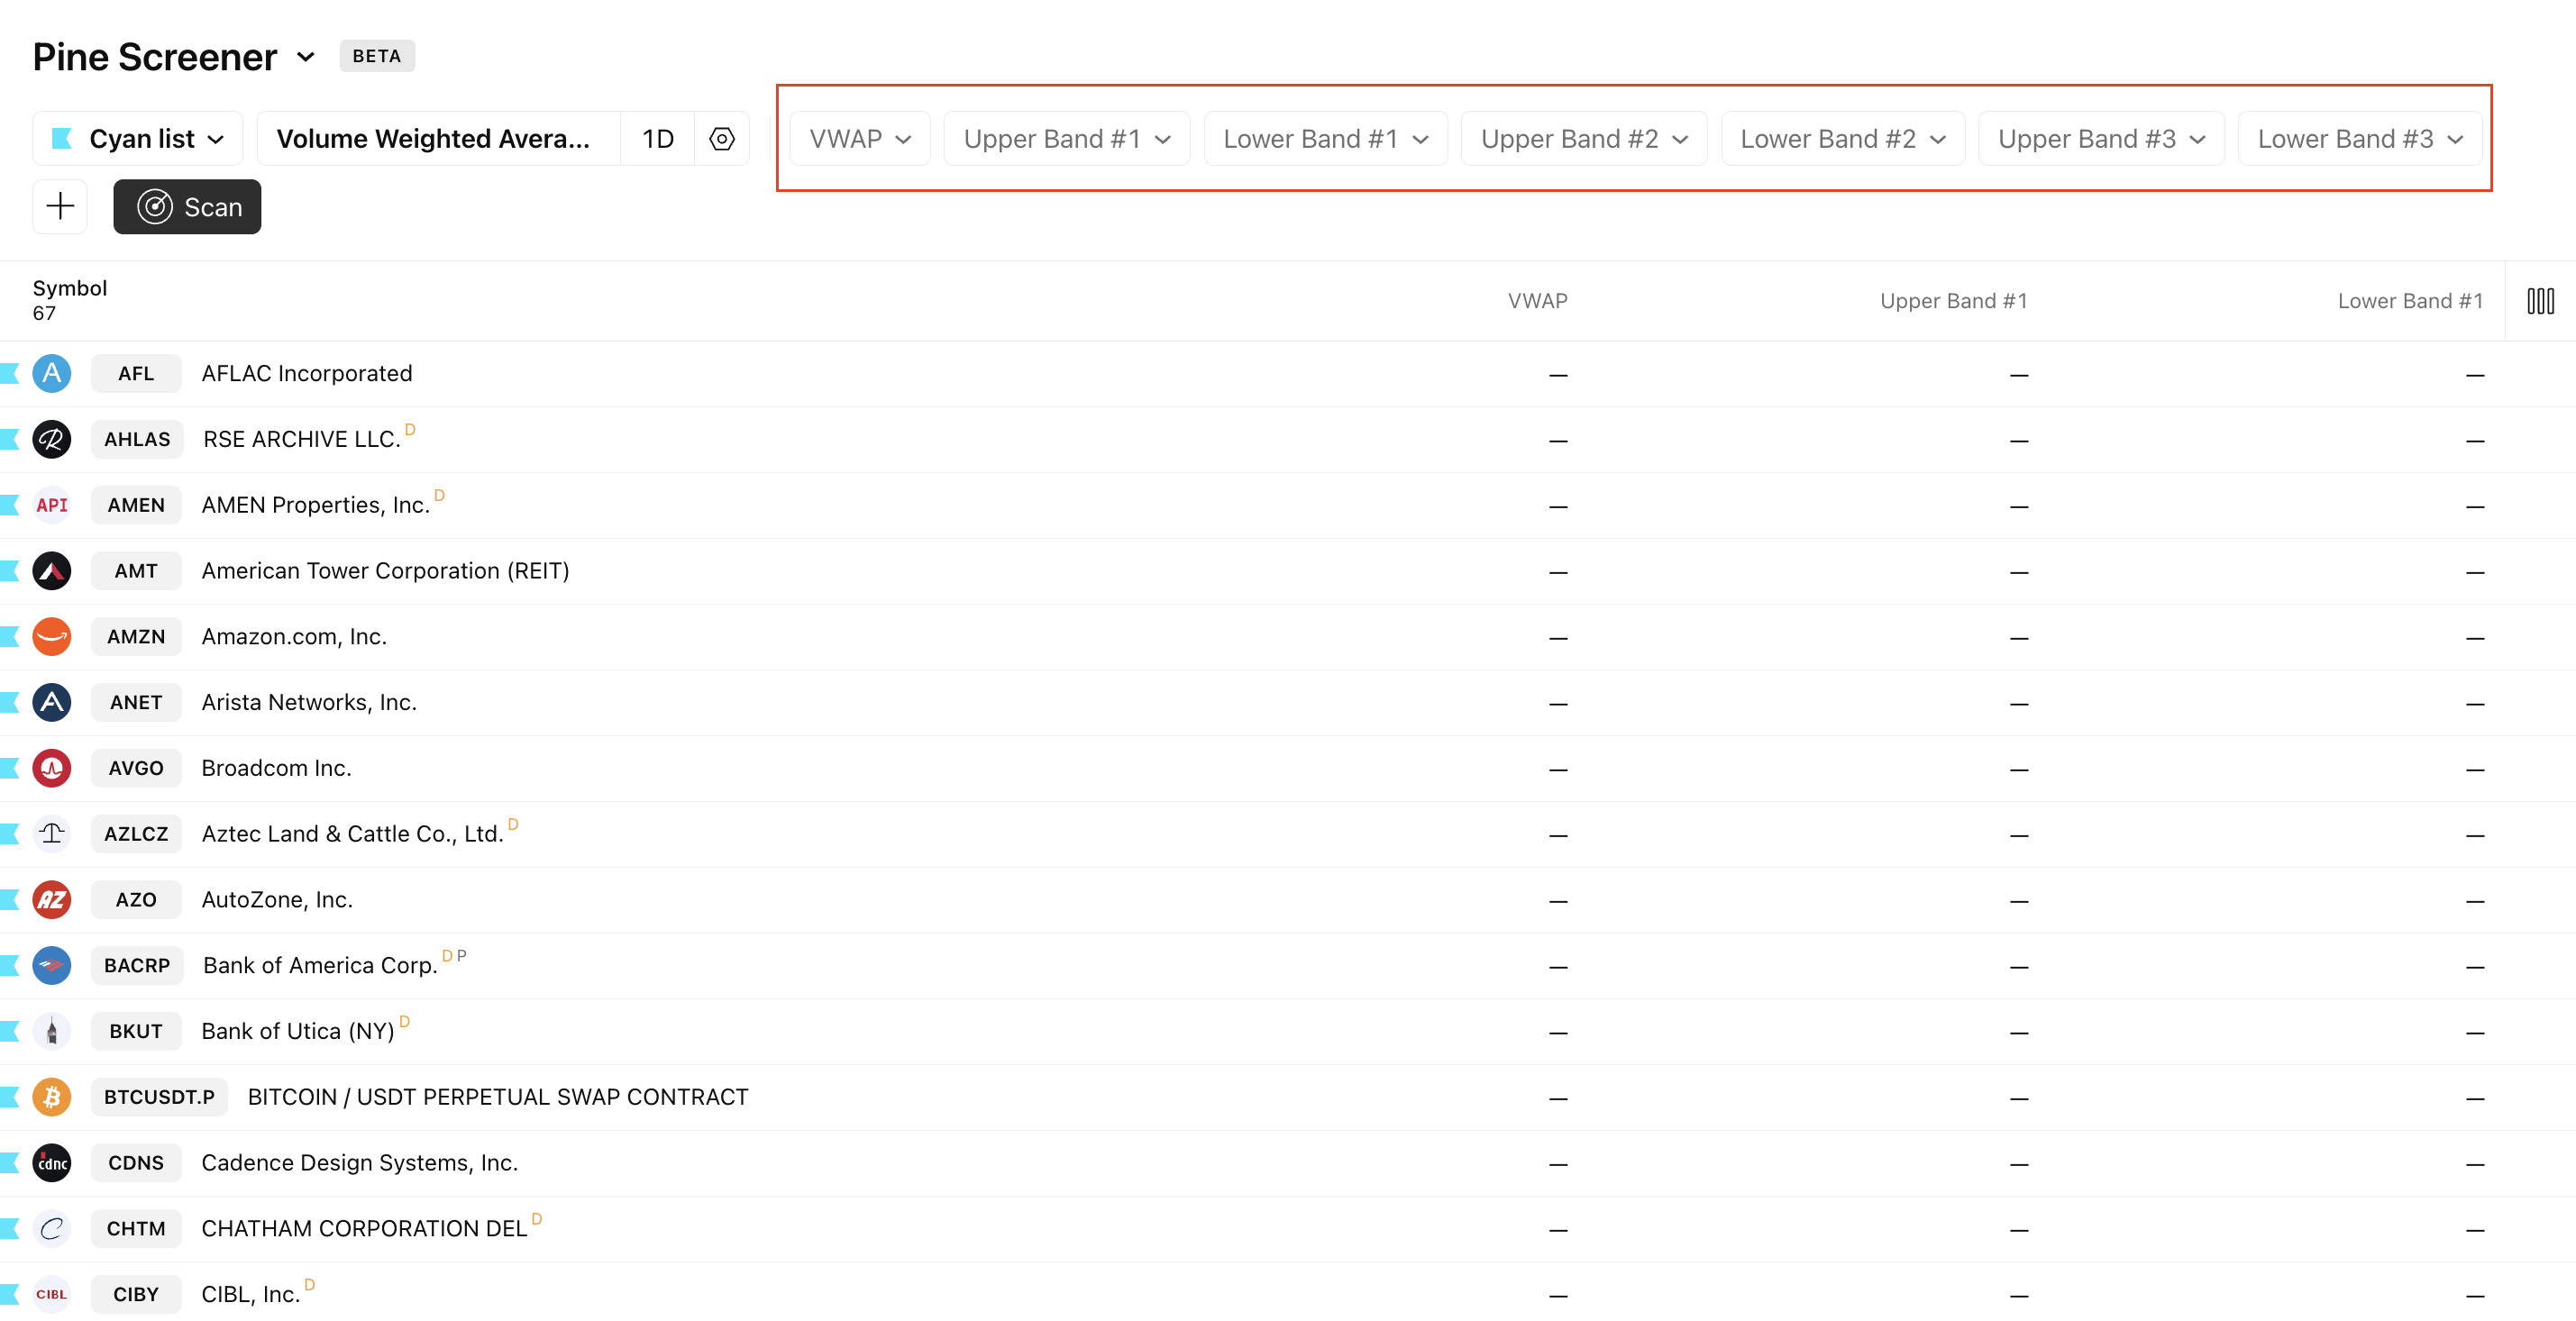
When your selected indicator is loaded, the following conditions are applied automatically:
- The first ten plots are added for subsequent filter configuration.
- These plots are added to the table as columns.
- Two alert conditions from the script are added.
- Options to add additional filters or columns will appear.
- The Scan button will appear.
Setting up filtration
You can use both indicator plots and alert conditions as a starting template for your filters. These can be selected in the upper toolbar once the script is launched.
As filters, you can use:
- Indicator plots
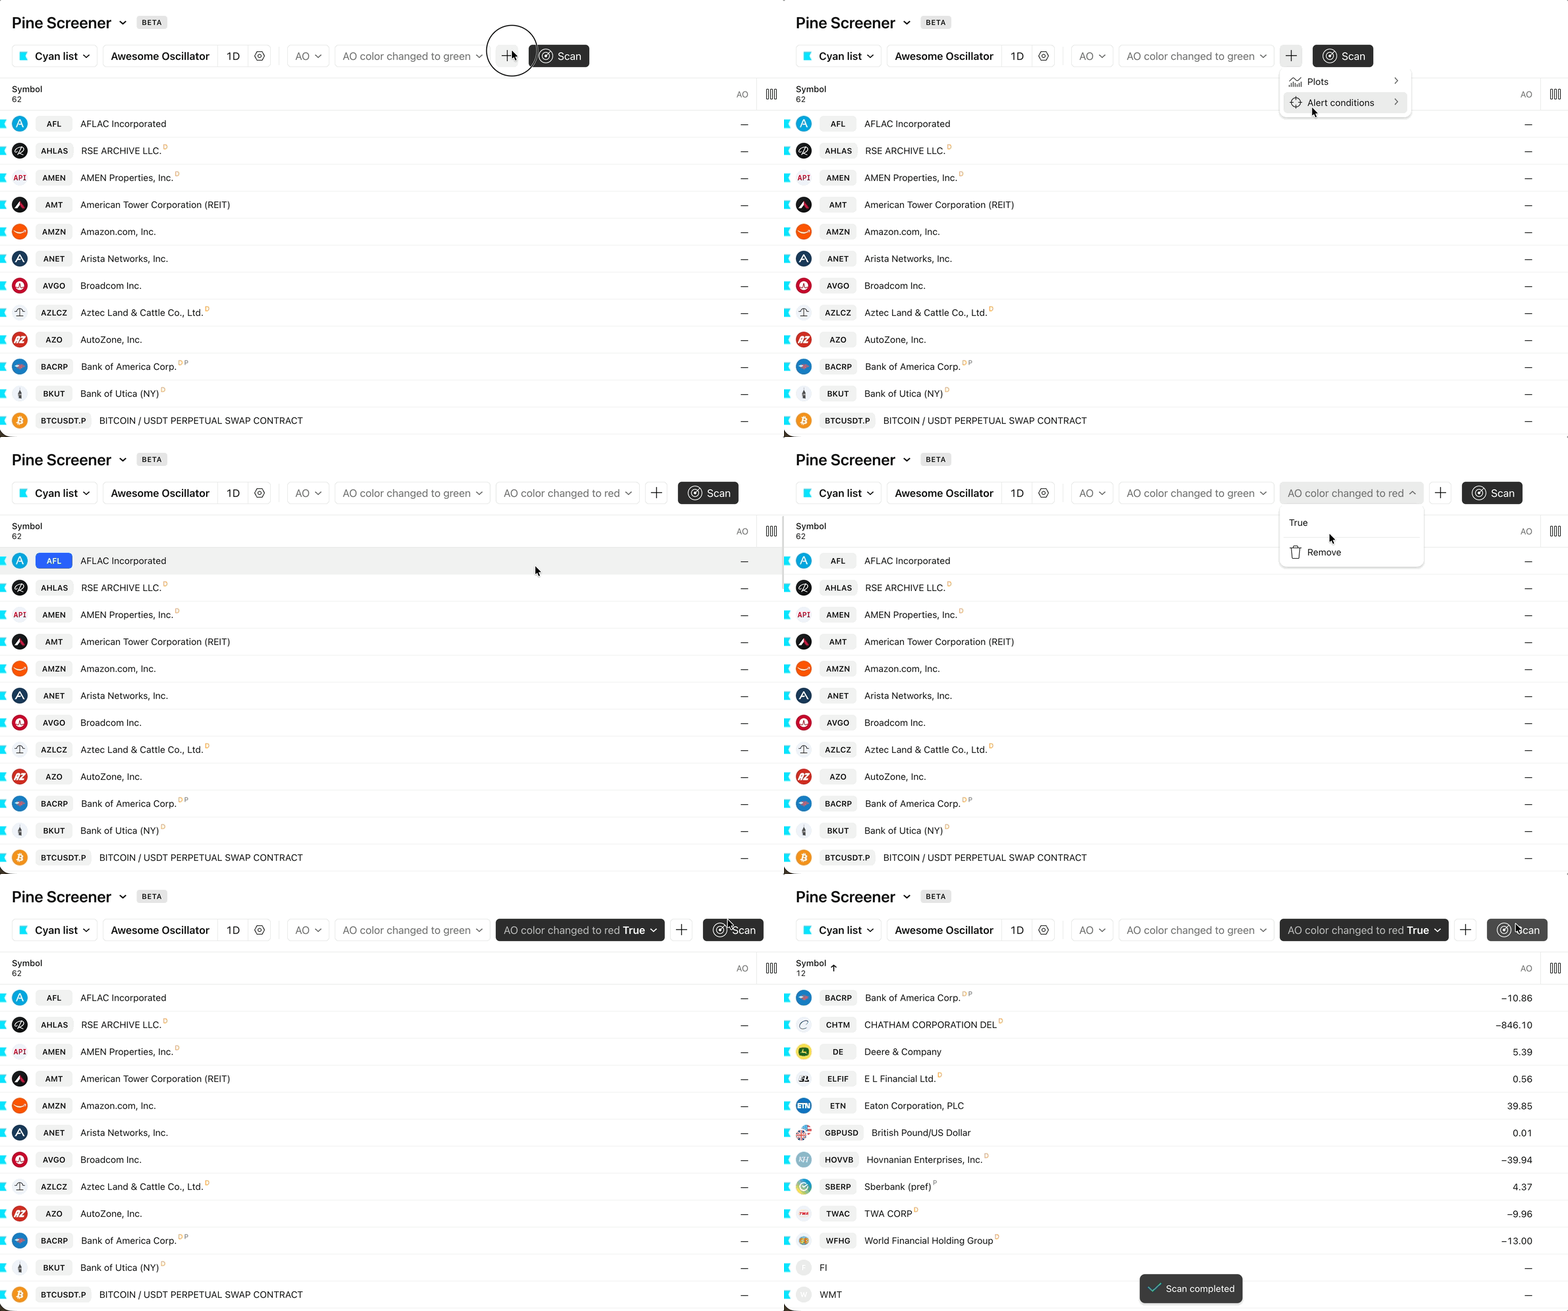
- Indicator alert conditions
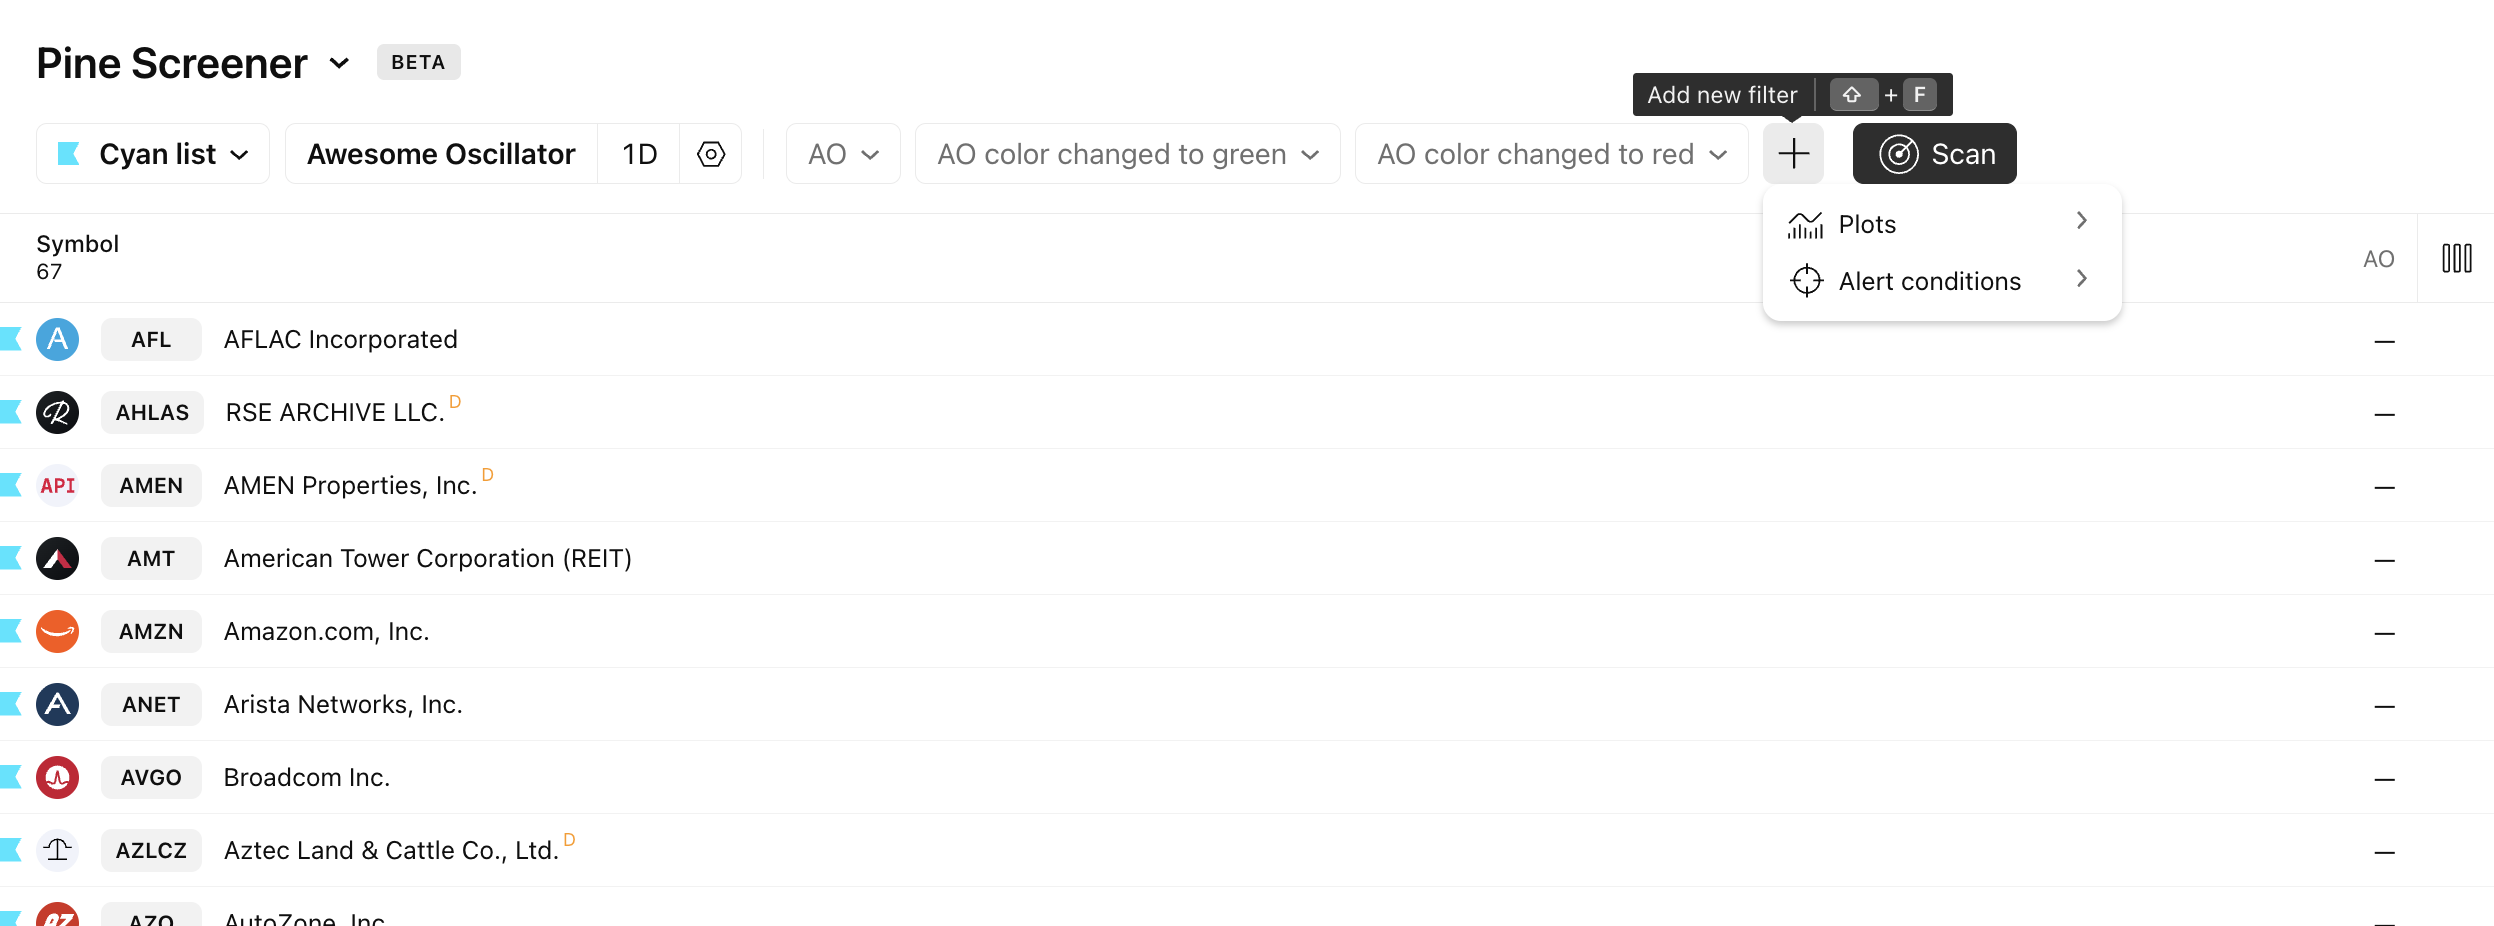
If you want to use an indicator plot as a filter, you need to define the filtering condition and set the target value.
Table
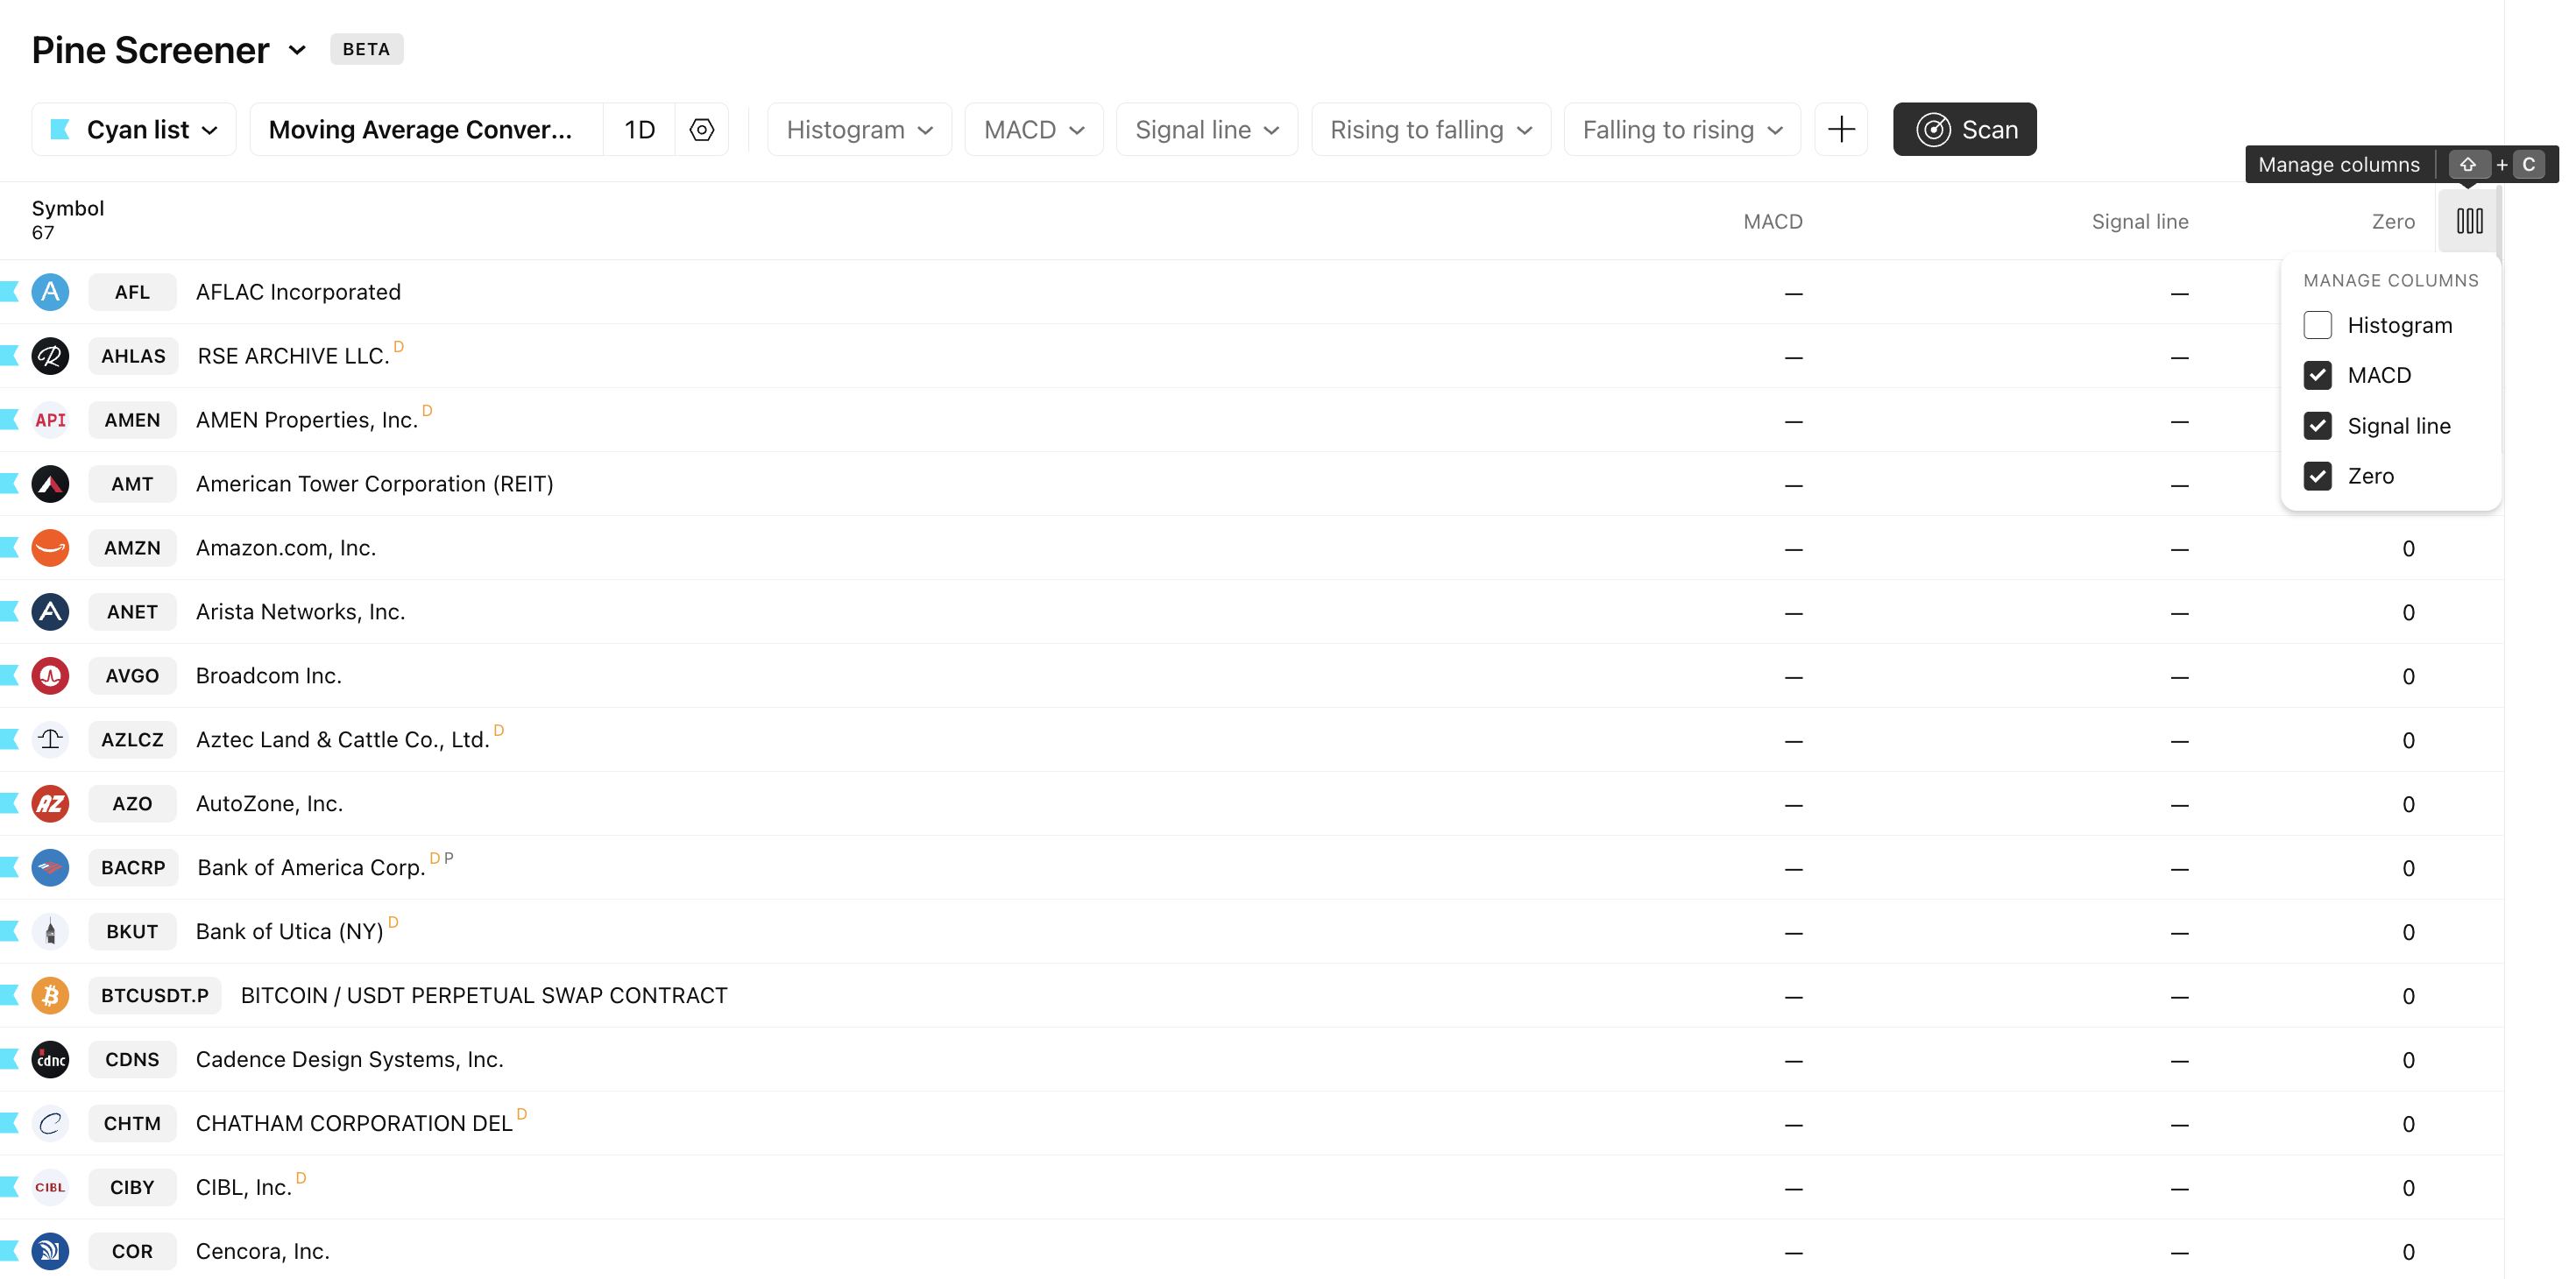
In the table, you can control the visibility of plots that already exist in your script. You cannot add arbitrary external data — you can only enable or disable the display of previously defined plots.
Note: Only plots are available for display in the table. To change which plots are shown, click the button in the top-right corner of the table.
Scan
You can initiate a scan after choosing an indicator.
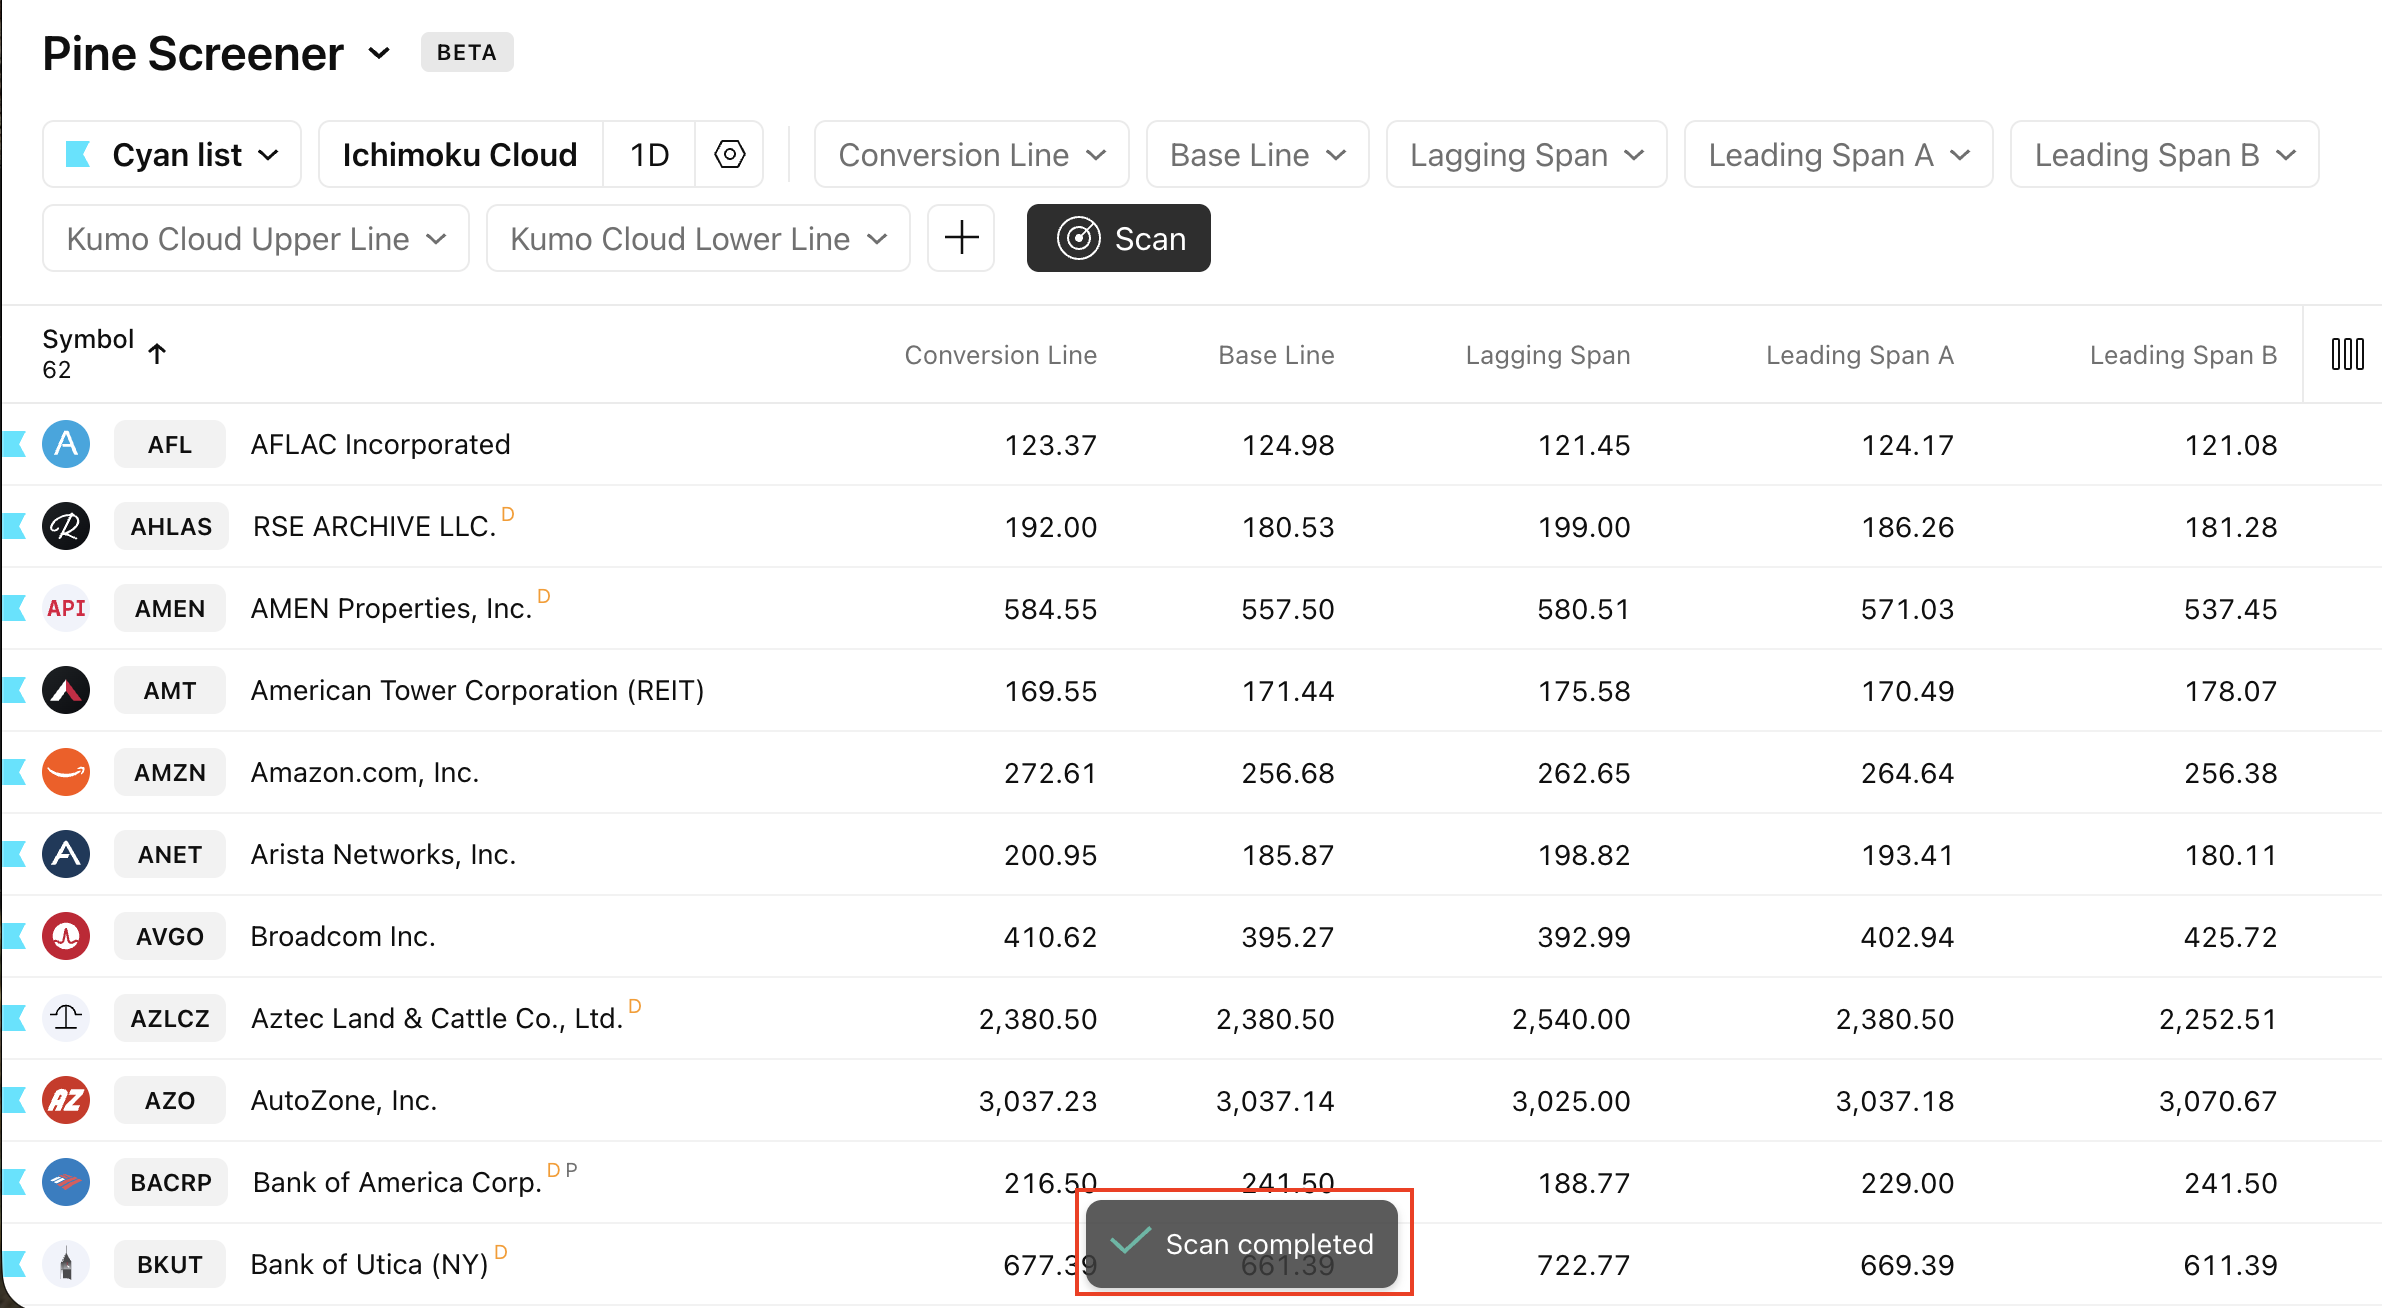
When launched, the scan bar will appear. If the scan takes longer than a few seconds, a progress bar will display its completion percentage. Once finished, an update bar with summary statistics will appear, allowing you to interact with the results table.
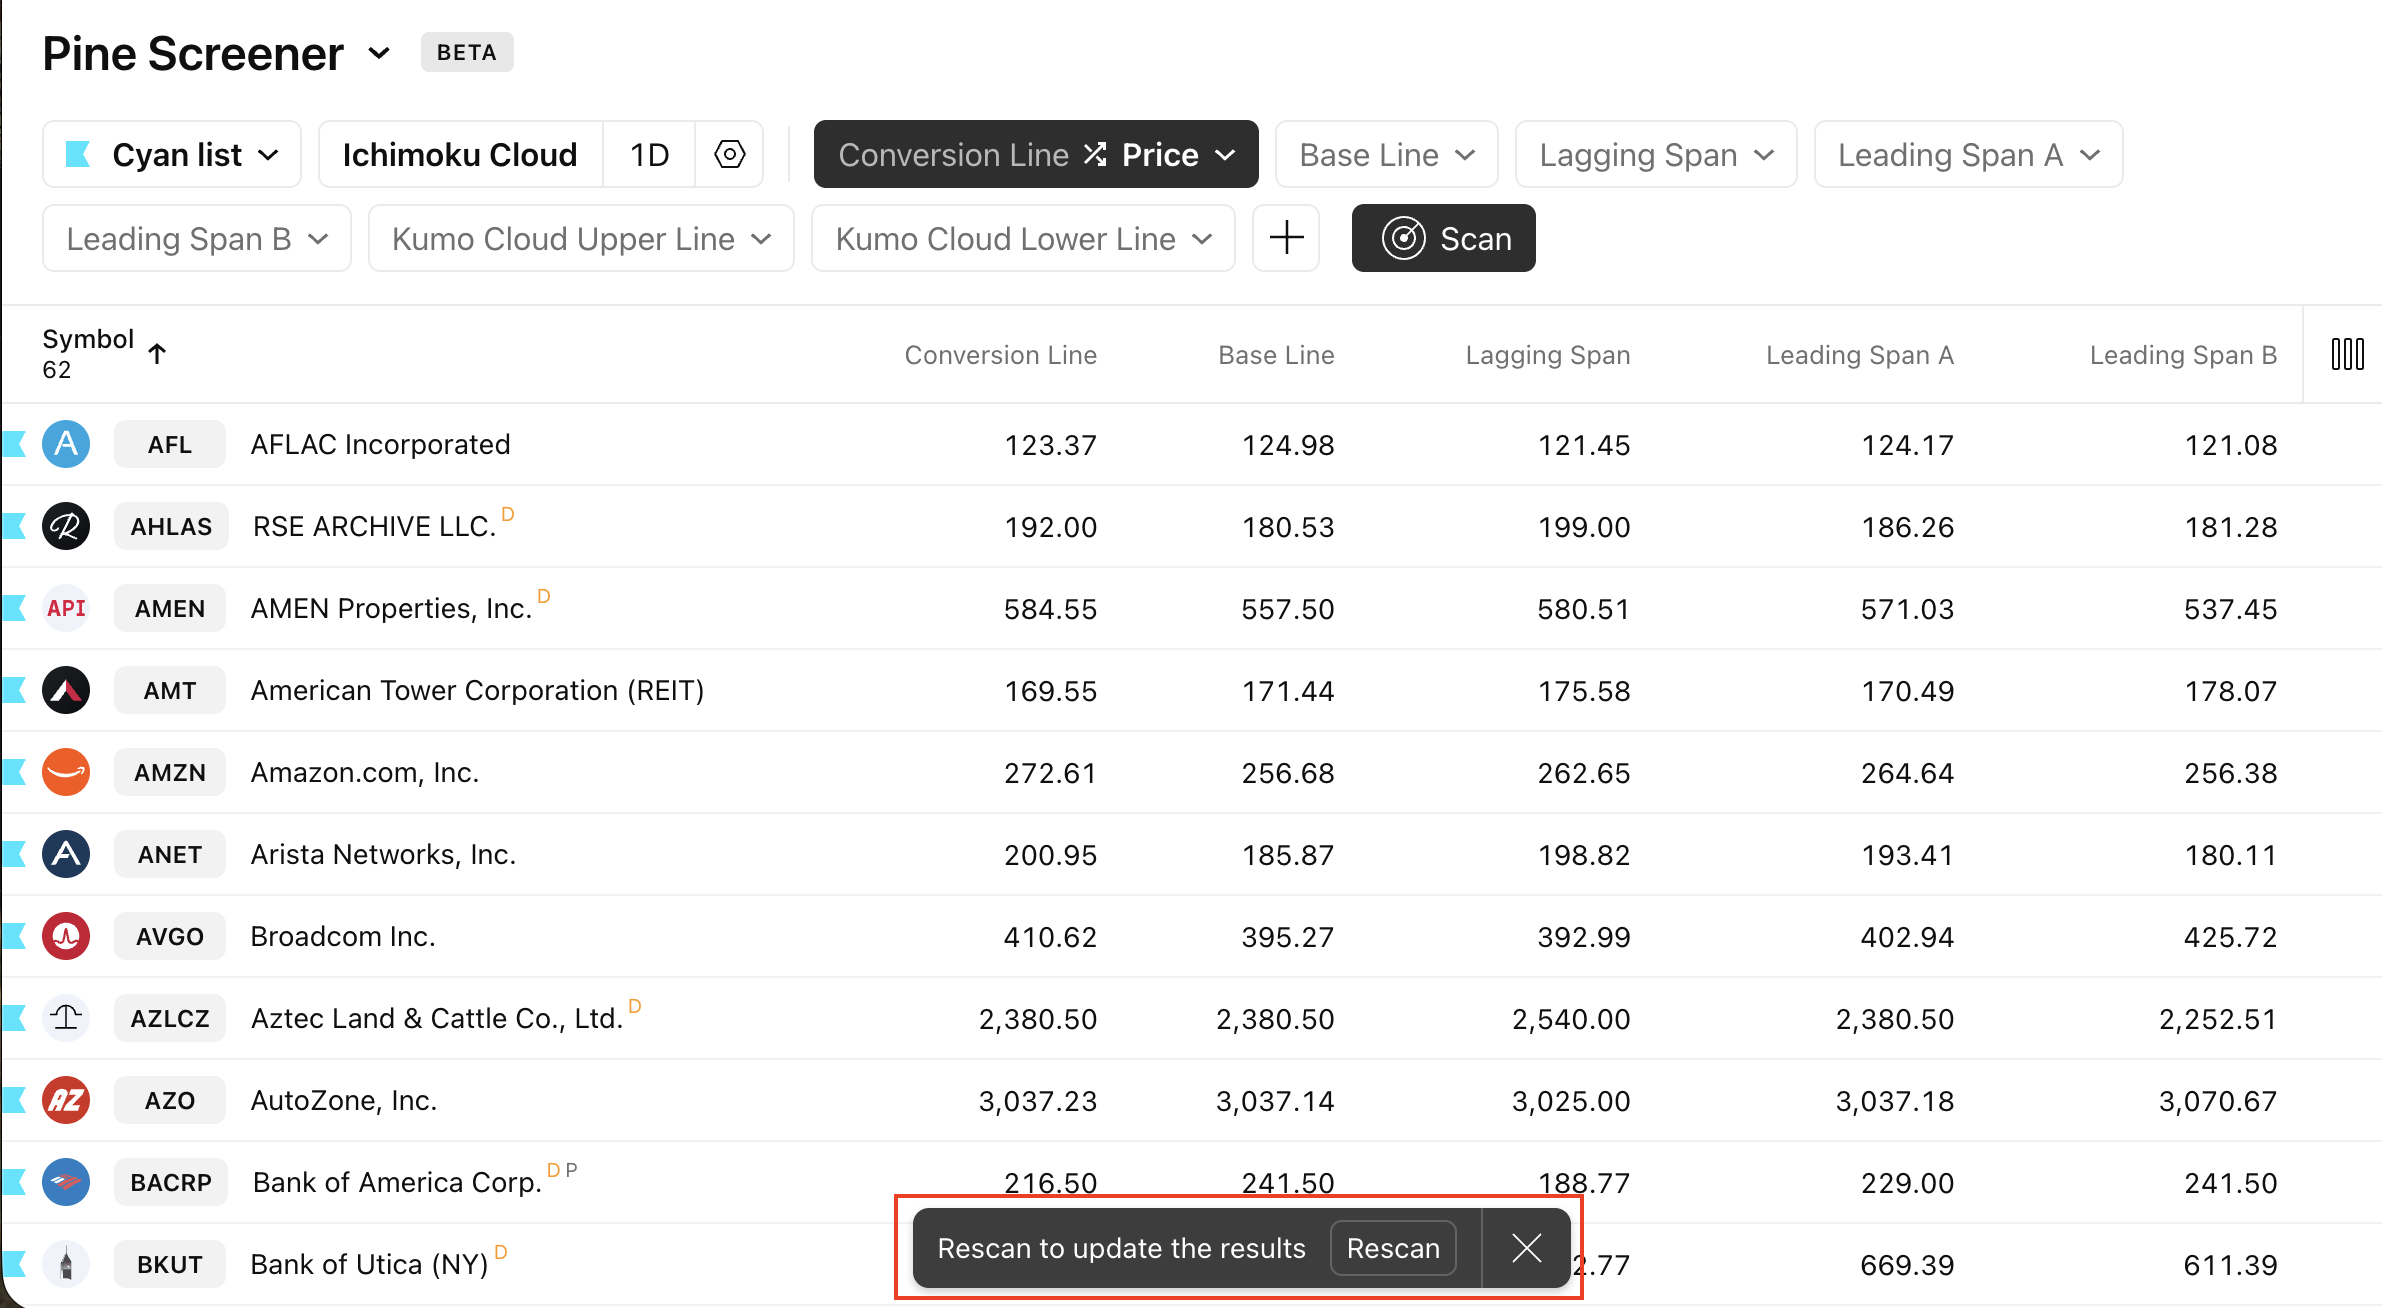
You will need to restart the scan if you modify any of the following parameters after a previous run:
- Source
- Studies
- Current study inputs
- Study timeframe
- Filter set
When a message appears indicating that a rescan is required, click the Rescan button in the pop-up notification to restart your scan successfully.
Pine Screener requirements
- You can use only one indicator per screen.
- To be used as a screening filter, the indicator must output at least one supported plot (e.g., plot(), plotbar(), plotcandle(), plotchar(), plotshape(), plotarrow(), or hline()) or an alertcondition().
- Only the plots of the selected indicator can be used as table columns.
- Indices are supported as a source up to a maximum of 4,000 symbols.
- The Indicator-on-Indicator feature is not supported.
- Custom timeframes are not supported. The supported timeframes include: minutes (1, 5, 15, 30), hours (1, 2, 4), 1 day, 1 week, and 1 month.
- The Pine Screener supports all `request.*()` functions, with the following limitations:
- No more than five separate `request.*()` calls can be used inside of the scanned script.
- The requested timeframe must be in the list of the supported timeframes. Valid Pine string identifiers of these timeframes are: "1", "5", "15", "30", "60", "120", "240", "1D", "1W", and "1M".
- You can scan only one screen at a time: if a scan is already running in one browser tab, another tab cannot execute a concurrent scan.
- The Pine Screener supports most input.*() functions and allows you to adjust these values via the Settings dialog. The following functions are not supported: input.timeframe(), input.symbol(), input.time(). If a script uses these functions, the Pine Screener ignores user-selected values and uses the default script values instead.
- The indicator calculates data based on only the last 500 bars on the chart.
- Using custom alert conditions is not compatible with scripts written in Pine version 3 or earlier. Using scripts written in Pine v4 or higher is strongly recommended.
The bottom line
The Pine Screener is a comprehensive tool for filtering and organizing your symbols before conducting deeper analysis.
You can combine it with other TradingView technical and fundamental analysis tools, accessing them directly from Supercharts.
If you have custom indicators created with Pine Script, you can plug them directly into the screener to evaluate your favorite assets through the lens of your unique trading strategy.
Also read: