TradingView Yield Curves: navigate bond rates and charts
Yield Curves allow you to evaluate the returns of bonds across different maturities and uncover the best bond rates worldwide. Designed for fixed-income investors, day traders, and macroeconomic analysts, this tool brings together sovereign bond data into a single, interactive visualization.
CONTENTS:
- How bonds work
- Key bond dynamics
- What are TradingView Yield Curves
- Working with Yield Curves
- Other TradingView bond tools
How bonds work
Government bonds are debt securities issued by a sovereign state to finance public spending and fulfill financial obligations. When you buy a bond, you act as the lender, while the state acts as the borrower. Depending on government policy, bond maturities can range from as short as one month to as long as 95 years.
Government bonds are generally considered low-risk investments because sovereign issuers are far less likely to default than private corporations. Some bonds can only be purchased directly upon issuance, while others actively trade on the secondary market.
Most bondholders receive regular interest payments, known as coupons, which are typically distributed semiannually. When the bond reaches its maturity date, the issuer repays the full principal (the bond's par value).
Example (Coupon bond): An investor purchases a 10-year bond with a €1,000 par value and a 2.2% annual coupon rate. This generates €22 per year paid in two semiannual installments of €11, totaling €220 in interest over 10 years. At maturity, the government returns the original €1,000 par value, bringing total cash returned to €1,220.
Not all bonds pay periodic coupons. These are known as zero-coupon bonds. Short-term government securities (often with maturities under one year) are sold at a discount to their par value rather than paying recurring interest.
Example (Zero-coupon bond): A 1-year bond with a £100 par value is offered at a 2.52% discount. The investor buys it for £97.48 up front. When the bond matures one year later, the government pays out the full £100 face value, securing a £2.52 return.
Key bond dynamics
- Stock market correlation: Bond prices often move inversely to stocks. When stock prices rally, bond prices frequently decline as capital shifts into riskier assets.
- Interest rate dynamics: Existing bond prices fluctuate as new bonds are issued. If newly issued bonds offer higher coupon rates, the market value of older, lower-yielding bonds falls to remain competitive.
- Negative yields: During periods of economic turbulence or intense flight-to-safety, market demand can drive short-term yields below zero. For instance, in April 2025, Swiss short-term bond yields dipped into negative territory for the first time since 2022—meaning investors were willing to receive slightly less at maturity in exchange for guaranteed capital preservation.
What are TradingView Yield Curves
Bonds are issued regularly, some even weekly. Most bonds are liquid, meaning they can be traded on the secondary market. To understand the relationship between previously issued and new bonds, investors use Yield Curves — a visual tool that displays changes in bond yields on a single chart.
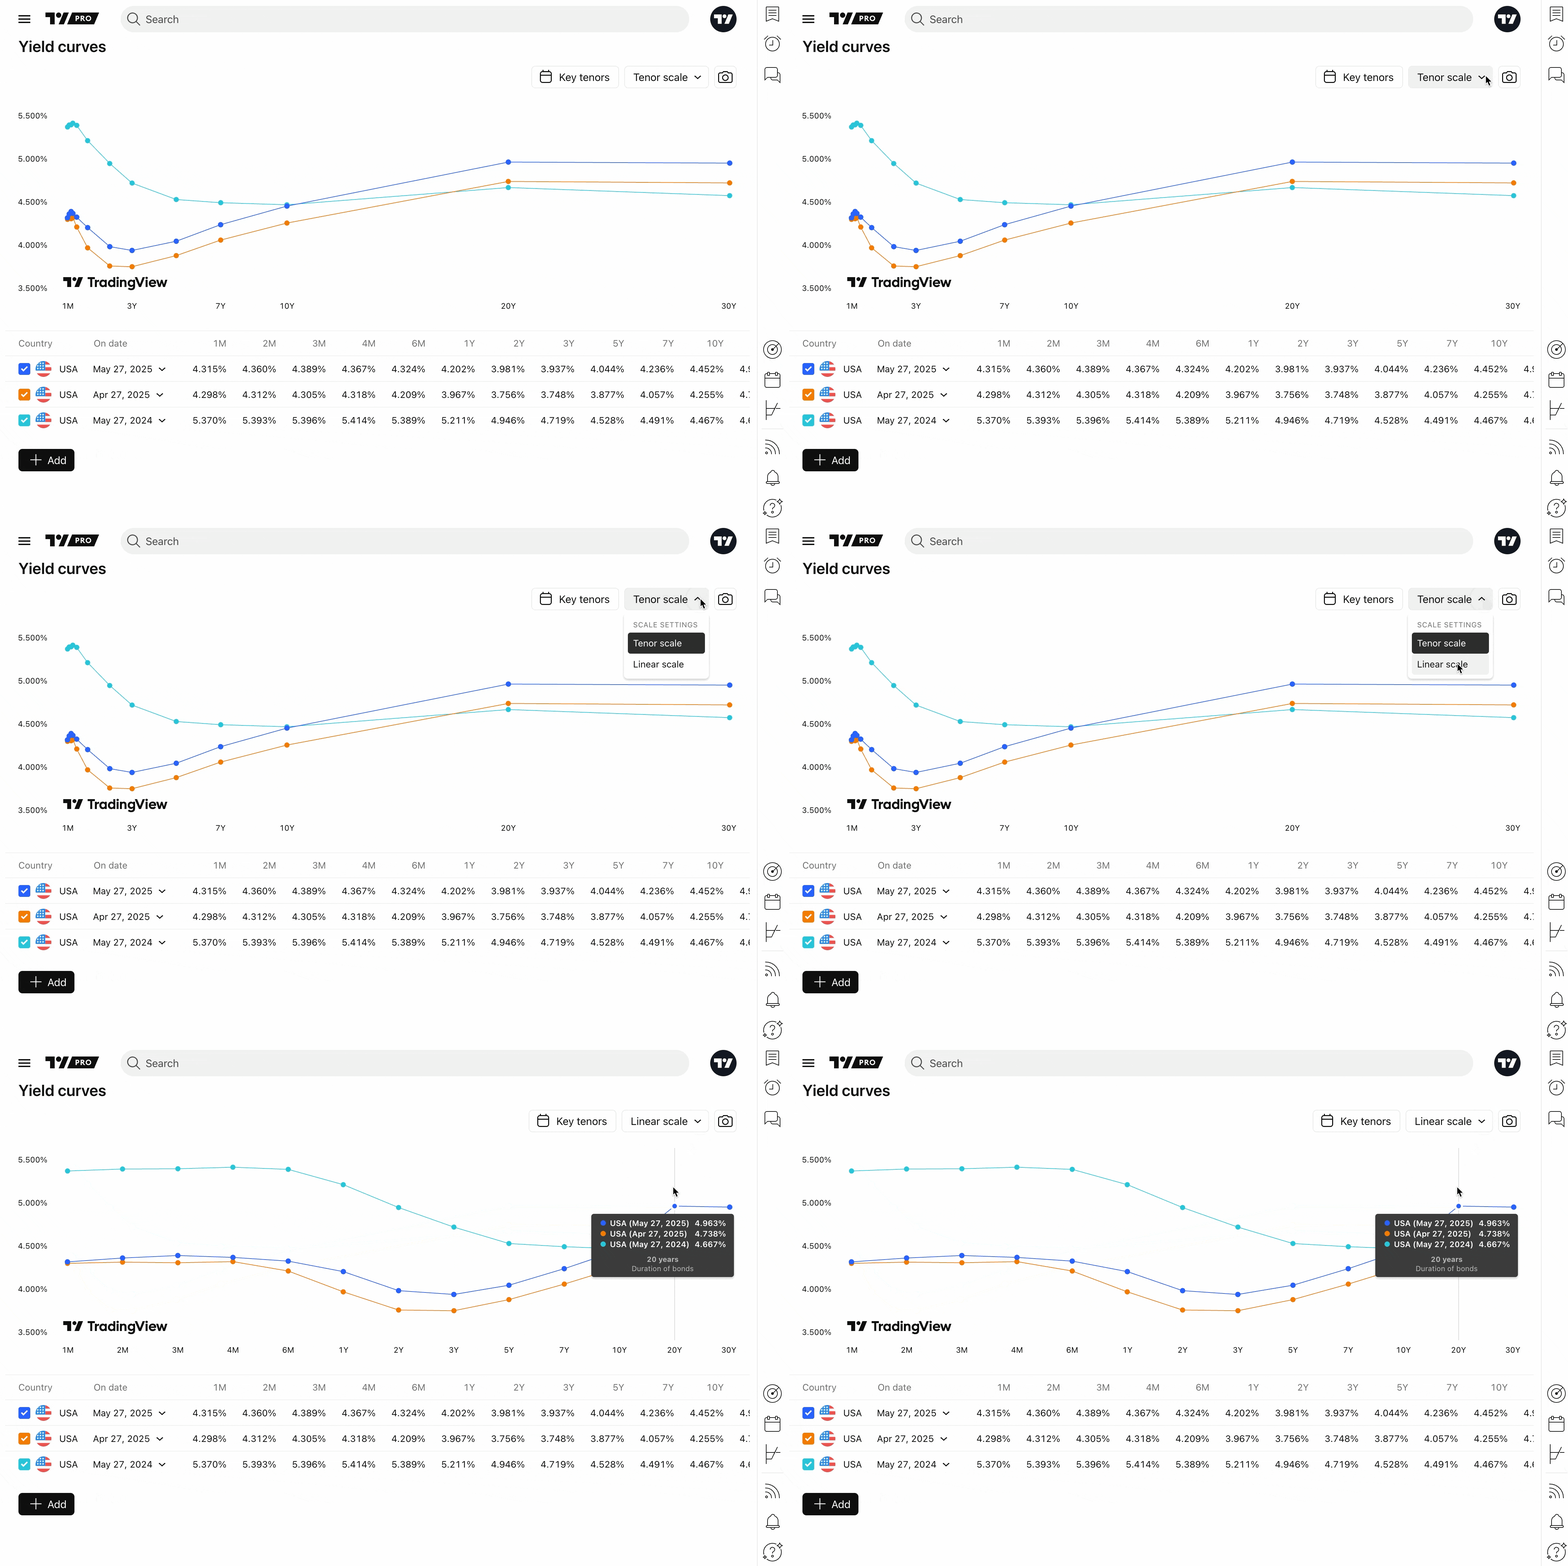
Yield Curves gather bond data and display it on two different scale types:
- Tenor scale: Used to represent bonds by their maturities and evaluate their risk exposure. Each point on this scale represents the duration of the bond and its yield. The spacing between maturity points reflects the level of uncertainty — the greater the spacing, the greater the risk
- Linear scale: Represents data in which unit changes, such as bond's yield and time to maturity, are displayed with equal spacing. While bond relationships are often nonlinear, a linear scale helps visualize approximate changes, compare values across different bonds, and determine overall trends
Key tenors
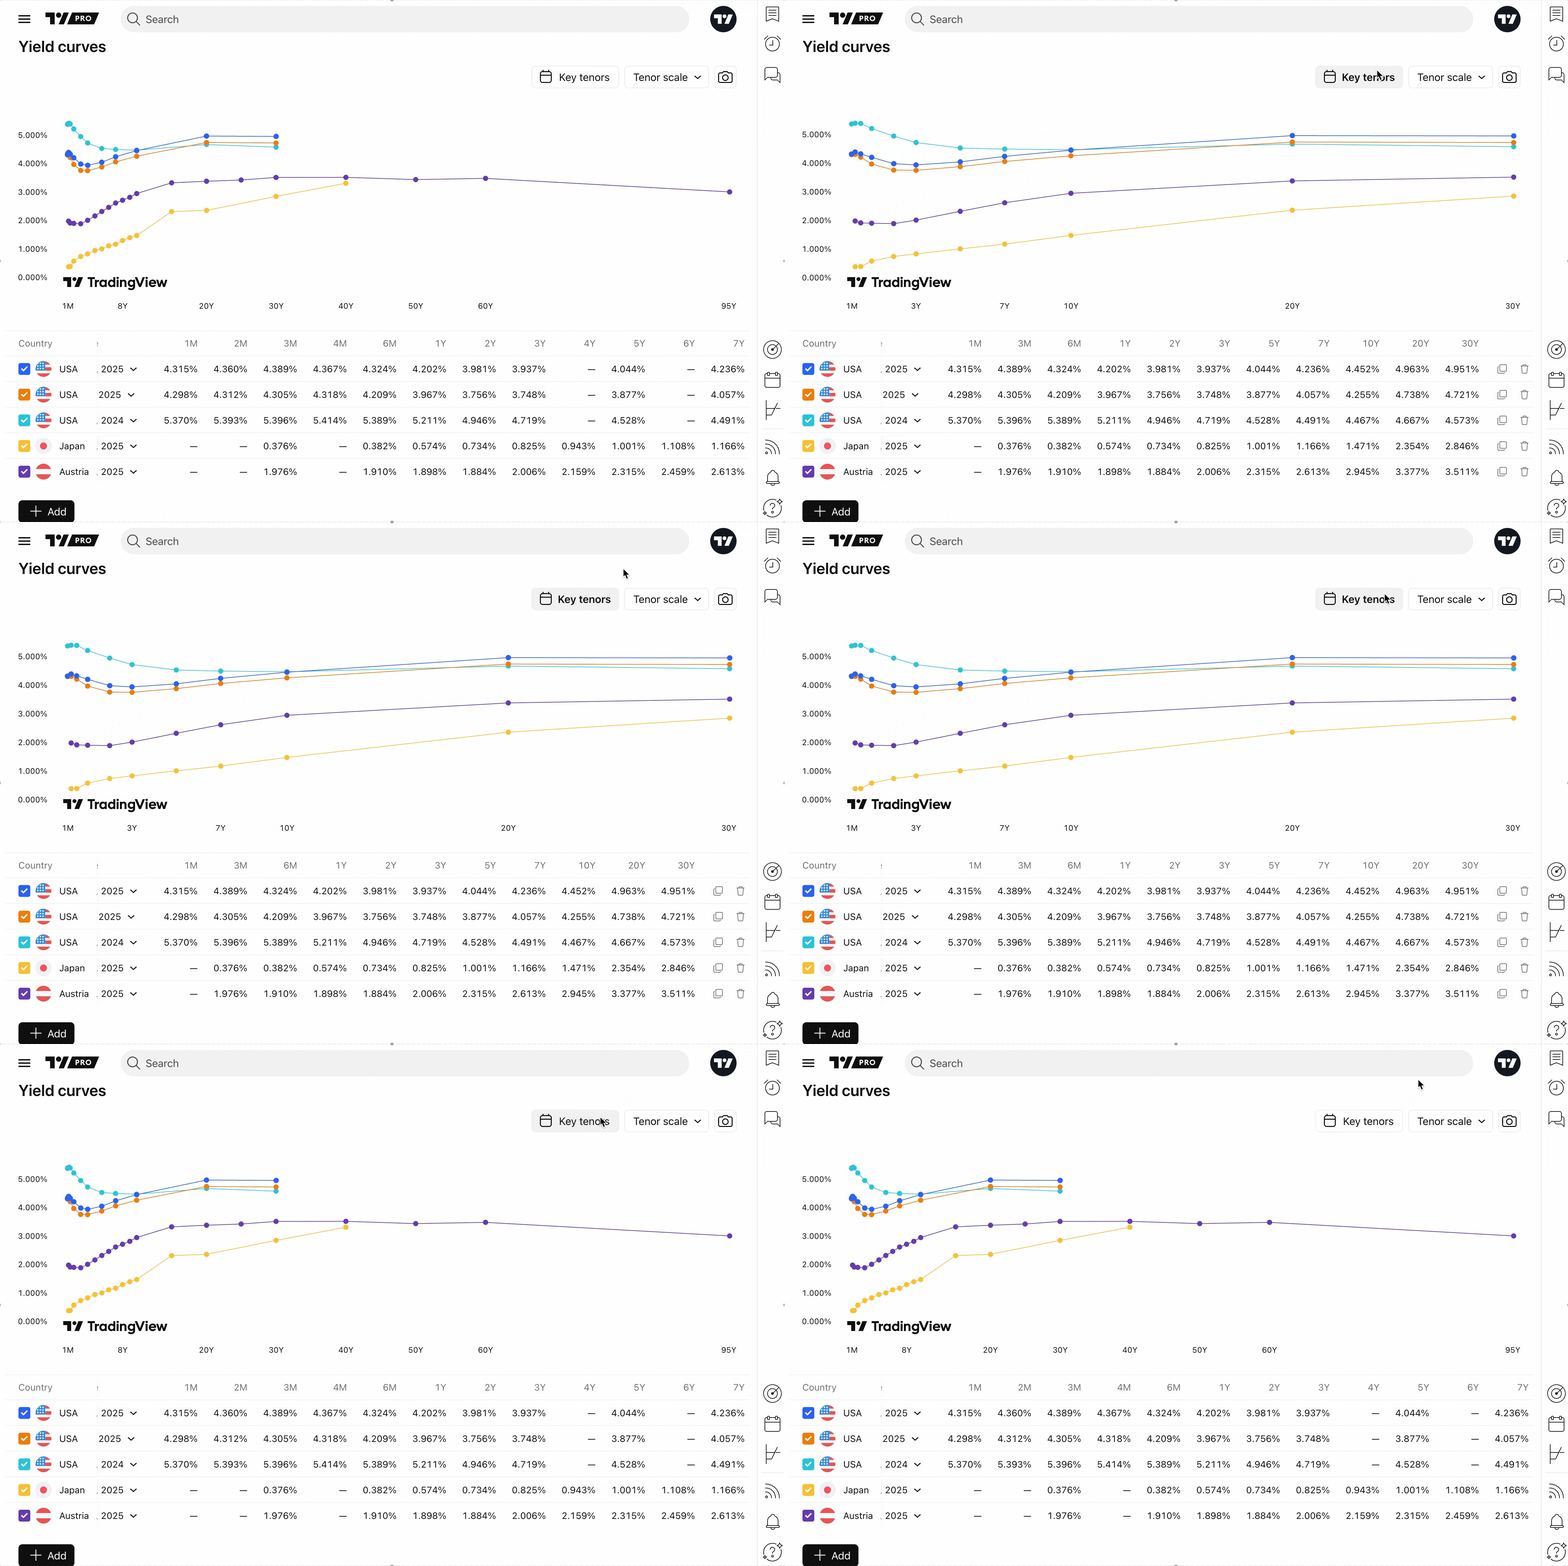
To simplify analysis, activate Key tenors on the toolbar to focus on the most liquid benchmarks actively monitored by institutional funds, central banks, and primary dealers:
- Months: 1M, 3M, 6M.
- Years: 1Y, 2Y, 3Y, 5Y, 7Y, 10Y, 20Y, 30Y.
Working with Yield Curves
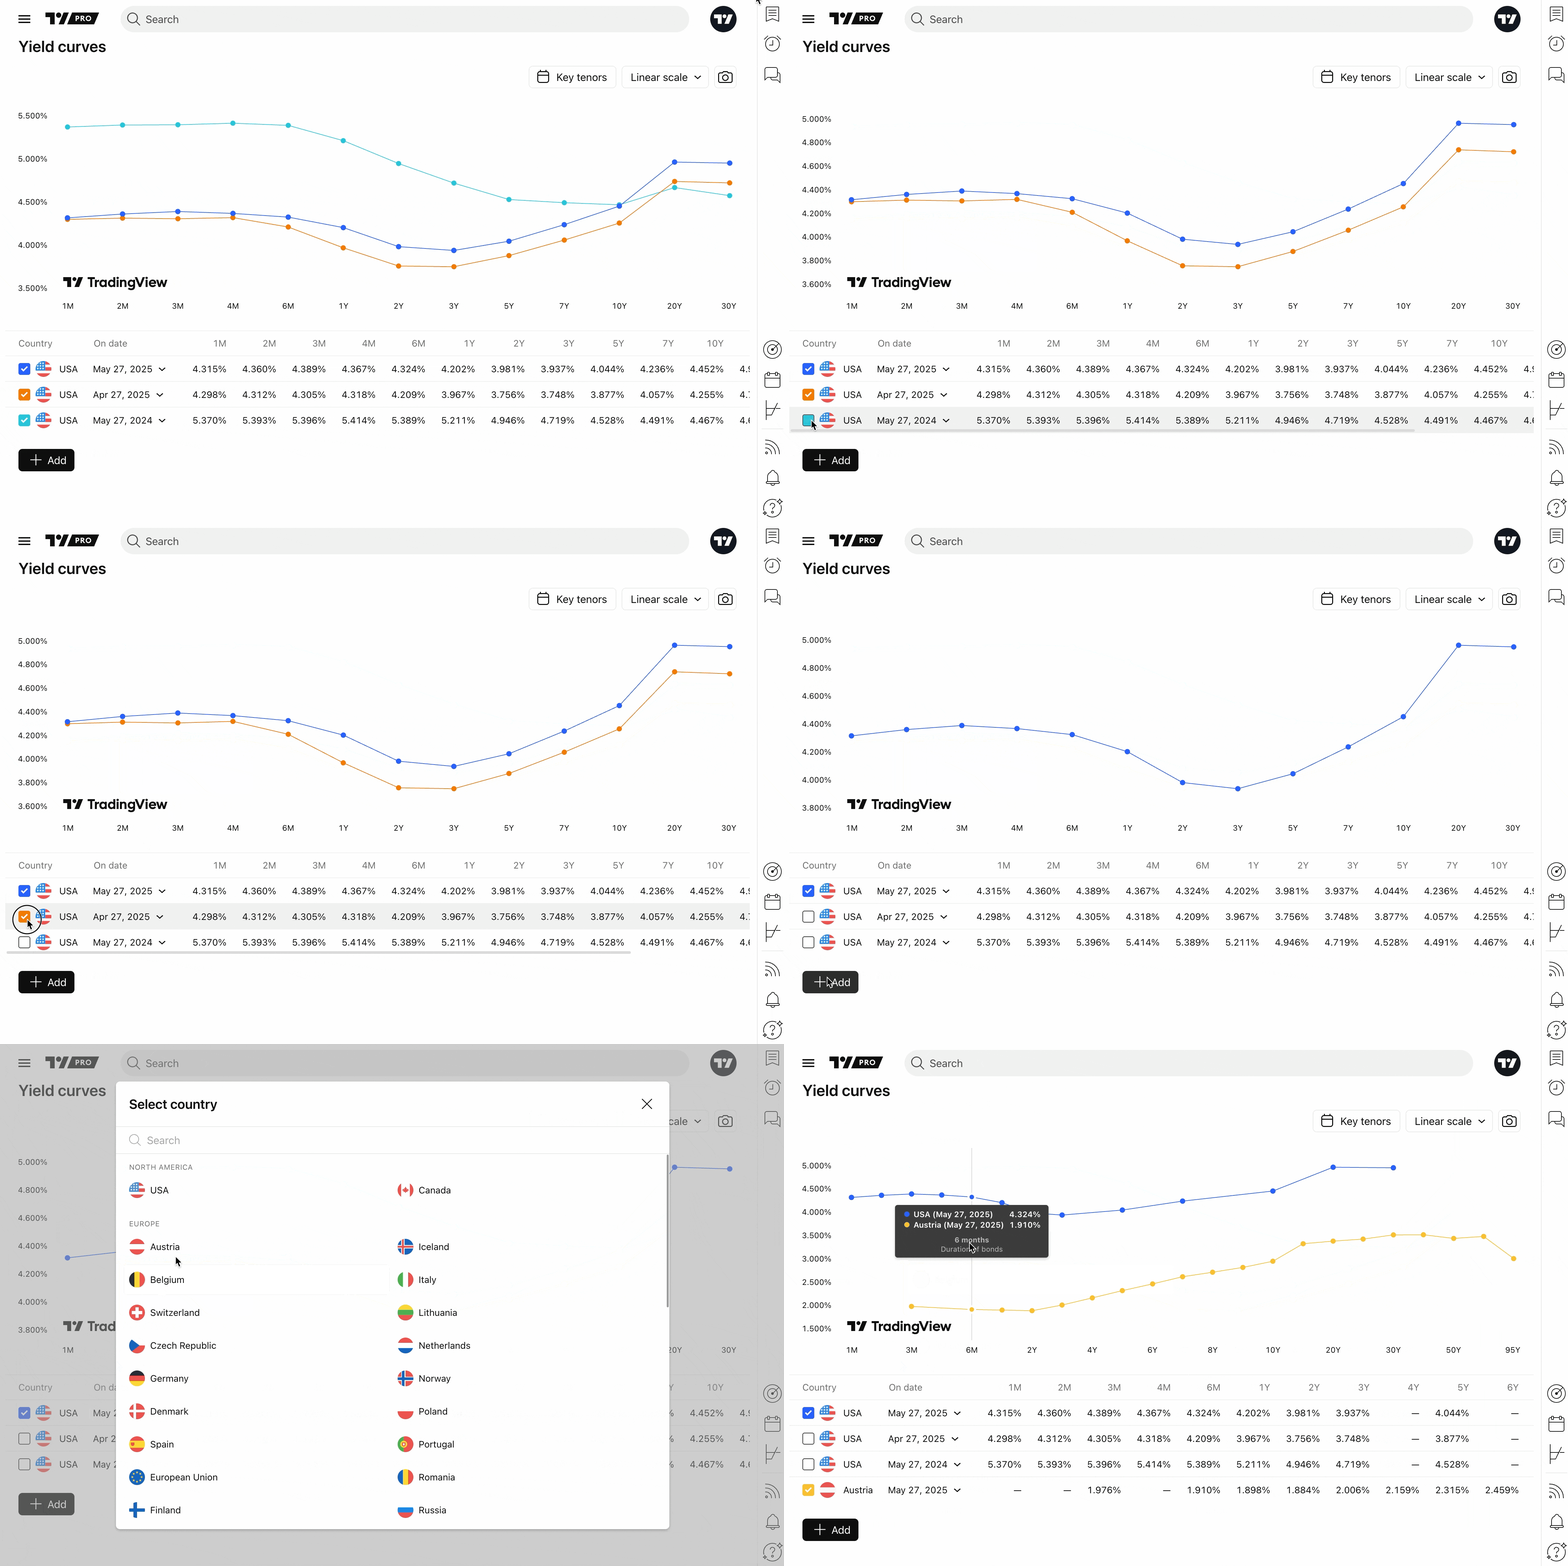
- Default view: Opening the tool loads US Treasury data by default, displaying three comparative curves representing yields today, one month ago, and one year ago.
- Data table: All curve points are reflected in structured rows and columns beneath the main chart. You can toggle specific curves on or off by selecting them in the list.
- Cross-country comparison: Click the + Add button to overlay yield curves from other sovereign issuers (e.g., comparing US Treasuries against German Bunds or UK Gilts).
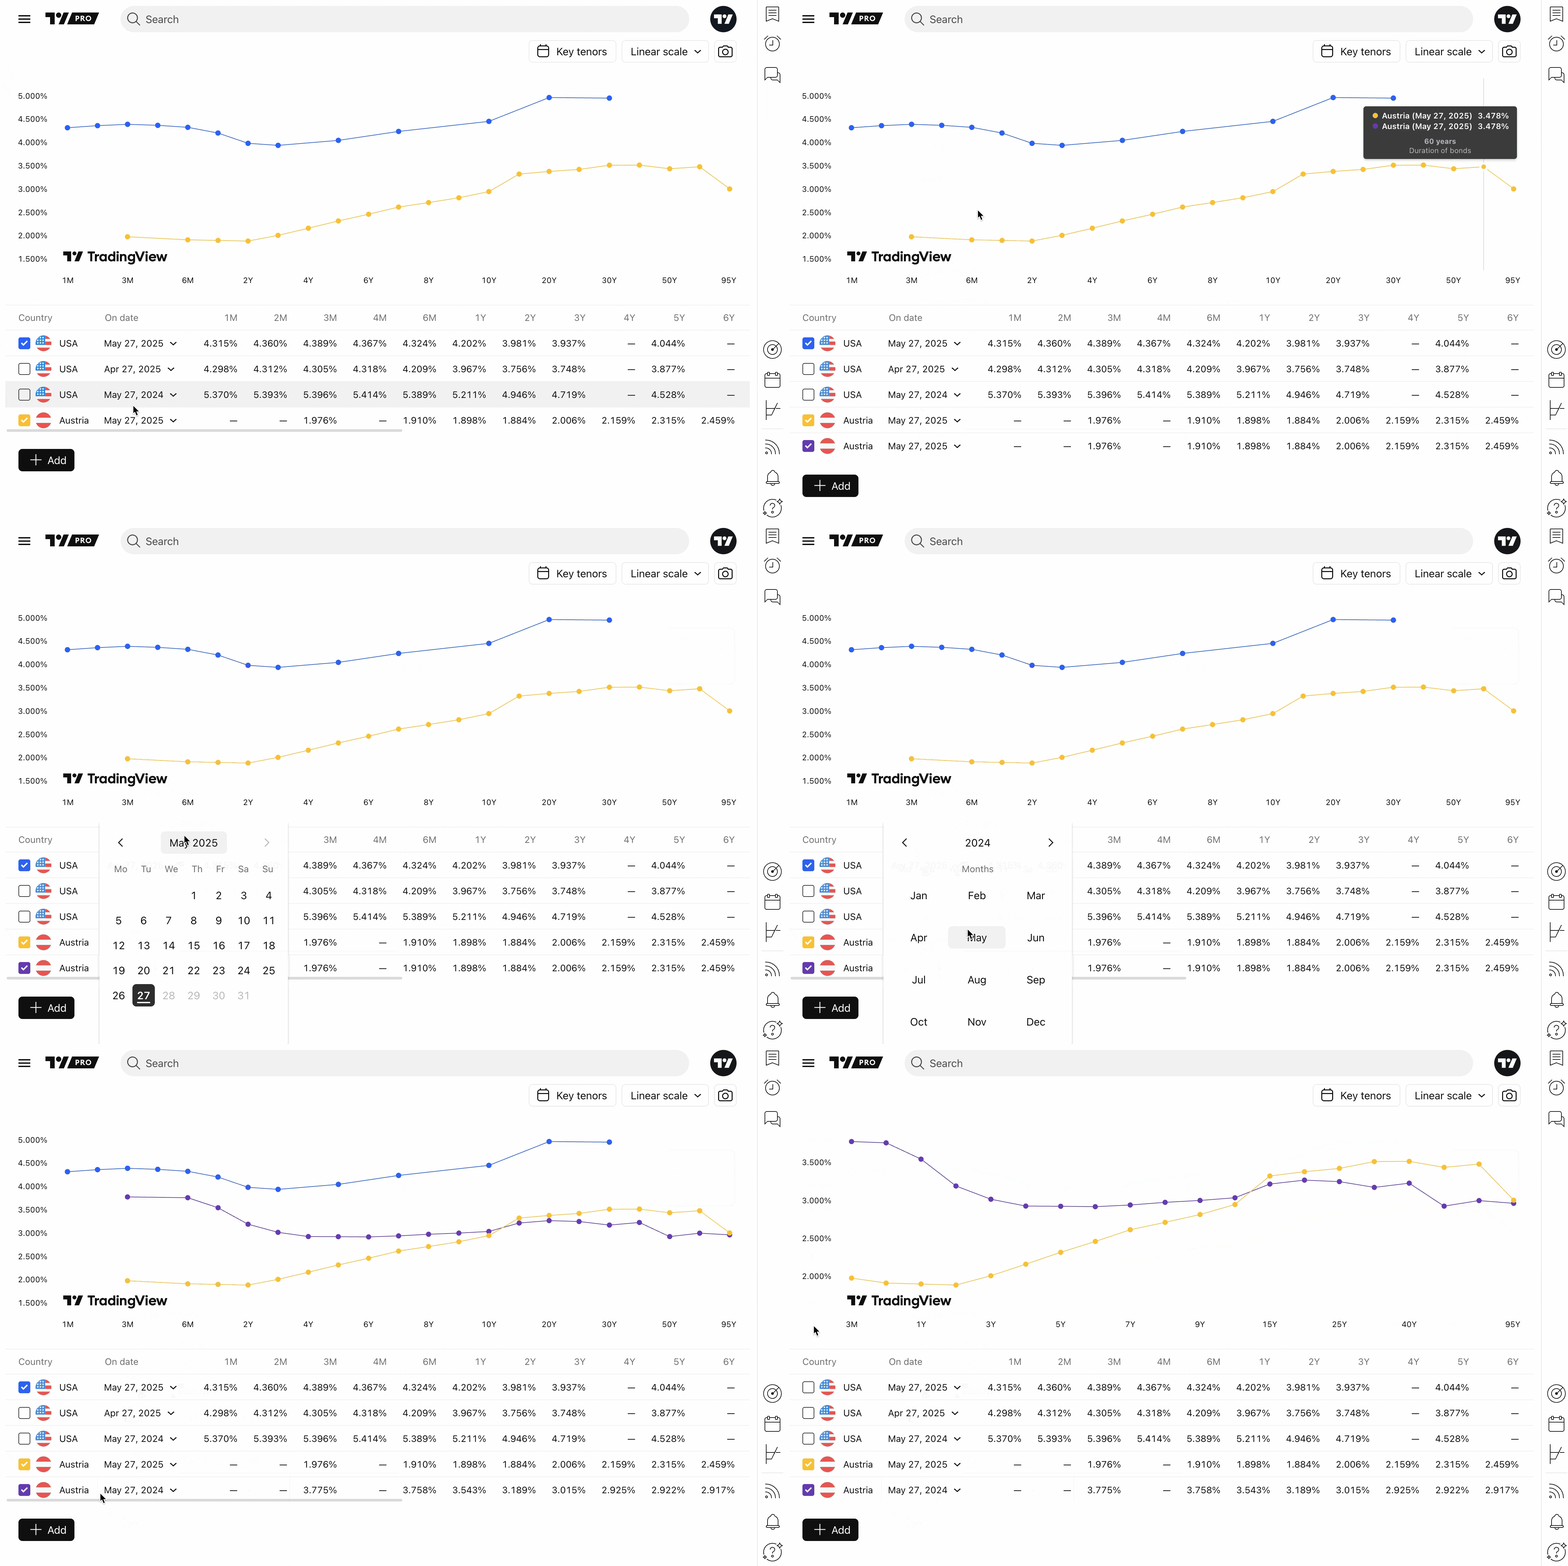
- Cloning and Historical Views: Click Clone next to any dataset to duplicate a curve and alter its historical date, allowing you to compare current yields against historical economic cycles.
- Sharing: Once your yield curve configuration is ready, click Take a snapshot to download or share your chart directly with trading peers.
Other TradingView bond tools
Bonds do not trade in isolation—they respond continuously to macroeconomic trends, central bank policies, and global capital flows. To build a thorough bond analysis workflow:
- Economic Calendar: Track central bank rate decisions (FOMC, ECB, BOE), inflation reports (CPI, PPI), and employment data to anticipate yield movements.
- Bond Screener: Filter corporate and sovereign debt by credit rating, yield-to-maturity, issuer, and coupon type.
- Bond Heatmap: Gain an instant, color-coded visual overview of yield changes across global debt markets.
- Bond trading ideas: Explore community analysis in the Minds section to see how other traders are positioning along the yield curve.
The bottom line
Government bonds provide essential portfolio stability and fixed income, while also serving as global economic barometers. Because bond values fluctuate as new auctions take place and interest rate expectations shift, tracking the shape of the yield curve is critical for both bond traders and equity investors.
By combining TradingView Yield Curves with Supercharts, fundamental calendars, and screeners, you can spot macro trends early, evaluate real yield opportunities, and execute well-informed strategies across global markets.
Also read: