AAVE/USDT - Price is rapped inside a trianglePrice is trapped inside a triangle, but the shorts are louder
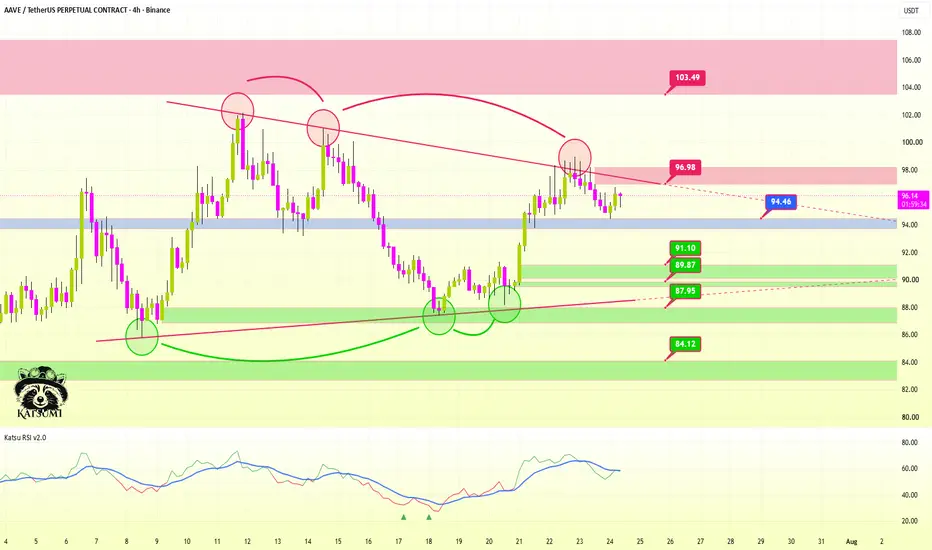
Katsu on the Bridge. The AAVE stealth ship is visible on the central radar. On the AAVE 4H chart, we are seeing a very interesting, but also quite tricky structure. This is not a clean trend. It is a narrowing structure where price is trying to make a decision inside an increasingly smaller space. On the chart, we can see lower highs and higher lows. If we connect them, a triangle-like pattern appears.
By itself, this is a neutral pattern.
- It does not say that we will definitely go up.
- It also does not say that we will definitely break down.
The triangle only says that a decision is coming, or at least that a decision is needed. When a triangle keeps tightening for a long time, faster movement often follows in one direction.
What Do I See on the Chart?
There are multiple rejections from the upper trendline. Price has tried to move higher several times, but each time selling pressure appeared. This is very important to me. Around the red circles on the chart, we can clearly see that the market rejected the move again and again near the upper trendline. At the same time, buyers also appeared near the green circles below, so it is not like AAVE is completely dead. Buyers and sellers are both defending certain zones.
However, near the upper resistance areas, the bearish reactions have looked stronger so far. The blue candles also show that the short side appeared with more strength several times.
This does not mean that we will definitely break down, but it does mean that I would not try to play hero with longs near the upper trendline.
Important Zones
Bearish Order Blocks / Resistance
96.98 - This is the nearby red 1H bearish Order Block. Compared to the current price, this is the first more serious resistance zone. If price moves back into this area but cannot break through and hold it, another rejection could easily come from here.
103.49 - This is a higher and stronger bearish zone. If AAVE reaches this area, I think many traders would become bullish again. That is exactly why it can be dangerous. This zone may be suitable for collecting late longs, and if there is no real strength, price could then reverse from there.
Supports / Bullish Order Blocks
94.46 - This is the blue zone. I would not call it an extremely strong support, but I would definitely watch it. Right now, this is one of the most important short-term decision points. If price loses this level, it can easily start moving lower, because the market may collect the stop losses of late longs sitting around the FVG. And if those stop losses get triggered, the move can accelerate.
91.10 - 89.87 - This is the nearby green 1H bullish Order Block zone. If the blue support fails, I think this could be the first more serious target to the downside. Here I would already watch for buyer reaction, because this zone could be suitable for a bounce.
87.95 - This is a deeper green reaction area, close to the lower trendline of the triangle. If price drifts down this far, it will become much more important to see whether buyers can actually defend the structure.
84.12 - This is a deeper bullish Order Block / defensive zone. If this area comes into play, it would likely mean that the lower side of the triangle has been damaged, and the market has started pricing in a larger bearish move.
What the Triangle Means The triangle is important because both sides have arguments.
On the bullish side:
we have higher lows
buyers defended the lower zones several times
price has not broken down from the structure yet
the zone around 94.46 is still holding
On the bearish side:
we see lower highs
there have been multiple rejections from the upper trendline
we are still below the red 1H Order Blocks
bearish reactions have looked stronger so far
losing the blue support could accelerate the move lower
So for me, the current picture is neutral with a slightly bearish tone. Not because it has already broken down. But because so far, the upper side has produced more rejection than strong breakout.
Volume and RSI
Based on volume, I do not see clean buying strength that would make me blindly bullish. There were buyer reactions, but selling pressure is more visible near the upper zones.
The RSI is around the middle range, near 57. It is slightly bullish, but there is no extreme overbought or oversold condition. This also shows that the market has not decided yet.
There is movement. there is reaction, but there is no clear trend command. In this kind of situation, the biggest mistake is to project onto the chart what we want to see.
The market has not declared the direction yet.
It is only preparing for it.
The Battle Plan
For me, there are now two important decision points. One is above, around the red OB near 96.98. The other is below, around the blue support near 94.46.
If price moves back toward 96.98 but gets rejected again, then a downside attempt becomes more likely. But if price reclaims the 96.98 zone and can hold above it on the 4H timeframe, then the short-side picture weakens, and a move toward 103.49 may come.
To the downside, losing 94.46 would be the important signal. If price closes clearly below it, it may easily trigger the stop losses of late longs, and the move could slide toward 91.10 - 89.87.
Long Battle Plan - From Bullish OB Defense
On the long side, I would not try to play hero at the top of the triangle. The better long can come either from the blue support holding or from a deeper green OB.
Long Setup 1 - After Holding 94.46
This is the more aggressive long plan. It comes into play if AAVE holds the blue zone around 94.46 and gives a bullish reaction on the lower timeframe.
What I want to see:
price wicks into or retests the area around 94.46
it does not close strongly below it
a rejection candle appears
bullish ChoCh forms on the lower timeframe
after the retest, the zone holds as support
In simple terms: blue support -> sweep -> bullish reaction -> ChoCh -> retest -> long
Possible Long Plan
Entry: 94.50 - 95.20, after confirmation
Stop Loss: below 93.80
TP1: 96.98
TP2: 100.00 - 101.00
TP3: 103.49
This is a more aggressive long because we are directly inside the triangle. Here it is not enough that price simply touches the blue zone. We need a reaction.
Long Setup 2 - From the Deeper Green OB
This would be the cleaner smart money long for me. If 94.46 fails, I would not immediately look for a long. I would rather wait to see whether price moves down to the next green Order Block zone.
The area I am watching: 91.10 - 89.87
What I would look for:
price slowly drifts or wicks into the 91.10 - 89.87 zone
local liquidity gets swept
a strong rejection candle appears
bullish ChoCh forms on the lower timeframe
price holds the zone after the retest
In simple terms: bullish OB -> sweep -> bullish reaction -> ChoCh -> retest -> long
Possible Long Plan
Entry: 91.10 - 89.90, after confirmation
Stop Loss: below 87.80
TP1: 94.46
TP2: 96.98
TP3: 100.00 - 103.49
This would be the better long for me, because by then the market would have already shaken out the weaker longs.
Short Battle Plan - From Bearish OB Rejection
On the short side, the nearby red OB around 96.98 is the most important level right now. This is the zone where selling pressure has appeared several times already, and where the upper trendline is also putting pressure on price.
Short Setup 1 - 96.98 OB Rejection
I would look for a short if price moves back toward the 96.98 zone but starts weakening there.
What I want to see:
price bounces into the 96.50 - 97.20 area
momentum slows down there
a rejection wick appears
bearish ChoCh forms on the lower timeframe
price falls back below 94.46
it fails to reclaim it on the retest
In simple terms: bearish OB -> wick up -> rejection -> bearish ChoCh -> short
Possible Short Plan
Entry: 96.50 - 97.20, after confirmation
Stop Loss: above 98.20
TP1: 94.46
TP2: 91.10 - 89.87
TP3: 87.95
This short looks good if price only retests the red OB, collects late longs, and then falls back below it. But if AAVE closes steadily above 97 on the 4H timeframe and holds the retest, this short idea is dead.
Short Setup 2 - After Losing the Blue Support
This is the momentum short version. It comes into play if price does not even move up to 96.98, but simply loses the blue support around 94.46. In that case, the market can easily collect the stop losses of late longs sitting around the FVG, and the move may accelerate lower.
What I would look for:
4H close below 94.46
retest from below
previous support turns into resistance
bearish continuation on the lower timeframe
rising volume during the drop
In simple terms: support loss -> retest -> rejection -> short
Possible Short Plan
Entry: 94.20 - 94.60, after a failed reclaim
Stop Loss: above 95.50
TP1: 91.10
TP2: 89.87
TP3: 87.95
This setup is interesting because if the support fails, we do not only get a technical breakdown. We may also get stop-loss acceleration. And that can get ugly.
What Am I Watching Closely Now?
Does the blue zone around 94.46 hold price, or do they let it go? If it holds, another attempt toward 96.98 may come. If 96.98 gets reclaimed, the upper triangle trendline may be damaged, and a stronger upside move toward 100 - 103.49 could follow.
But if 94.46 fails, the short scenario can activate quickly, and price may slide toward 91.10 - 89.87.
This is not financial advice. The raccoon was simply thinking out loud about JUP today.
I wrote down what I see, what I think, and how I would trade it.
Then either I am right... or we learn from it. :))
IMPORTANT!
The entry prices and stop-loss levels are not set in stone. These are my own plans, and I share them only to teach the thinking process behind the setup. Never enter a trade blindly just because someone said so. Check it, verify it, and make your own decision. This is exactly how I explain it to my students as well, because this way the logic is easier to follow, and it becomes clearer what I actually mean when I talk about Order Blocks.
In-depth trading ideas
AAVEUSDT 15JULAAVE has remained one of the strongest DeFi projects, consistently ranking among the top protocols in its sector for several years. Today, let’s take a technical look at its chart.
At the time of this analysis, AAVE is trading around $97. From a technical perspective, price appears to be approaching a significant liquidity zone between $105 and $131. This area has previously acted as an important trading range, making it a level worth monitoring for potential volatility.
Before reaching this zone, the market may still face selling pressure and short-term resistance. However, if price successfully enters the highlighted range, increasing momentum and higher volatility could follow as liquidity is absorbed.
As always, this scenario depends on future price action and confirmation from the market. Risk management remains essential, and traders should wait for confirmation before making any trading decisions.
Follow for future updates as this setup develops.
$AAVE Technical AnalysisAAVE is consolidating around a major volume area after breaking its broader descending trendline. The current pullback looks more like a retracement from the recent impulsive move than a complete loss of structure.
The larger rounded base remains constructive and continues to suggest a possible accumulation phase. However, price is still trading beneath a major resistance and high-volume region, so stronger confirmation is needed before the structure can fully shift bullish.
The Synergy Signal oscillator has reset into oversold territory while price remains well above the previous swing low. Momentum has cooled significantly without an equal breakdown in market structure, creating conditions for a possible reversal if buyers return.
For now, AAVE remains in a key consolidation phase. A breakout above resistance with rising volume would strengthen the rounded-bottom thesis, while a loss of the current support structure would weaken it.
AAVE Rejection: Is the Next Move Lower…!Yello Paradisers! Are you prepared for a potential sharp downside move on #AAVE, or are you still calling this “just a healthy pullback” while smart money quietly distributes above you? At first glance, the structure may look harmless. But when we remove emotions and read the chart objectively, the story changes completely. This is not a random retracement. This is a high-risk zone where discipline matters more than opinions.
💎#AAVE has clearly respected the descending resistance trend-line and failed to break above it. This rejection is a key probability of ongoing structural weakness. At the same time, Overall structure is bearish and price mitigate the order block zone of daily time frame during the retracement.
💎As long as price holds momentum within the supply zone the probability favours continuation lower. The immediate minor support sits around 78.25, which now acts as the first downside magnet if selling pressure persists.
💎From Volume Spread Analysis perspective, the sequence is even more revealing. We saw a buying climax followed by a climactic action bar. This combination typically shows distribution. In simple terms, institutions use these aggressive spikes to offload positions into retail enthusiasm. When the crowd feels confident, smart money distributes quietly.
💎#AAVE swept the upper trigger line of the buying climax but failed to sustain higher levels, followed by a candle breaking below the lower trigger line. This is a classic confirmation that supply is dominating. If bearish momentum continues, the next probability of major downside target sits around 70.25 and it could be reached sooner than most expect.
💎If #AAVE manages to break above the key resistance at 104.70 with a strong momentum candle, this whole bearish probability would be invalidated, and we could instead see a bullish continuation. As always, we let price confirm our bias.
Discipline is key, Paradisers! The charts may look volatile, but this is where professionals thrive and amateurs panic. Don’t let emotions guide your trades. Wait for clear confirmation and manage risk like a pro. Strive for consistency, not quick profits. Treat the market as a businessman, not as a gambler.
MyCryptoParadise
iFeel the success🌴
AAVE: Long-Term Downtrend Meets Medium-Term RecoveryLong-Term Trend Still Bearish
Despite the recent recovery, AAVE continues to produce a series of lower highs and lower lows on the higher timeframe. Bulls need a break above $118.87 to signal a genuine change of character, with $131.98 becoming the next major resistance beyond that.
Medium-Term Recovery Intact
Since bottoming around $57.83, AAVE has established a sequence of higher highs and higher lows. As long as the $82.70 support continues to hold, the medium-term recovery remains intact despite the larger bearish trend.
Resistance Continues to Cap Price
The $102-$103 resistance zone has once again attracted sellers, preventing the latest rally from extending further. While the 100/50-day EMAs remain bearishly crossed, both averages are beginning to flatten, hinting that downside momentum is fading.
Momentum & Volume Diverge
RSI remains above 50, suggesting buyers still retain a slight momentum advantage. However, volume has gradually declined as price has approached resistance, implying that bullish conviction is weakening into this key supply zone.
In Summary
AAVE remains caught between a long-term bearish trend and a medium-term recovery. The higher low structure continues to favour the bulls while above $82.70, but repeated rejection around $102-$103 and declining volume suggest caution. A break above $118.87 would mark the first meaningful shift in the long-term trend, while losing $82.70 would weaken the current recovery.
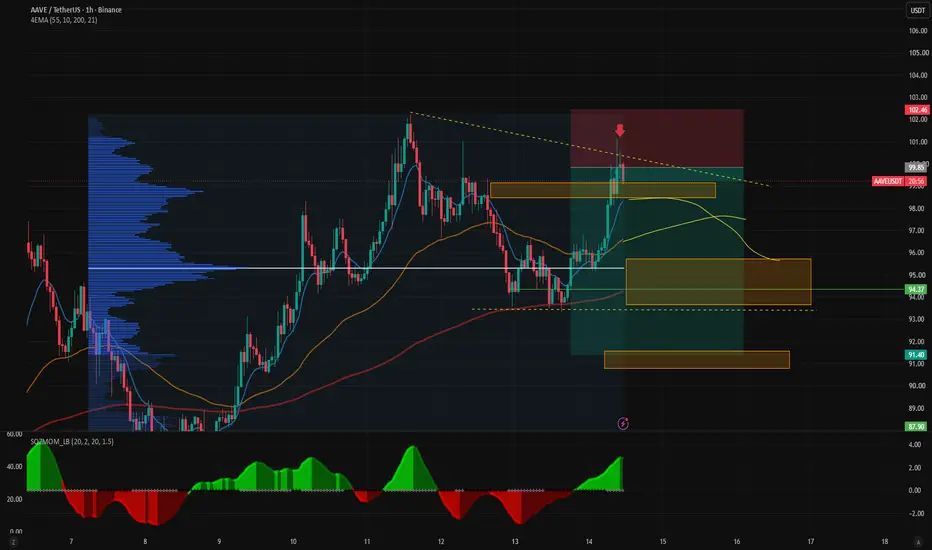
Short - AAVE a 91.5
📉 AAVE Trade Idea – Potential Short Setup
Asset: AAVE
Timeframe: 1-Hour Chart (1H)
Bearish Target: 91.50
AAVE is currently approaching a key Volume Profile Value Area, a region where price is historically attracted due to high trading activity. Price has attempted several bullish breakouts, but buyers have been unable to maintain momentum above this resistance zone.
📊 Technical Analysis
Volume Profile: Price is testing a significant area of interest near the
Point of Control (POC), where selling pressure is beginning to emerge.
ADX (Average Directional Index): ADX is increasing, indicating that momentum
and trend strength are building for a directional move.
TTM Squeeze / Momentum Histogram: Momentum is shifting bearish, with the
histogram showing weakening buying pressure and increasing downside potential.
Moving Averages:
55-period Moving Average (Brown) continues to act as dynamic resistance.
Short-term price action is losing strength around the 10-period Moving Average (Blue).
🎯 Trade Scenario
Primary Profit Zone: 95.34, corresponding to the next major volume node.
Extended Bearish Target: If support fails and sellers take control,
the next downside objective is approximately 91.50.
⚠️ Risk Management
Wait for bearish confirmation before entering a short position.
Monitor volume and price reaction around key Volume Profile levels.
Consider placing a stop-loss above the most recent resistance area.
⏳ Expected Development
This setup may require approximately 8 to 10 hours to fully develop.
Patience and confirmation are recommended before executing any trade.
Disclaimer: This analysis is for educational purposes only and should not be considered financial advice. Always conduct your own research and apply proper risk management.
aaveusdt longInstructions:
Entry point: yellow
Stop loss: red
Take profit: green
👉Leverage x 5-10-20 for crypto
👉Leverage x 20-50-100 for commodities, stocks, indices, and forex
👉Margin 1-5% max.
Always practice risk and money management.
Invest a maximum of 5% on any trade or across all your trades.
Invest only what you can afford to lose, as no one is in control of the market.
👉Our analyses are primarily based on:
breakouts: two trend lines (ascending and descending) and a line indicating a horizontal breakout.
chart patterns: shoulders and head, triangle parttern, elliott impulse, etc etc.
We don't always have the time to track them at all times or to represent them visibly, given the numerous signals, the number of channels to manage, and especially because of the often rapid pace of market movements.
indicators: We associate at least two indicators with this technique.
👉Depending on the circumstances, we use specific indicators, often setting 3 or more take profit levels.
👉Indeed, there are good days in trading and also bad days. No one can promise to win every trade, and like all traders worldwide, we also experience stop-loss orders. However, we win more than we lose and remain positive.
👉You can close the position before or after the take profit orders indicated by the green lines if you are personally satisfied; the same applies to stop loss orders.
👉We must stay positive, clear-headed, and humble.
we cannot provide all instructions or all trades here on this channel.
Good luck to us all, and may God guide us. Amen.
AAVE: local squeeze with $117.18 destinationThe Macro Picture 🗺️
AAVE staged a sharp V-recovery off the $57.73 macro floor all the way back to $97.24 and is now coiling just under its local high. The trend has flipped from the June flush to a steady reclaim — buyers in control and pressing the range top.
The Setup ⚙️
The Range Floor 🟢
$91.85 (Local Low) is the near demand shelf holding the recovery, with $57.73 (Macro Support) as the deeper structural base. As long as $91.85 holds on pullbacks, the bid stays intact.
The Decision Point 🔴
$103.45 (Local High) is the gate. A daily close above it clears the last local resistance and opens the path toward the $117.18 measured-move target near the macro ceiling.
The Roadmap 🛣️
Hold above $91.85 → break $103.45 → run toward $117.18. Invalidation is a clean daily close below $91.85 — that stalls the recovery.
This is a GRID Range Play: a defined band to rotate, buying pullbacks toward the floor and scaling out into the breakout.
More setups in profile.
#AAVE #crypto #trading #TA #3Commas #GRID
AAVE USDT SHORT SIGNAL#31. AAVE/USDT – Trade Setup (SHORT)
📈 Position Type: SHORT
🕒 Timeframe: 1 H
📊 Market: Futures
💰 Entry Zone:
87.65
🛑 Stop-Loss:
90.56
🎯 Take-Profit Targets:
• TP1: 85.64
• TP2: 83.41
• TP3: 81.09
• TP4: 78.40
TP5:
TP6:
⚙️ Leverage:
5- 10
⚠️ After reaching TP1, move Stop-Loss to Entry Price.
📌 Risk Management:
Risk only 1–2% of your capital per trade.
Always confirm the setup on your chart before entry
AAVE: bullish spike toward $100The Macro Picture 🗺️
On the daily, AAVE has completed a full V-reversal — a flush into the $60 macro floor in early June that tagged oversold, then a powerful recovery that reclaimed most of the prior range. Price spiked to $100, cooled, and is now grinding higher again at $90 with RSI trending up through 60. The macro floor held decisively, and the structure has flipped from correction to recovery, with the $100 decision the last barrier before the higher-timeframe supply.
The Setup ⚙️
The Reaction: The bounce off $60 has printed a clean sequence of higher lows, and each pullback has been shallower than the last — the signature of a trend rebuilding. RSI holding above its midline confirms buyers remain in control on the daily.
The Ceiling: The $100 decision is the level that caps the recovery — the recent spike high and a round-number magnet. Reclaiming it on a closing basis opens the path to the $110 macro resistance and the upper half of the spring range.
The Roadmap: Primary target sits at $100 — the Local High and recovery ceiling, where the green roadmap points once buyers press through $95. Invalidation: a sustained 1D close below $75 would break the recovery structure and reopen the path back toward the $60 macro floor.
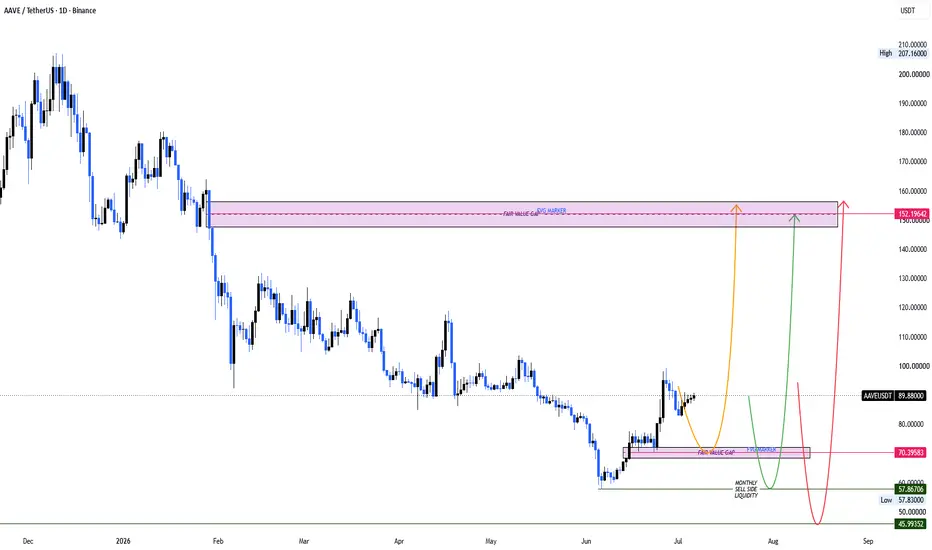
AAVEUSDT LONGThe broader bias across the crypto market remains to be bearish. In the short term, price indicates there is resistance to prevent further price collapse. On the daily charts, price has shifted from a bearish to bullish price structure informing our bias to seek buy limit orders. We have three entry points;
FVG 70.395
Monthly SSL1-57.87
Monthly SSL2-46
The take profit is the daily FVG 152.1
AAVE BUYBACK NEW TOKENOMICSDespite dominance of the DeFi lending sector, CRYPTOCAP:AAVE 's price performance is highly negative this year but might be about to change.
Team is currently working on "Aavenomics 3.0".
All we know so far is that it will include a "new automated and non-discretionary buyback mechanism", with further details to follow.
The news comes against a backdrop of Grayscale sharing a belief that CRYPTOCAP:AAVE could reach $3,500 per coin.
Aavenomics 3.0 is one of the more important tokenomics updates in DeFi right now
They are trying to make CRYPTOCAP:AAVE less of a passive governance token and more of the asset that sits at the center of the protocol’s economics
AAVE already has the hard part working with things like real lending activity, GHO, institutional products, and now a bigger push toward RWAs and V4.
Aavenomics 3.0 takes that a step further by moving buybacks to become more automatic and built into the system, instead of being something a committee manually decides each time.
Buybacks can strengthen the CRYPTOCAP:AAVE value-accrual story, while V4 expands the market Aave can go after
Protocol already has real usage + revenue, and now the focus seems to be on making sure more of that economic activity actually connects back to CRYPTOCAP:AAVE
AAVE USDT LONG SIGNAL#1
AAVE/USDT – Trade Setup (LONG)
📈 Position Type: LONG
🕒 Timeframe: 1 H
📊 Market: Futures
💰 Entry Zone:
84.68
🛑 Stop-Loss:
82.50
🎯 Take-Profit Targets:
• TP1: 87.25
• TP2: 89.82
• TP3: 92.63
• TP4: 95.20
TP5: 97.60
TP6: 100.30
⚙️ Leverage:
5- 10
⚠️ After reaching TP1, move Stop-Loss to Entry Price.
📌 Risk Management:
Risk only 1–2% of your capital per trade.
Always confirm the setup on your chart before entry
aaveusdt long Roddy01-SIGNALSPROVIDERInstructions:
Entry point: yellow
Stop loss: red
Take profit: green
👉Leverage x 5-10-20 for crypto
👉Leverage x 20-50-100 for commodities, stocks, indices, and forex
👉Margin 1-5% max.
Always practice risk and money management.
Invest a maximum of 5% on any trade or across all your trades.
Invest only what you can afford to lose, as no one is in control of the market.
👉Our analyses are primarily based on:
breakouts: two trend lines (ascending and descending) and a line indicating a horizontal breakout.
chart patterns: shoulders and head, triangle parttern, elliott impulse, etc etc.
We don't always have the time to track them at all times or to represent them visibly, given the numerous signals, the number of channels to manage, and especially because of the often rapid pace of market movements.
indicators: We associate at least two indicators with this technique.
👉Depending on the circumstances, we use specific indicators, often setting 3 or more take profit levels.
👉Indeed, there are good days in trading and also bad days. No one can promise to win every trade, and like all traders worldwide, we also experience stop-loss orders. However, we win more than we lose and remain positive.
👉You can close the position before or after the take profit orders indicated by the green lines if you are personally satisfied; the same applies to stop loss orders.
👉We must stay positive, clear-headed, and humble.
we cannot provide all instructions or all trades here on this channel.
Good luck to us all, and may God guide us. Amen.
AAVE: post-spike pullback into the $85 decisionThe Macro Picture 🗺️
AAVE detonated off the $72–$77 base and ran vertical into a $100 structural peak on Jun 27 — a volatility monster of a move that always demands a deep correction before it can extend. That correction is now underway: a clean stair of lower highs has walked price back to $85, with RSI cooling from overbought into the neutral zone. The macro trend is still up, so this is the pullback that decides whether the next leg has fuel, not a top.
The Setup ⚙️
The Reaction: Price is holding the $82.5–$85 support after the retrace, the first shelf where buyers have tried to arrest the slide. Momentum has neutralized rather than broken — a market catching its breath at a decision point, not one that has rolled over.
The Accumulation Zone: A deeper flush toward the $77–$80 breakout-retest zone opens a textbook pocket for staggered, averaging-based entries — the exact level the impulse launched from, where patient exposure lines up with how a healthy correction resolves.
The Roadmap: Reclaiming the $92.5 decision reopens the path to the $100 macro ceiling, where the green roadmap points. Invalidation: a sustained 1D close below $82.5 would flip the pullback into a deeper retrace toward the $77 macro support and the breakout base beneath it.
$AAVE is holding $86.93 after a sharp rejection from nearly.....BINANCE:AAVEUSDT is holding $86.93 after a sharp rejection from nearly $95.00.
Most traders are focused on today's candle—but the real opportunity could be lower.
📰 On-chain data shows mid-sized whales accumulated ~180,000 AAVE (worth about $16M) over the past 48 hours, despite recent weakness, suggesting larger holders are buying into dips.
Bias: 🟢 Bullish (on pullback) — the daily order block remains untested.
📍 Entry: $76.08–$70.46
🛑 SL: $68.20 (-7.9% from $74.00 entry)
🎯 TP1: $85.00 (+14.9% | 1.9:1 R:R)
🎯 TP2: $98.20 (+32.7% | 4.1:1 R:R)
Watching @Aave and @santimentfeed for continued whale accumulation.
Most traders chase green candles.
Patient traders wait for discounts.
Would you buy the dip or wait for confirmation? 👇
#AAVE #DeFi #CryptoTrading
AAVE - Trend-Following Long Opportunity?AAVE remains overall bullish, continuing to trade within a well-defined rising blue wedge. 📈
Price is now approaching a high-confluence support area formed by the intersection of the lower bound of the rising wedge and the demand zone marked in blue.
📌 As long as this confluence holds, we will be looking for trend-following long setups, anticipating the continuation of the broader bullish trend.
As always, rather than buying blindly into support, we will wait for bullish confirmation before considering any long positions.
Will buyers defend this key confluence and trigger the next bullish impulse? 🤔
⚠️ Disclaimer: This is not financial advice. Always do your own research and manage risk properly.
📚 Stick to your trading plan regarding entries, risk, and management.
Good luck! 🍀
All Strategies Are Good; If Managed Properly!
~Richard Nasr
AAVE at flipped support: $100 retest in playThe Macro Picture 🗺️
The June 28 reclaim thesis is intact but under pressure. Two attempts at the $100 supply have been rejected on close — first on the June 27 wick, then on this week's second push — leaving a visible double-rejection structure at the level. Price has now pulled back to $87, the exact line that anchors the entire bullish arc from the June 12 sweep reversal. The structural question has compressed onto a single test: whether buyers defend the flipped support on first contact from above. RSI has cooled from the mid-60s into the high-40s — consolidation territory, not reversal yet. The arc isn't dead, but the burden of proof has shifted from "expand through $100" to "hold $87 first".
The Setup ⚙️
The Rejection: The $100 supply has held twice in five sessions — the double-rejection structure is now visible on the daily, and any third attempt needs to either break decisively or confirm the level as a structural top. There is no neutral outcome from a third test of this kind.
The Support Flip: The $87 line is the entire bullish arc compressed into one level — the former macro ceiling that flipped on the June 24/26 reclaims and now sits as the first retest from above. A defended wick here is the kind of higher-low confirmation that opens the path for the third $100 attempt.
The Trigger: Holding $87 on close and recovering into the $93–$95 band sets up the mechanical retest of $100. Clearing $100 on close on that third attempt removes the double-rejection cap and unlocks the path toward the $115 distribution band overhead.
The Roadmap: Primary objective is the $100 break — clearing the double-rejection supply on close opens the structural path toward $115, with $130 macro ceiling as the extended target if the breakout sustains. Invalidation: a sustained 1D close below $78 would invalidate the entire reclaim arc and reopen the path toward $68 structural support and deeper.
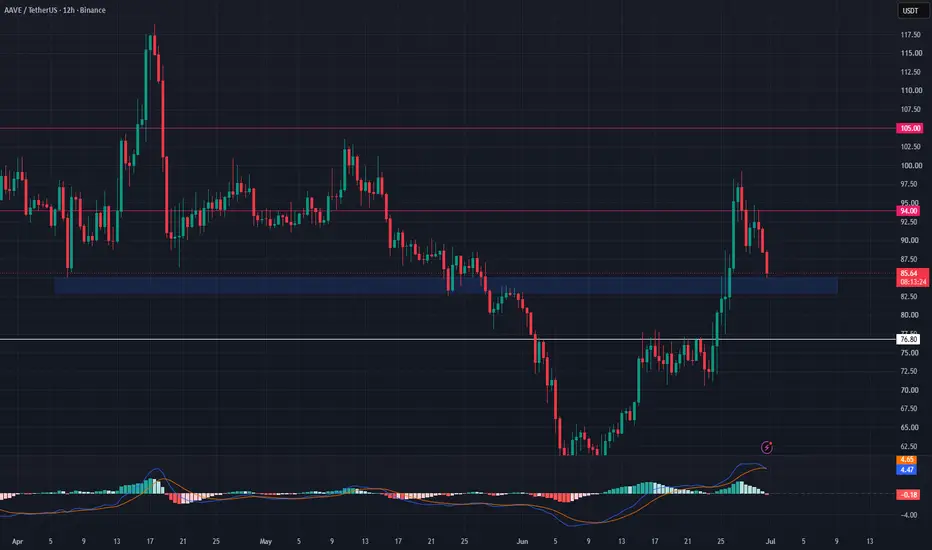
AAVE Long Setup: Breakout Strength From Major SupportAave is breaking out and showing strong relative strength, while currently trading near a major support area. This zone could provide a good opportunity for a long swing trade setup.
Our research suggests that if buyers continue to defend this support level, AAVE could see a continuation move toward the next major resistance zone, making the bullish scenario more likely.
Trade Levels:
Entry Zone: $83 – $85
Take Profit Targets: $94, $105
Stop Loss: $76.80
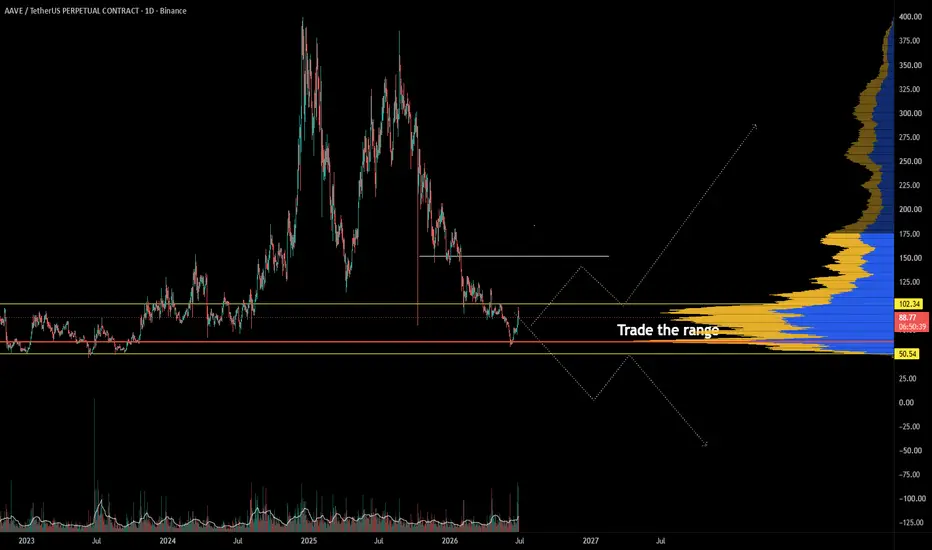
AAVE is sitting in a major decision zone.After a strong run and deep retrace, price has returned to a high-volume range where the market previously built structure. That makes this area important, but it is not a clean breakout setup yet. It is still a range trade.
AAVE remains below the major breakdown area, so bulls need to prove strength before momentum fully shifts. At the same time, price is testing a zone where buyers have stepped in before, and the volume profile shows this could be a key battleground.
I would not chase here.
The cleaner approach is to watch how AAVE reacts inside the range. If buyers defend the lower side and reclaim the middle, the chart starts to improve. If it loses this zone, downside pressure can continue.
Patience matters here.
Trade the range. Wait for confirmation. Let the market show if this is accumulation or just another pause before continuation lower.