ACH/USDT — Long Setup | 1DACH is pulling back toward a price area that previously acted as a base before a strong expansion higher.
The 0.004900–0.005139 zone is interesting because buyers were already active there before the latest impulse. I am not interested in chasing price at current levels — I would rather wait for a deeper retracement back into this structure.
Entry 1: 0.005139
Entry 2: 0.004900
Invalidation / Stop: 0.004655
Risk: 1%
Potential: 3–30%
The idea is simple: if price revisits the old base and demand i
In-depth trading ideas
ACH AT A CRITICAL RESISTANCE | BREAKOUT OR ANOTHER REJECTION?💵 Coin: NYSE:ACH / USDT
⏳ Time Frame: 3D
📉 Pattern: Descending Channel
💰 Current Price: ~0.005694 USDT
---
🔻 Pattern Overview
📐 A Descending Channel is a chart pattern formed when price moves between two downward-sloping trendlines.
On the ACH/USDT chart, we can see:
🔴 Upper Resistance: The red trendline connecting a series of lower highs.
🟡 Lower Support: The yellow trendline forming the channel's lower lows.
🟢 Midline: The middle trendline that helps identify price movement and momentum
ACH/USDT (1h) Testing a Double Bottom BreakoutACH/USDT is forming a large double bottom pattern on the 1H chart, with two major lows developing around $0.0048–$0.0049 and a shared neckline resistance near $0.00535–$0.00540.
Price has now recovered back to the neckline and is testing a potential breakout. A confirmed close and hold above this resistance could validate the bullish reversal structure and open the way toward the $0.0060–$0.0062 measured target area.
A rejection from the neckline would keep the pattern unconfirmed and could le
ACH: Supply Exhaustion at Key Resistance BarrierACH: Supply Exhaustion at Key Resistance Barrier – Strategic Long Setup on Accumulation Retest
ACH is displaying highly encouraging signs of momentum building following two successive attempts to resolve its rectangular accumulation structure to the upside. During the first breakout attempt, heavy profit-taking triggered a long upper wick suppressing prices back beneath the dynamic MA100 baseline and into the range. However, on the second breakout attempt, despite encountering mild resistance
ACHUSDT — Long off Demand [Quantum Algo]ACH sold off into a 0.00422 base, then recovered and has been rotating in a 0.00430–0.00457 balance. Price pushed toward the upper half, pulled back into a demand shelf around 0.004397, and held — firing the Buy. This is a rotation long: buy the reaction in the lower-middle of the balance, target the range highs where the last supply sits.
Why this setup works — three confluences:
Demand rejection on the retrace. Price pulled back into the demand zone and held rather than sliding back toward th
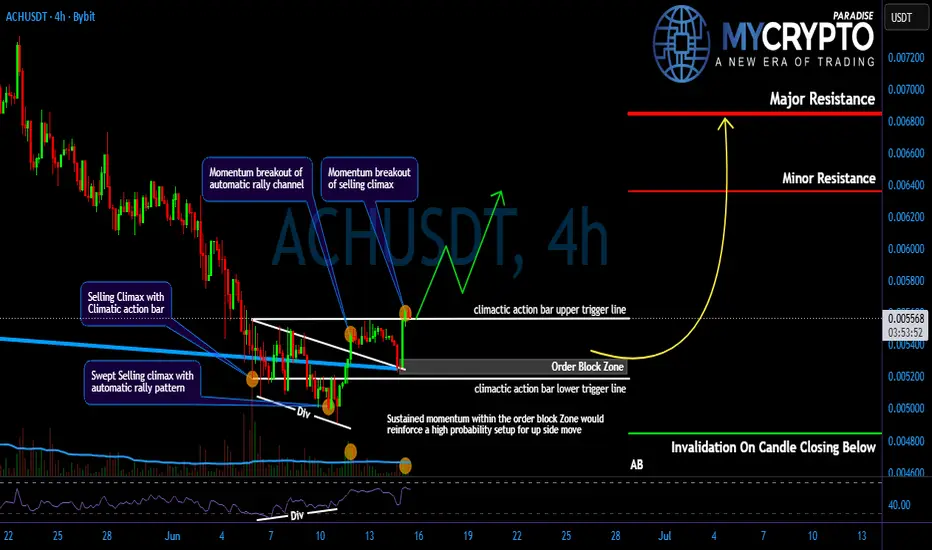
ACH’s Trap Is Loading — Is the Real Move Next?Yello Paradisers! Are you prepared for a potential sharp move on #ACH, or are you still underestimating what’s quietly building behind the scenes? At first glance, this structure might seem like a simple and healthy pullback. But when we strip away emotions and analyse the chart objectively, a completely different narrative emerges. This is not random price action — this is a high-risk, high-opportunity zone where discipline matters far more than opinions.
💎#ACH has recently printed a classic S
ACH/USDT 2D — Major Breakout or Fakeout?The chart of Alchemy Pay on the 2D timeframe is showing a very interesting technical structure after spending months moving below a major descending trendline resistance.
At the moment, price action is attempting to break out from the long-term bearish trendline that has acted as strong resistance since mid-2025. 🔍
---
📊 Chart Structure Analysis
🟡 Main Pattern: Descending Resistance Breakout Attempt
For several months, the price has continued forming lower highs, creating a clear descendin
ACH · Bearish continuation (-10%) vs bullish breakout (+300%)Here I have a great example of the argument that I've been making in support of a bullish altcoins market. I know you will agree with me or at least you will be able to understand my point of view even if you disagree.
I realized that many people leaving strange comments don't actually read. Whenever I read an article I find myself agreeing with the author. Not because I am easy to convince but because most people have a sound argument. I can disagree but after reading I know what the author is
ACH · Bearish continuation (-10%) vs bullish breakout (+200%)Here I have a great example of the argument that I've been making in support of a bullish altcoins market. I know you will agree with me or at least you will be able to understand my point of view even if you disagree.
I realized that many people leaving strange comments don't actually read. Whenever I read an article I find myself agreeing with the author. Not because I am easy to convince but because most people have a sound argument. I can disagree but after reading I know what the author is
ACH Distribution Trap — Is a Drop Coming?Yello Paradisers! Are you prepared for a potential sharp downside move on #ACH, or are you still calling this “just a healthy pullback” while smart money quietly distributes above you? At first glance, the structure may look harmless. But when we remove emotions and read the chart objectively, the story changes completely. This is not a random retracement. This is a high-risk zone where discipline matters more than opinions.
💎#ACH has clearly respected the descending resistance trend-line and f
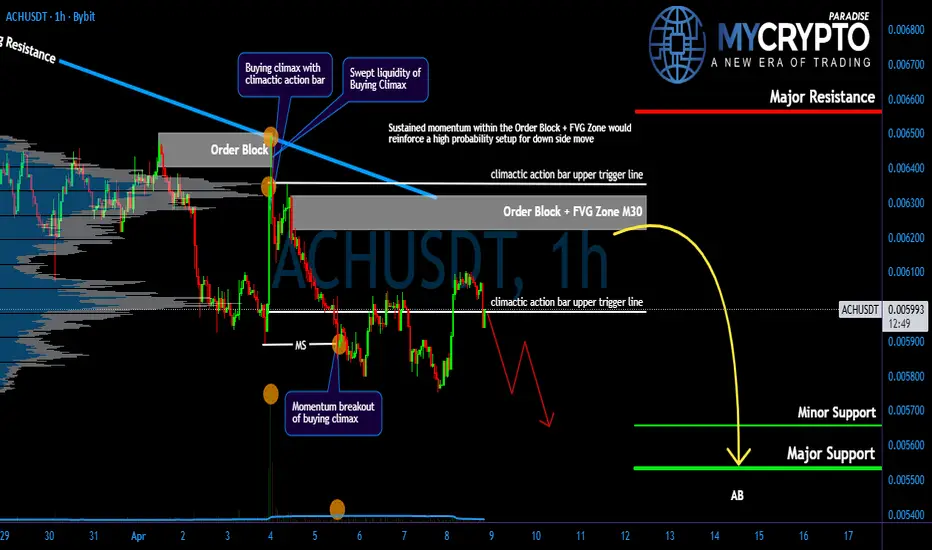
ACH Is About to Collapse? Smart Money Is Dumping!Yello Paradisers! Are you seeing what smart money is doing on #ACH right now, or are you about to become liquidity for the next leg down? This current move might look harmless to inexperienced traders… but the structure is telling a completely different story. And if you understand what the chart is really showing, you know this is not the place to get emotional.
💎#ACH formed a buying climax followed by climactic action bar, strongly suggesting that institutional players are offloading and prep
ACH will experience a strong pump soon (8H)The price has formed a bottom at a 3D pattern. This pattern indicates the liquidation of sellers, after which the price typically rebounds upward.
Our confirmation comes from the break of the trigger line. For some time, the price was unable to break this trigger line, but now it is trading above it, which clearly shows that buyers are strong.
Additionally, we have a bullish CH (Change of Character) on the chart, further confirming that strong buyers have appeared.
The current structure suppo
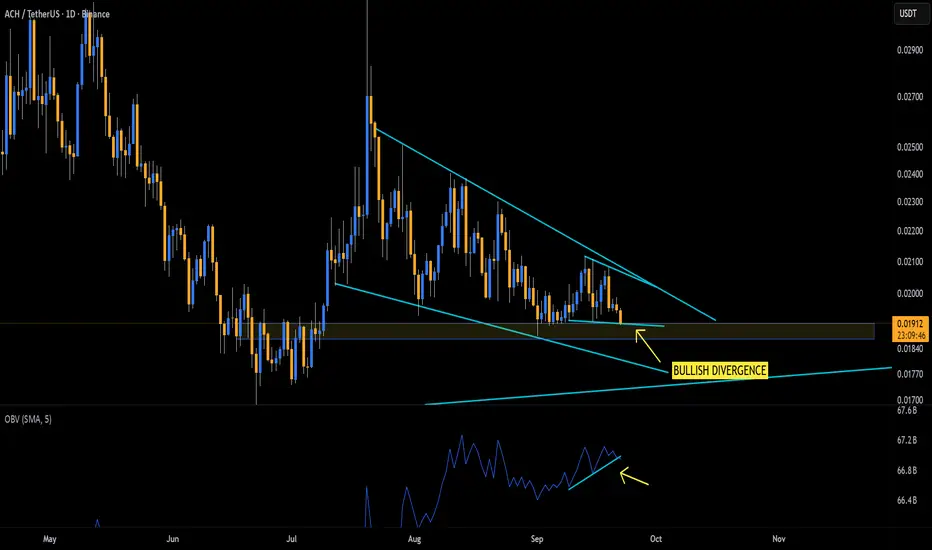
ACH/USDT — Multi-Year Support Zone, Bounce or Breakdown?🔎 Overview
ACH/USDT is currently consolidating within a multi-year demand zone around ~0.01811 (highlighted in yellow). This level has acted as a strong support multiple times, producing significant reactions whenever price touched it.
However, each bounce from this area has been weaker than the last, forming lower highs — a clear sign of persistent selling pressure. Structurally, this resembles a descending triangle, where sellers are consistently pushing from above while buyers defend the sa
$ACH LAST OPPORTUNITY TO BUY AT THIS PRICE!FWB:ACH Is consolidating before pumping up to $0.05 like it did the last 2 times. zoom out on my chart and you will see.
Only this time, with the altcoins gearing up for a bull run and main net for FWB:ACH scheduled for Q2 2026, We are going to faintly break out of the MULTI YEAR CHANNEL!
EASILY HEADED TO $0.20+
ACCUMULATE AS MUCH AS YOU CAN WHILE YOU HAVE TIME!!!!!
Title: Buy Trade Strategy for ACH: Powering the Future of CryptoDescription:
This trading idea highlights ACH, the native token of the Alchemy Pay ecosystem, a project focused on bridging the gap between fiat and crypto through seamless payment solutions. ACH enables fast, low-cost transactions and supports real-world utility by integrating with global merchants and payment gateways. With partnerships spanning major platforms and growing adoption in Asia and beyond, Alchemy Pay positions itself as a key player in driving cryptocurrency adoption for everyday
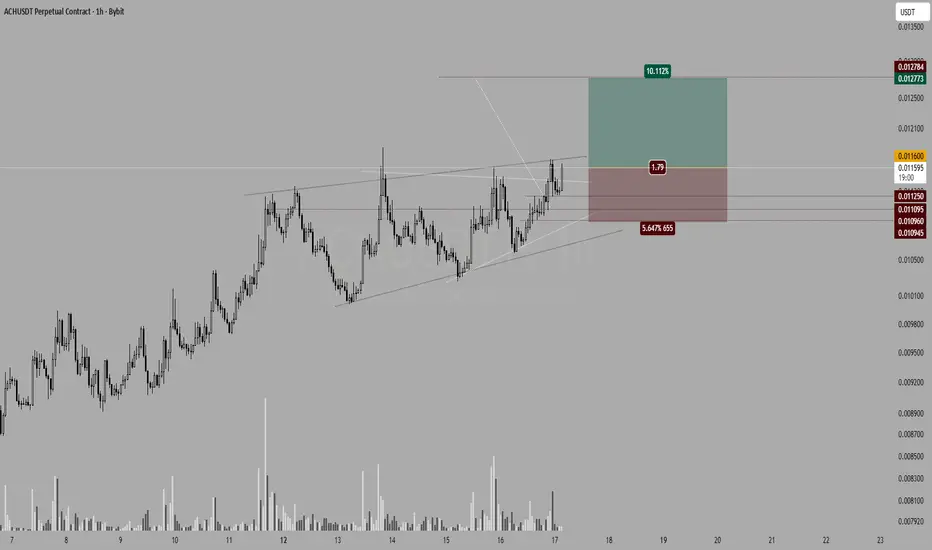
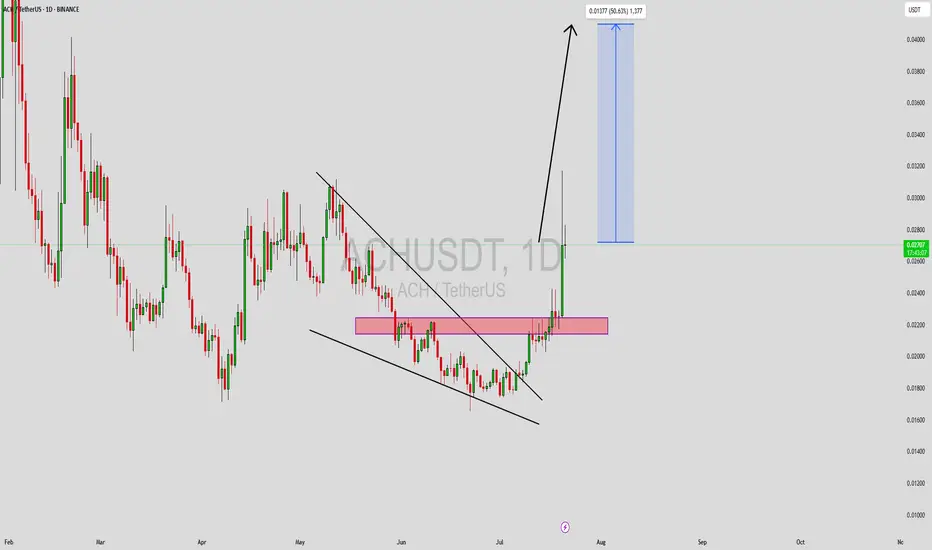
ACHUSDT Forming Descending ChannelACHUSDT is currently displaying a promising descending channel pattern, which is a classic technical setup often seen before a bullish reversal. The price has consistently respected the upper and lower bounds of the channel, and recent price action indicates a potential breakout. With good volume support, this setup gains even more credibility, suggesting growing interest and confidence among market participants. As of now, traders are eyeing a potential 40% to 50% upside move as the price attem
ACH/USDT at a Historical Pivot Zone — Is a Major Reversal🔍 In-Depth Weekly Chart Analysis of ACH/USDT
ACH/USDT is currently retesting a critical historical demand zone between $0.01876 – $0.02263, which has consistently acted as a major accumulation area since late 2022. This zone has served as the launchpad for multiple bullish moves in the past and is now being tested once again.
Interestingly, price action appears to be forming a long-term consolidation base, potentially a triple bottom pattern or a classic accumulation phase, which often precede
#ACH/USDT#ACH
The price is moving within a descending channel on the 1-hour frame and is expected to break and continue upward.
We have a trend to stabilize above the 100 moving average once again.
We have a downtrend on the RSI indicator, which supports the upward move by breaking it upward.
We have a support area at the lower limit of the channel at 0.01800, acting as strong support from which the price can rebound.
Entry price: 0.01878
First target: 0.01925
Second target: 0.01970
Third target: 0.