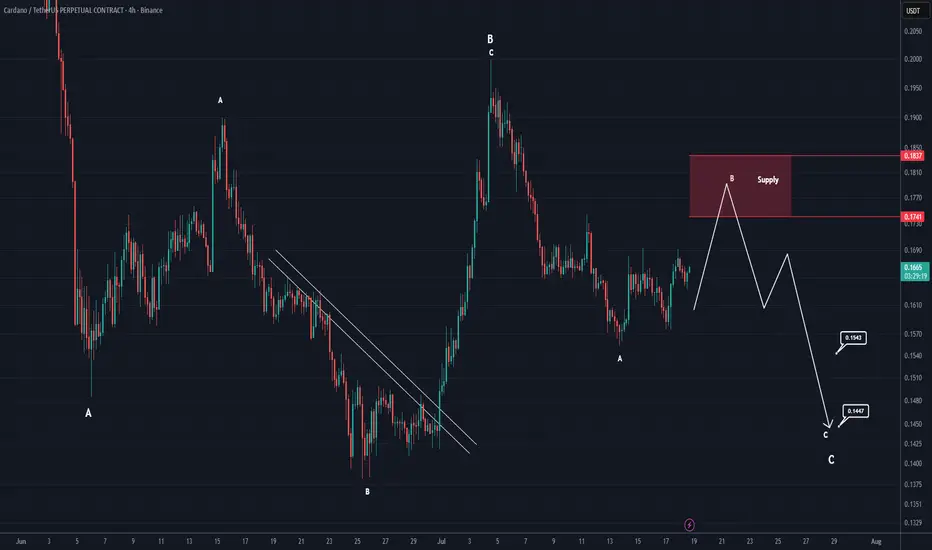
ADA is still trading within a complex corrective pattern (4H)Cardano is still trading within a complex corrective pattern. The recent decline appears to have formed Wave A, followed by the completion of Wave B. The price now seems to be developing the lower-degree Wave C, which is expected to be bearish.
It is worth noting that the higher time frame trend remains bearish.
We are looking for sell/short opportunities within the highlighted supply zone.
The targets are marked on the chart. At the first target, secure partial profits and then move your stop loss to break-even.
Let's see how it plays out.
If you have a coin or altcoin you want analyzed, first hit the like button and then comment its name so I can review it for you.
Do you also think CARDANO is bullish?
In-depth trading ideas
ADA USDT LONG SIGNAL#85. ADA/USDT – Trade Setup (LONG)
📈 Position Type: LONG
🕒 Timeframe: 1H
📊 Market: Futures
💰 Entry Zone:
0.1610
0.1550
🛑 Stop-Loss:
0.1520
🎯 Take-Profit Targets:
• TP1: 0.1650
• TP2: 0.1704
• TP3: 0.1789
• TP4: 0.1868
⚙️ Leverage:
5
▫️ After TP1, move SL to Entry + 0.2%.
▪️ Exit Plan:
• 40% at TP1
• 20% at TP2
• 20% at TP3
20% at. TP4
📌 Risk Management:
Risk only 1–2% of your capital per trade.
⚠️ Always check and confirm the setup on your chart before entering the trade
ADA Analyses-13, [July 21, 2026]Welcome to my page! I share daily technical analyses of crypto assets and other charts here.
BINANCE:ADAUSDT
💡Market Analysis:
ADA has broken above the descending trendline and key resistance level with a strong bullish momentum candle. A successful retest of this key level will confirm the continuation of the upward trend toward the next resistance targets.
Key Support & Resistance:
Key Resistance: 0.1943 - 0.2262
Key Support Area: 0.1735 (Key Level) / 0.1560
🎯 Trade Entry & Exit Plan:
Entry : Breakout/Pullback of trendline or key zones with >80% candle body and two waves outside.
Stop Loss : Behind the last wave or the last strong breakout candle.
Take Profit : Minimum R:R 2, with further targets at major horizontal levels (0.1943 & 0.2262).
⚠️Risk Management:
Maximum 1% risk per trade.
❤️Please share your thoughts and comments on this analysis!
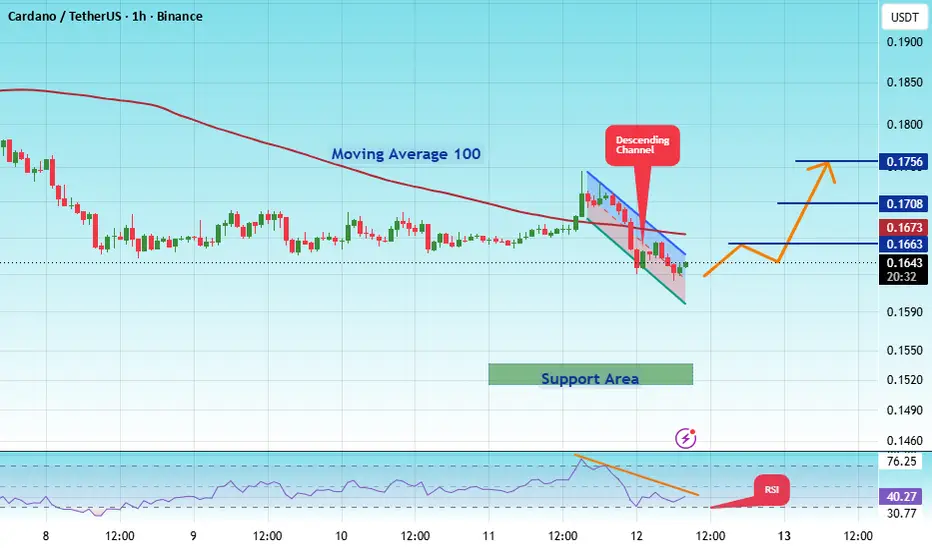
#ADAUSDT 1 H Spot LONG#ADA
The price is moving within a descending channel on the 1-hour timeframe and has reached the lower boundary. It is now poised for a bounce and is expected to retest this boundary.
The Relative Strength Index (RSI) indicates a downward trend, which is likely to continue given the overbought conditions.
There is a key support zone (in green) at 0.1510, and the price has bounced off this zone several times, making it a strong support level.
The price is trending towards the 100-period moving average, which we are approaching. This trend supports an upward move.
Entry Price: 0.1630
Target 1: 0.1663
Target 2: 0.1708
Target 3: 0.1756
Stop Loss: At the resistance zone (in green)
Remember this simple rule: Money management.
Any questions? Please leave a comment.
Thank you.
ADA: local squeeze with $0.2109 destinationThe Macro Picture 🗺️
ADA unwound from the $0.2886 macro ceiling into a summer base and has reclaimed $0.1743, holding above the $0.1484 local low. Price is rotating in the middle of the range with the floor intact — a base rebuilding, not a breakdown.
The Setup ⚙️
The Range Floor 🟢
$0.1484 (Local Low) is the demand shelf, with $0.1380 (Macro Support) as the deeper backstop. Both have held through July, and that's the base this range pivots on.
The Decision Point 🔴
$0.1999 (Local High) is the gate. A daily close above it flips the local structure bullish and opens the path to the $0.2109 measured-move target.
The Roadmap 🛣️
Hold above $0.1484 → break $0.1999 → run toward $0.2109. Invalidation is a clean daily close below $0.1380 — that breaks the range.
This is a GRID Range Play: a defined band to rotate, buying the lower half and scaling out into the breakout.
More setups in profile.
#ADA #Cardano #crypto #trading #TA #3Commas #GRID
ADAUSDT - Potential Inverse Head & ShouldersAfter a prolonged downtrend, ADA appears to be forming a potential Inverse Head and Shoulders pattern on this timeframe.
The Left Shoulder, Head, and Right Shoulder are beginning to take shape, suggesting a possible shift in market sentiment from bearish to bullish.
However, the pattern has not yet been confirmed, as the price remains below both the neckline and the medium-term descending trendline.
The $0.19–$0.20 area is a key resistance zone. A breakout above this level, supported by strong trading volume, would provide confirmation that buyers have gained control of the momentum.
Until a confirmed breakout occurs, I consider this a potential setup rather than a buy signal.
If the breakout is followed by a successful retest of the neckline as support, the next upside target could be projected using the measured move of the Inverse Head and Shoulders pattern.
Key Supply Zone: 0.1679 ~ 0.1973
Hello, traders.
Follow for more ADA analysis, trade setups, and crypto market insights.
--------------------------------------------------
📈 ADA Monthly Chart (1M) Outlook
ADA is currently trading at a critical price zone that could determine whether a long-term trend reversal is underway.
The 0.1679 ~ 0.1973 range is a major supply zone where a strong bullish rally previously began after a successful breakout.
Going forward, the most important factor is whether ADA can break above this range and flip it into support.
On the other hand, as long as price remains below 0.1679, ADA is still considered to be trading within a long-term accumulation/investment zone. This means aggressive FOMO entries should be avoided, and a more patient approach is recommended.
--------------------------------------------------
📊 ADA Trading Strategy
In conclusion, the ideal trading opportunity for ADA comes when the market confirms support within the 0.1679 ~ 0.1973 range.
A key high-volume node (Volume Profile) is located around 0.1813.
Therefore, a bullish setup becomes more valid only after ADA establishes acceptance above 0.1813 and successfully confirms it as support.
At the moment, however, a full trend reversal has not been confirmed yet.
A stronger bullish trend is more likely to develop once the monthly (1M) candle breaks above the upper M-Signal level and sustains price action above it.
Until then, short-term trading and active day-trading strategies may offer better opportunities than longer swing positions.
--------------------------------------------------
🟢 Bullish Entry Checkpoints
The HA-Low zone stretches from 0.1456 on the 1D chart up to 0.1971 on the 1W chart.
If ADA confirms support within this area, traders can consider scaling into positions through staggered entries.
A successful support flip above 0.1813 would provide an even stronger bullish entry signal.
--------------------------------------------------
🚀 Conditions for Trend Continuation
For ADA to maintain bullish momentum after breaking key resistance levels, the following conditions should be met:
① StochRSI
- Must continue trending higher without becoming excessively overbought.
② OBV (On-Balance Volume)
- Must remain above the High Line with sustained volume inflows.
③ BSSC
- Must stay above the zero line, confirming trend strength.
If these conditions are met, ADA could have a higher probability of extending its rally after breaking above 0.1973.
--------------------------------------------------
💡 Trading Perspective
The market never moves exactly according to anyone's prediction.
Blindly buying based on someone else's outlook is extremely risky.
The goal is not to predict the market, but to identify tradable zones and wait for actual confirmation from price action.
Avoid FOMO entries and focus on high-probability setups. That's how traders protect their capital over the long run.
--------------------------------------------------
🎯 Mid-to-Long-Term Investment Strategy
For investors looking to hold ADA over the medium to long term, continuously injecting new capital simply to increase position size may not be the most efficient approach.
Instead, consider using trading profits to accumulate additional ADA.
One effective strategy is to scale in based on average entry prices, then partially take profit during rallies by withdrawing the principal amount and leaving only profit-generated holdings in the market.
This allows investors to gradually increase their ADA holdings while managing risk more effectively.
--------------------------------------------------
Always wait for the chart to confirm your setup before entering and let the market signals guide your decisions.
-----
Wishing you successful trading and profitable investments. 🚀
-----------------------------------------------
#ADAUSDT D / QM Pattern / long#ADAUSDT D
Cardano is showing the potential for a 40% upside move.
A very clean QM pattern has formed, and if price finds support at either of the blue demand zones, it could move toward our projected target.
In my opinion, this setup offers an attractive risk-to-reward opportunity.
We'll keep you updated.
#ADA
CRYPTOCAP:ADA
LONG Cardano (ADAUSDT) with 10X (3,360% Profits Potential)Cardano is now moving within a huge falling wedge pattern and unavoidable bottom recovery signal. As the end of the pattern, long-term support, has been hit, we can see volatility go up and a change in price dynamics, revealing the market is about to turn/change course.
A bullish wave on this chart setup can last several months, it can be 3 months just as it can be 6 months. It cannot be 2 weeks or 1 month. This is a long-term market phase that is starting to develop now. The bear market and bottom recovery took years to fully unravel. Any type of bullish action is set to go for a while. It will be long lasting.
Full trade-numbers below:
_____
LONG ADAUSDT
Leverage: 10X
Potential: 3360%
Allocation: 5%
Entry zone: $0.1450 - $0.1620
Targets:
1) $0.2222
2) $0.2768
3) $0.3164
4) $0.3560
5) $0.4124
6) $0.4842
7) $0.5634
8) $0.6124
9) $0.6916
Stop: Close weekly below $0.1440
_____
Trading strategy: Buy and hold then wait patiently for the market to take care of the rest. Take profits as the market starts to rise. Avoid the temptation to buy and rebuy as the bullish wave unfolds. Keep your initial entry position and hold strong. An easy call, there is high chance for success.
Thank you for reading.
Namaste.
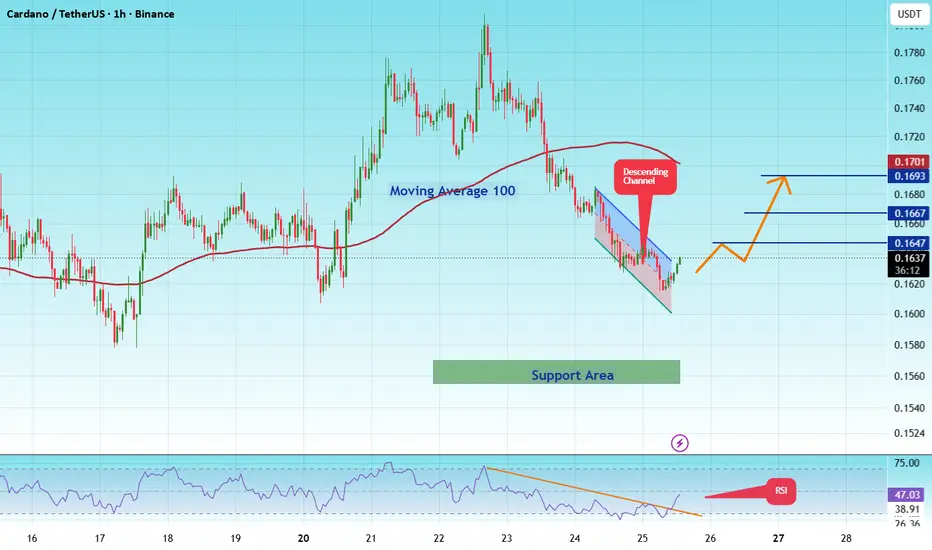
#ADAUSDT 1 H Spot LONG#ADA
The price is moving within a descending channel on the 1-hour timeframe and has reached the lower boundary. It is now poised for a bounce and is expected to retest this boundary.
The Relative Strength Index (RSI) indicates a downward trend, which is likely to continue given the overbought conditions.
A key support zone has been identified in green at 0.1550. The price has bounced off this zone several times, making it a strong support level.
The price is trending towards the 100-period moving average, which we are approaching. This trend supports an upward move.
Entry Price: 0.1626
Target 1: 0.1647
Target 2: 0.1667
Target 3: 0.1693
You can close at the second target or wait for the third target. The choice is yours.
Stop Loss: At the resistance zone in green.
Remember this simple rule: Money Management.
Any questions? Please leave a comment.
Thank you.
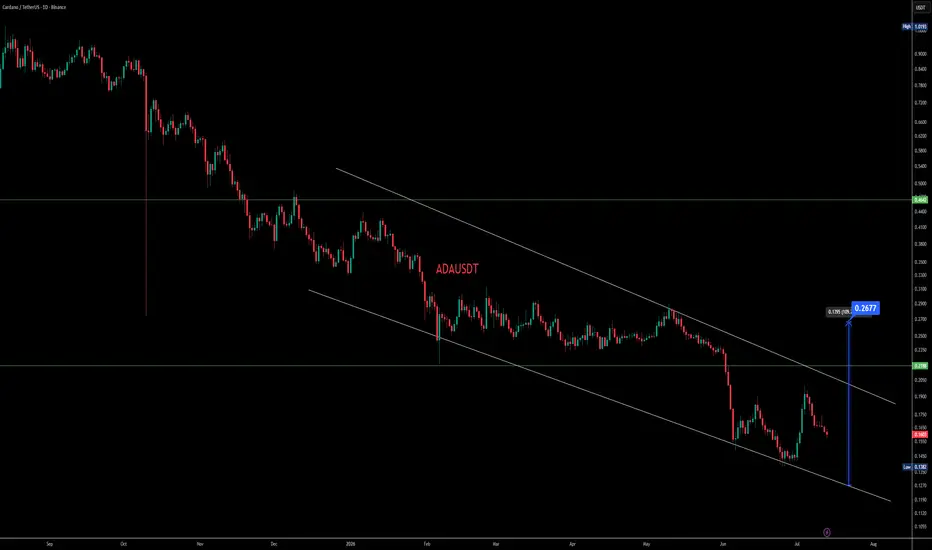
$ADAUSDT Descending Channel StructureADAUSDT is trading on the 1D timeframe within a well-defined descending channel, with price respecting both the upper and lower trendlines visible on the chart.
The current price is trading around the 0.1603 area after rebounding from the lower boundary of the channel. This keeps price inside the existing bearish structure while testing whether buyers can build enough momentum for a trend change.
Key levels to watch:
Support: around 0.1382–0.1342, near the lower channel boundary.
Resistance: the descending channel resistance near 0.19–0.20, followed by the horizontal level around 0.2188.
A confirmed breakout above the upper channel trendline could signal improving bullish momentum. If that breakout is confirmed, the chart projects a potential move toward 0.2677, representing approximately 109% from the marked low on the chart.
If price fails to break the channel resistance and loses the 0.1382–0.1342 support zone, the bullish scenario may become invalid, and the current downtrend structure could remain in effect.
This chart is shared for educational purposes. Watch for confirmation before considering any directional bias.
ADA - 1H - 13.07.2026🔍 Key Levels & Market Structure Analysis
The Active Demand Zone ($0.1578 – $0.1587):
This blue horizontal band is the immediate point of interest. It marks a historical launchpad where buyers previously stepped in aggressively to absorb supply.
The Breakout Invalidation Line ($0.1558):
This lower support line protects the trade structure. A 1-hour candle body closing completely below this level fully invalidates the bullish thesis.
Overhead Target Resistance ($0.1647):
This pink supply roof is the ultimate destination for a long trade. It lines up with the multi-day consolidation ceiling that capped prices across July 12th.
Buying zone at these FVGs This is the underlying narrative in future that price will forecast as we can se clearly price is in a strong downtrend and not willing to go up but these are the deep zones that can smash price and send higher , these are the deep discount zone that are based on Monthly weekly and on daily analysis.
ada usdt short signal#49. ADA/USDT – Trade Setup (SHORT)
📈 Position Type: SHORT
🕒 Timeframe: 1 H
📊 Market: Futures
💰 Entry Zone:
0.1635
🛑 Stop-Loss:
0.1671
🎯 Take-Profit Targets:
• TP1: 0.1613
• TP2: 0.1587
• TP3: 0.1561
• TP4: 0.1530
TP5:
TP6:
⚙️ Leverage:
5- 10
⚠️ After reaching TP1, move Stop-Loss to Entry Price.
📌 Risk Management:
Risk only 1–2% of your capital per trade.
Always confirm the setup on your chart before entry
ADA: support retest while BTC sleeps — reversion or beta drag?🧭 Where we are
ADA is pressing the lower edge of its 4H range (~0.162 support zone),
not the middle. BTC is ranging — correlation ~0.55, so this is NOT pure beta.
📊 What flow is saying (qualitative)
• CVD trending up near support — buyers absorbing, not panic selling
• OI inflow weak — move lacks leverage fuel; confirmation matters
• Funding slightly negative — shorts paying; tailwind for longs IF level holds
• Stablecoin dominance easing — mild risk-on, helps alts vs pure BTC chop
• Macro fear elevated (cheap + fear) — counter-trend longs need structure, not hope
🔍 Scenarios (a plan, not an order)
Scenario A — Reversion:
Hold ~0.162 zone + buyer aggression in volume/CVD → long interest FROM the level.
Invalidation: acceptance below support — thesis off.
Scenario B — Breakdown / BTC drag:
Clean break below support OR BTC range breaks down with correlation kick-in
→ long off; watch failed retest only if flow confirms.
PASS if: price sits mid-range, OI stays dead, or BTC breaks without alt confirmation.
🎯 Note
This is shadow observation in our alt flow pipeline — NOT a live trade.
We journal the read before any execution. Process > signal.
Follow for flow-based crypto journals — BTC primary, alts when structure aligns.
⚠️ Not financial advice. Scenario map and education — no entries, stops or targets.
ADA | The Structure Flips Bullish — Buying The Discount!By analyzing the #Cardano (ADA) chart across multiple timeframes, we can see that the market is showing its first genuine signs of a bullish shift after an extended downtrend.
Price has broken a key level with force and is now offering a potential accumulation setup from discount. Let's break it down frame by frame.
📊 4H Timeframe
On the 4H, the broader move had been a clean downtrend — a steady sequence of bearish BOS pressing against a descending trendline.
That picture has now changed: price broke the Key Level with force and printed a bullish CHoCH, then returned to react from the Order Block ( OB + Key Level at $0.1631 – $0.1674 ) sitting right inside it. This is the first real signal of a shift in momentum.
What makes this compelling is location. Price is currently trading around $0.1719 , sitting below the 0.5 equilibrium ( $0.1691 ) — meaning we're in the discount half of the range, exactly where high-probability longs live. As long as price holds above the Protected Low at $0.1387 , the bullish structure stays intact. A break below it would flip the trend bearish again.
⏱️ 30m Timeframe
On the 30m, price is still working through a sideways range with a short-term down trend. There's a pocket of buy-side liquidity ($$$) resting at the equal lows around the current zone — and my expectation is for price to sweep that liquidity first, then push higher.
Alternatively, if price breaks the Flip Zone ( $0.1631 – $0.1763 ) with a few clean closes above it, I'll look for a corrective pullback into that zone and a bullish reaction from there — which would be a high-quality long entry.
🎯 The Bias
My base case is bullish while price holds above the Protected Low.
The cleanest path: a liquidity sweep of the equal lows below, a reaction from the OB / discount zone, and then a rally toward the buy-side liquidity (BSL) stacked overhead at $0.2185 , $0.2390 , and ultimately $0.2888 .
The fib projection lines up with this, targeting the 0.786 ($0.1866) and 1.0 ($0.1996) extensions on the way up.
In my view, buying the discount here — with risk defined below the Protected Low — offers a favourable setup, as long as buyers confirm with the sweep-and-reclaim.
📰 Fundamental Backdrop
The bullish technical shift is backed by a genuinely improving fundamental picture. Despite closing June down nearly 40%, ADA has since bounced roughly 18% off its $0.1387 low and reclaimed a top-15 ranking — and crucially, whale wallets holding 10M–100M ADA increased their share of supply from 37.66% to 38.13% right through the selloff, a clear sign that larger players were accumulating into weakness. On the catalyst front, Cardano's van Rossem hard fork (a major Plutus/scaling upgrade) is scheduled to potentially enact on one of several July dates, while on the regulatory side, Grayscale has filed with the SEC for a spot Cardano ETF ("GADA"), with a streamlined review window opening August 9. It's also worth noting July has historically been one of ADA's strongest months, averaging an 11.2% gain with six of the last nine Julys closing green. That said, risks remain: on-chain transaction activity recently hit a 45-day low, high Bitcoin dominance continues to squeeze altcoins, and broader sentiment sits in Extreme Fear — so confirmation of the technical setup matters before committing.
This analysis will be updated as the market evolves. If this breakdown added value, drop a like 👍 and a comment 💬 to support the work — and share where you see Cardano heading next! Best Regards, BigBeluga 🐳
ADA/USDT AnalysisAfter a strong bearish trend, **ADAUSDT** is currently consolidating within a 15-minute range.
From a multi-wave perspective:
* **HWC:** Bearish
* **MWC:** Bearish
* **LWC:** Currently ranging
The key level to monitor is **0.1652**. A confirmed breakdown below this support would align the **LWC** with the higher-timeframe bearish structure, creating full bearish confluence across all wave conditions.
This would significantly increase the probability of downside continuation, making **0.1652** an attractive trigger level for a potential short position, provided the breakout is confirmed by price action.
**Trade Idea:** Wait for a confirmed break below **0.1652**, then look for a short entry with proper risk management.
adausdtThe fundamentals of the network are solid and Cardano is making technological progress, but the market is currently impatient with it. If you are considering buying, it will be important to watch whether ADA holds strong support around $0.16 and whether the overall crypto market returns to the green.
ADA USDT SHORT SIGNAL. ADA/USDT – Trade Setup (LONG
📈 Position Type: LONG
🕒 Timeframe: 1 H
📊 Market: Futures
💰 Entry Zone:
0.1581
0.1530
🛑 Stop-Loss:
0.1480
🎯 Take-Profit Targets:
• TP1: 0.1646
• TP2: 0.1720
• TP3: 0.1797
• TP4: 0.1862
TP5: 0.1945
TP6:
⚙️ Leverage:
5- 3
⚠️ After reaching TP1, move Stop-Loss to Entry Price.
📌 Risk Management:
Risk only 1–2% of your capital per trade.
Always confirm the setup on your chart before entry
CRYPTO MARKET UPDATE — Q3-4 2026 Part 2Mitigating the risk of bombarding you with too much info, I've split this analysis into two parts.
This is PART 2 to the previous update, found here:
__________________
9. Polygon (POL) — Ethereum scaling infrastructure
Polygon is a blockchain scaling ecosystem designed to make Ethereum transactions faster and cheaper while supporting decentralized apps and enterprise solutions.
😒6-month performance: -69%
👉Current price: ~$0.769
👉7-day performance: Trading activity remains subdued compared with previous cycles likely because investors wait for stronger ecosystem growth
👉6-month high: ~$0.186
👉6-month low: ~$0.0674
Polygon initially gained value because Ethereum’s high fees created demand for cheaper scaling solutions.The project has attracted partnerships with major companies and has continued developing its tech, but more application would need to become evident.
Q3-4 2026 Outlook:
Polygon remains relevant because Eth scaling is still a major challenge but competition from other Layer-2 networks has increased significantly, further dividing the slices of the pie which is investor money. A stronger recovery will likely depend on whether Polygon can continue attracting developers and scaled enterprise adoption.
10. Avalanche (AVAX) — Custom blockchain infrastructure
Avalanche is a high-speed blockchain platform designed for dapps, financial services, gaming, and enterprise blockchain solutions.
😒6-month performance: -71%
👉Current price: ~$6.78
👉7-day performance: Increased volatility as investors look for opportunities among heavily discounted Layer-1 projects.
👉6-month high: ~$15.08
👉6-month low: ~$5.68
Avalanche gained value because it offered fast transaction speeds, low fees, and the ability for organizations to create customized blockchain networks, its ecosystem has focused heavily on institutional applications and tokenized assets.
Q3-4 2026 Outlook:
AVAX remains one of the technically stronger Layer-1 blockchains. A recovery would likely depend on renewed developer activity and increased network usage.
11. Cardano (ADA) — Research-driven blockchain
Cardano is a smart-contract blockchain focused on security and scalability with an apparent research-based approach to blockchain development.
😒6-month performance: -79%
👉Current price: ~$0.169
👉 7-day performance: Weak compared with larger cryptocurrencies, despite cult like continued community support similar to XRP in early years.
👉 6-month high: ~$0.437
👉 6-month low: ~$0.138
Cardano initially gained value because of its strong academic approach, large community and belief that it could become a scalable alternative to Ethereum. Again, but, the biggest challenge has been converting technical development into widespread real-world adoption.
Q3-4 2026 Outlook:
Cardano remains one of the most recognized cryptocurrency projects, but investors are increasingly focused on measurable usage. For ADA to recover strongly, growth in decentralized applications and transactions will need to be visible.
12. Chainlink (LINK) — Connecting blockchain with realworld data
Chainlink provides decentralized oracle tech that allows smart contracts to securely access realworld information like financial data and market prices.
😒6-month performance: -54%
👉Current price: ~$7.75
👉24-hour trading volume: ~$300–700M
👉7-day performance: Relatively stable compared with many alts
👉6-month high: ~$30+
👉 6-month low: ~$6.99
Chainlink gained value because blockchains require reliable external data to interact with the real world. Its technology has become one of the most important infrastructure layers in defi
Q3-4 2026 Outlook:
Chainlink remains one of the strongest infrastructure projects in crypto. Growth in tokenisation and real-world asset integration could become major catalysts.
13. Uniswap (UNI) — Decentralized exchange leader
Uniswap is one of the largest decentralized cryptocurrency exchanges, users can trade assets without traditional intermediaries.
😒6-month performance: -64%
👉Current price: ~$3.34
👉7-day performance: Moderate activity as investors monitor the recovery of defi
👉6-month high: ~$6.45
👉6-month low: ~$2.3
Uniswap gained value because it became one of the most important platforms in decentralized finance, allowing billions of dollars in cryptocurrency trading without centralized exchanges.
Q3-4 2026 Outlook:
UNI’s future is closely linked to the overall health of DeFi,if decentralised exchanges regain market share and crypto activity increases, Uniswap remains one of the strongest positioned platforms.
14. Algorand (ALGO) — Fast and efficient blockchain
Algorand is a blockchain designed for fast transactions, scalability and financial applications.
😒6-month performance: -70%
👉Current price: ~$0.086
👉7-day performance: Larger volatility compared with other crypto assets.
👉6-month high: ~$0.145
👉6-month low: ~$0.079
Algorand initially gained value because of its technical design, fast settlement times and focus on financial applications. The challenge has been gaining enough adoption and developer activity to compete against larger ecosystems.
Q3-4 2026 Outlook:
Algorand remains technologically strong, but adoption will determine its future. The project needs increased usage and ecosystem growth to regain investor attention.
💡
After six months of heavy selling, crypto market is now at a point where many investors are asking whether this is a buying opportunity. Historically, some of the strongest crypto returns have occurred after periods of extreme fear and large corrections but, the market has changed.
The projects most likely to recover strongly into the end of 2026 will probably be those with:
✅ Real-world adoption
✅ Strong developer communities
✅ Institutional interest
✅ Sustainable ecosystems
✅ Clear utility beyond speculation
Bitcoin and Eth remain the strongest long-term market leaders while SOL, LINK, AAVE and selected AI-related projects remain closely watched because of their technology and adoption potential.
My final BUT - most older alts face a bigger challenge: proving that their ecosystems are still growing in a market where competition has increased dramatically.